
Here Is Why Stellar (XLM) Could Lose the $10 Billion Market Cap Soon
Stellar (XLM) price has declined by 10% over the past seven days as it struggles to maintain its $10 billion market cap, currently sitting at $10.87 billion. Momentum indicators such as the RSI show a sharp decline, signaling increased selling pressure and a potential move closer to oversold conditions.
The Ichimoku Cloud chart further reinforces a bearish outlook, with XLM trading below the cloud and showing no immediate signs of reversal. Traders are closely watching the $0.351 support level, as a failure to hold could lead to further declines, while a successful rebound may pave the way for a recovery toward $0.40 and beyond.
Stellar RSI Is Neutral, But Going Down
Stellar Relative Strength Index (RSI) is currently at 39.9, a sharp drop from over 60 just two days ago on December 24. This significant decline indicates a rapid loss of buying momentum, with the market shifting toward bearish sentiment.
The move from a previously strong neutral range into a lower RSI territory suggests increased selling pressure, bringing XLM closer to oversold conditions, though it has not yet fully entered that zone.
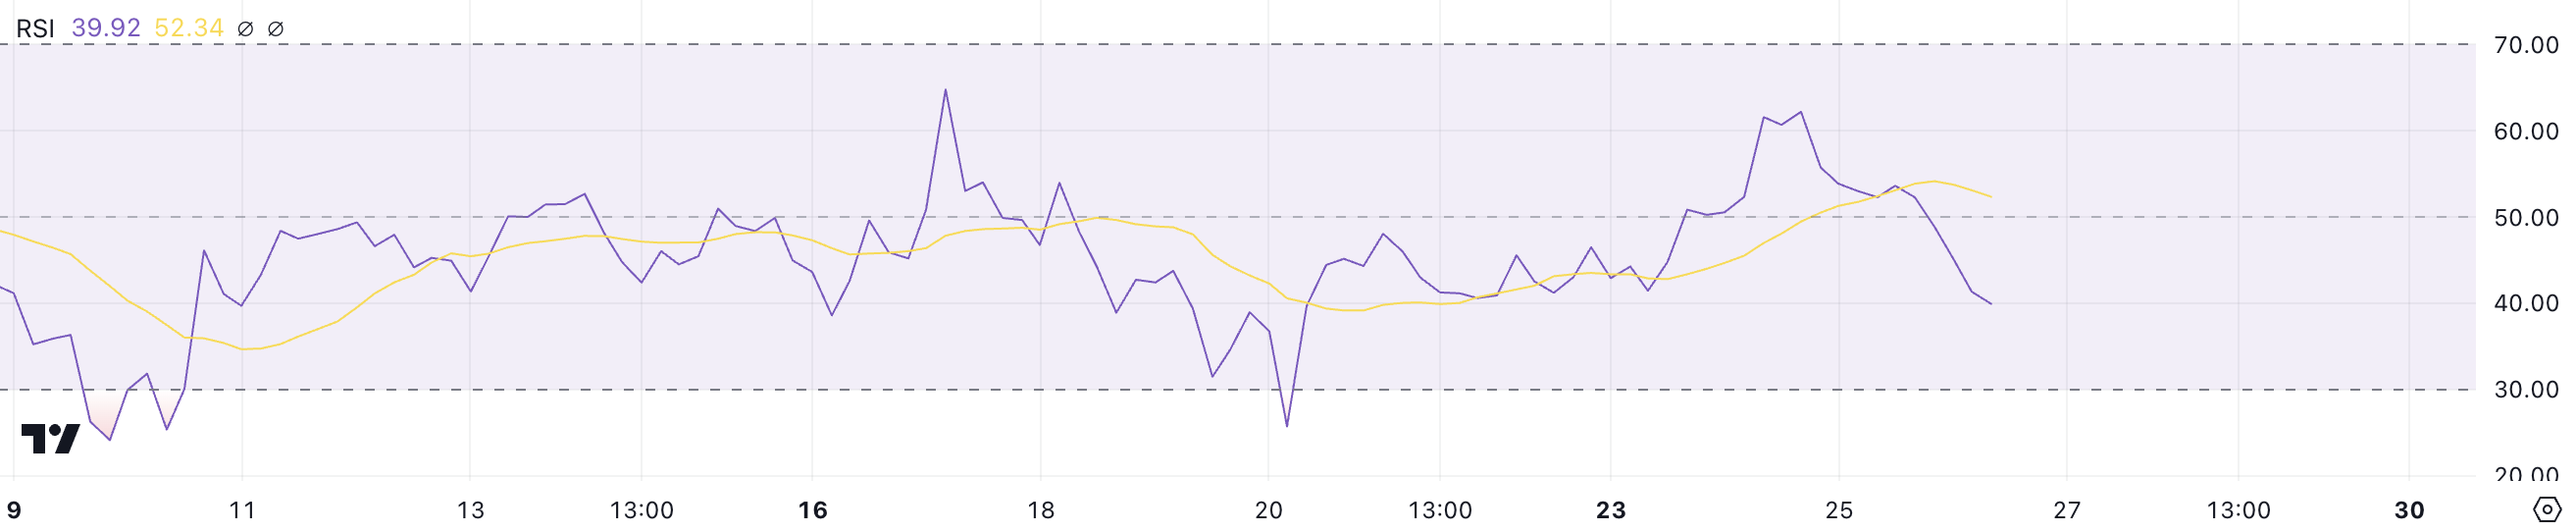 XLM RSI. Source: TradingView
RSI, a momentum oscillator, measures the speed and magnitude of price changes on a scale from 0 to 100. Values above 70 indicate overbought conditions that often precede a price correction, while values below 30 suggest oversold conditions, potentially signaling a rebound.
With XLM RSI at 39.9 and declining fast, the coin is teetering on the edge of bearish momentum, signaling the possibility of further downside in the short term. If the selling pressure continues, XLM’s price may test lower levels, but if buyers re-enter and stabilize the market, a potential rebound could prevent further losses.
XLM Ichimoku Cloud Shows a Strong Bearish Setup
The Ichimoku Cloud chart for XLM indicates a bearish outlook, as the price is currently trading below the cloud (red and green shaded areas), signaling downward momentum.
The blue conversion line (Tenkan-sen) is below the red baseline (Kijun-sen), further confirming the bearish sentiment and suggesting that sellers are currently dominating the market. Additionally, the price has failed to break above the cloud in recent attempts, reinforcing the strength of the bearish trend.
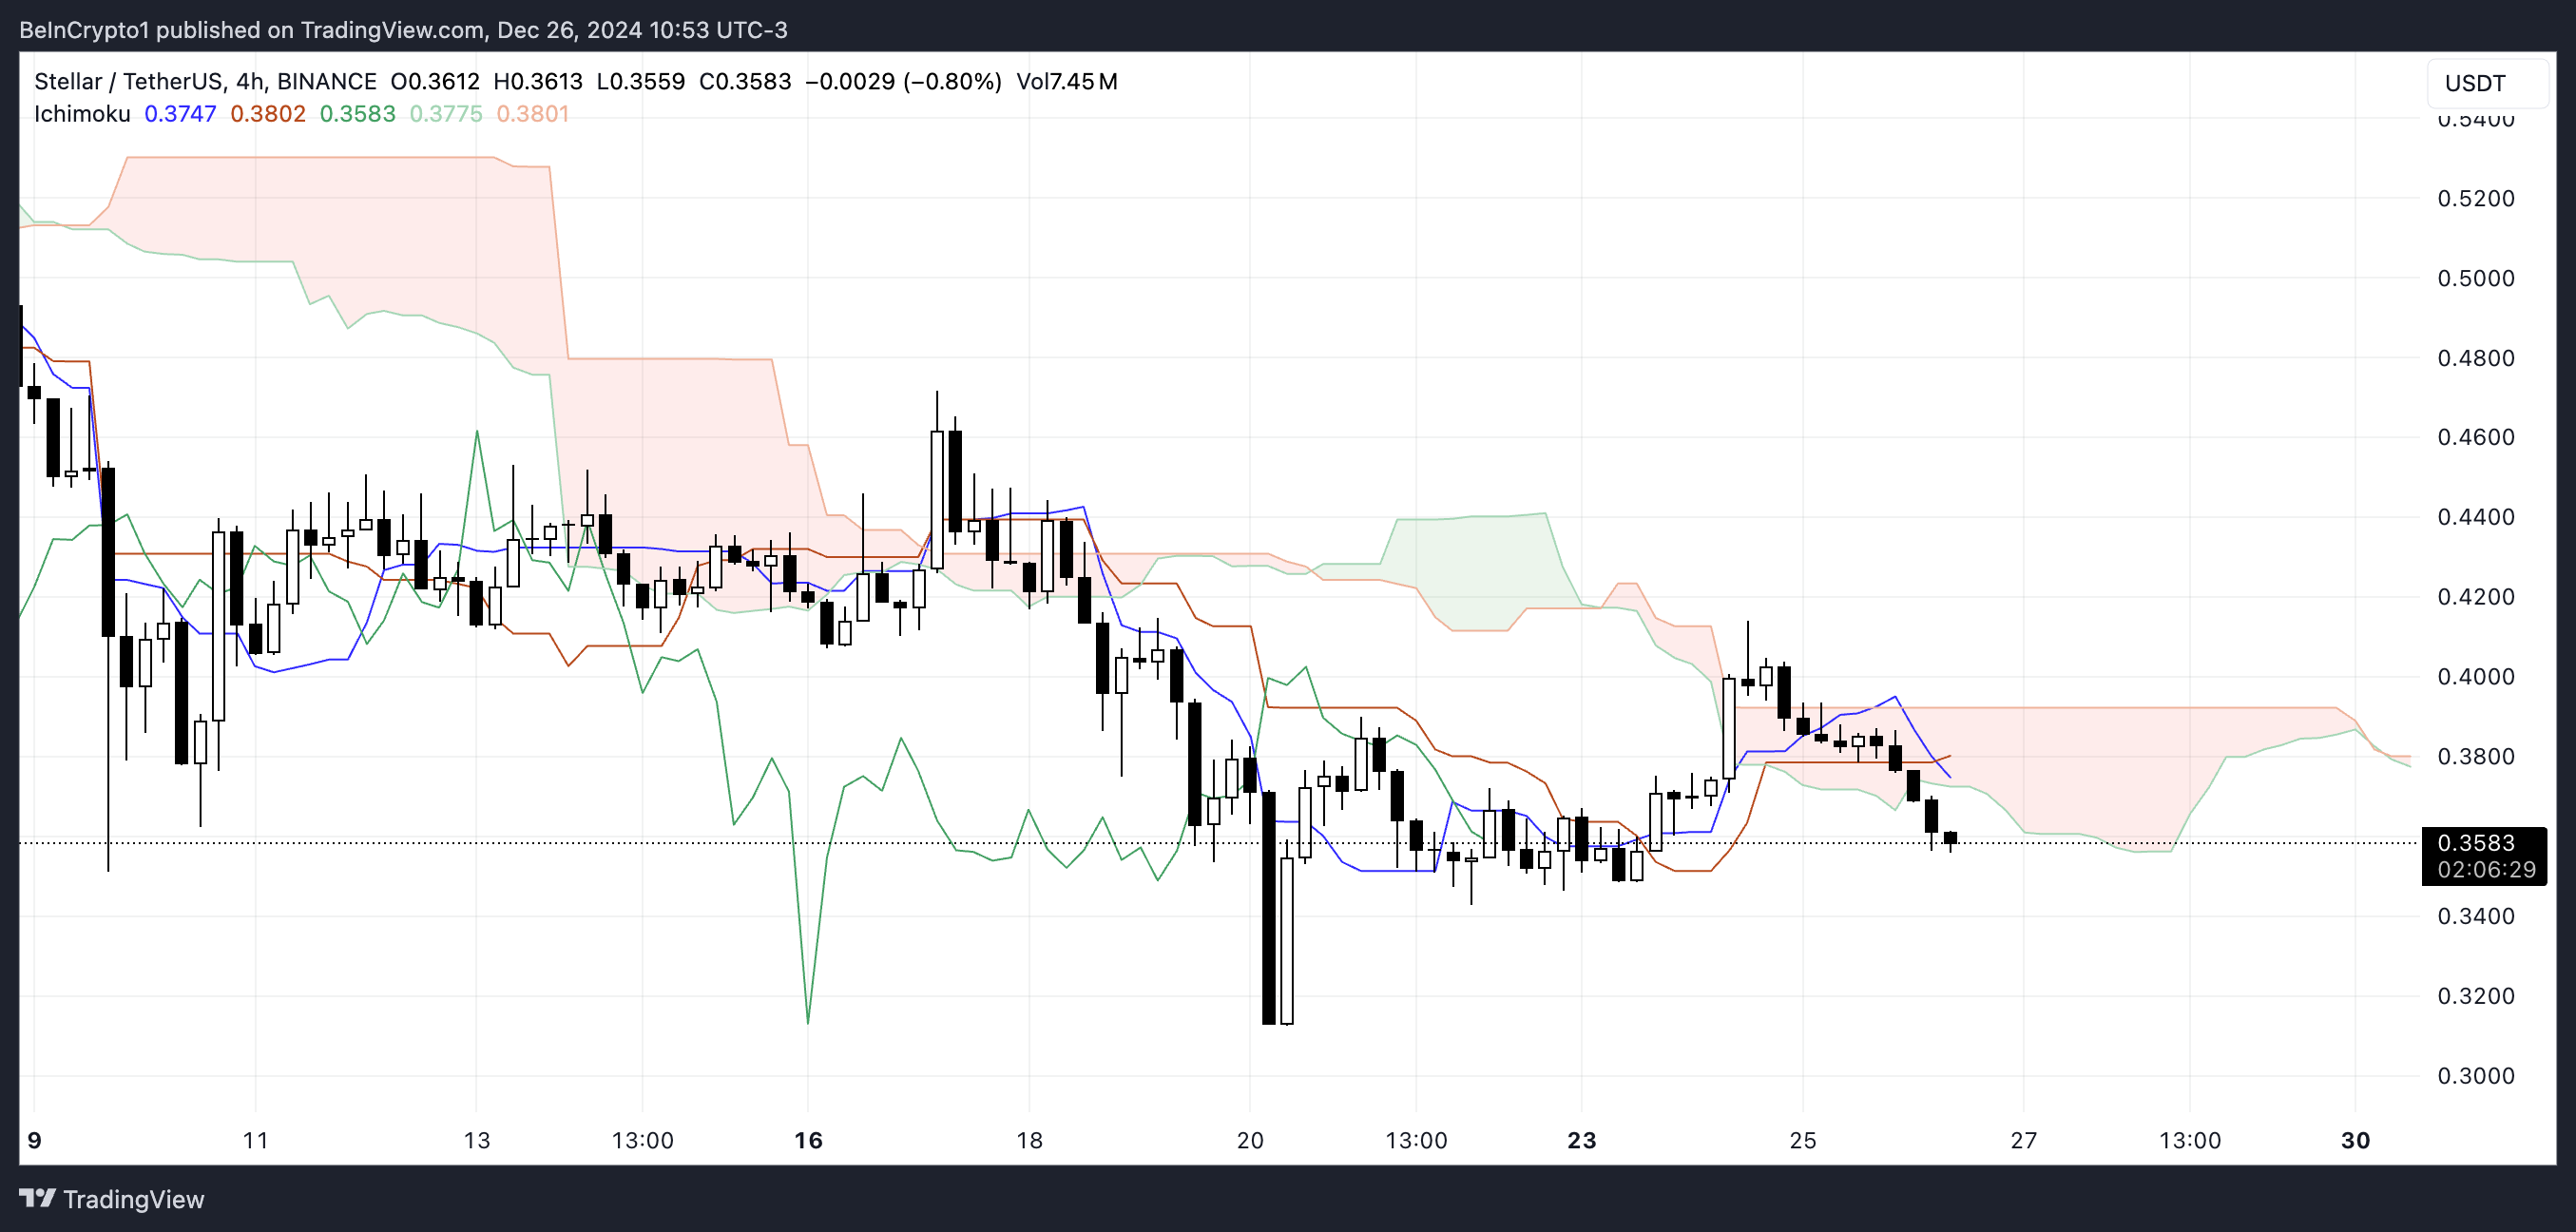 XLM Ichimoku Cloud. Source: TradingView
The lagging span (green line) is positioned below both the price and the cloud, further emphasizing the persistent bearish pressure.
The future cloud (red) shows that the leading span A (green edge) remains below the leading span B (red edge), projecting continued bearish sentiment in the near term. These indicators suggest that XLM price is likely to remain under pressure, with limited signs of an imminent reversal unless a significant shift in momentum occurs.
XLM Price Prediction: Will The $0.351 Support Hold Strong?
Stellar price is currently trading near a critical support level at $0.351.
If this support fails to hold, XLM price could face further bearish pressure, with the price potentially dropping as low as $0.31.
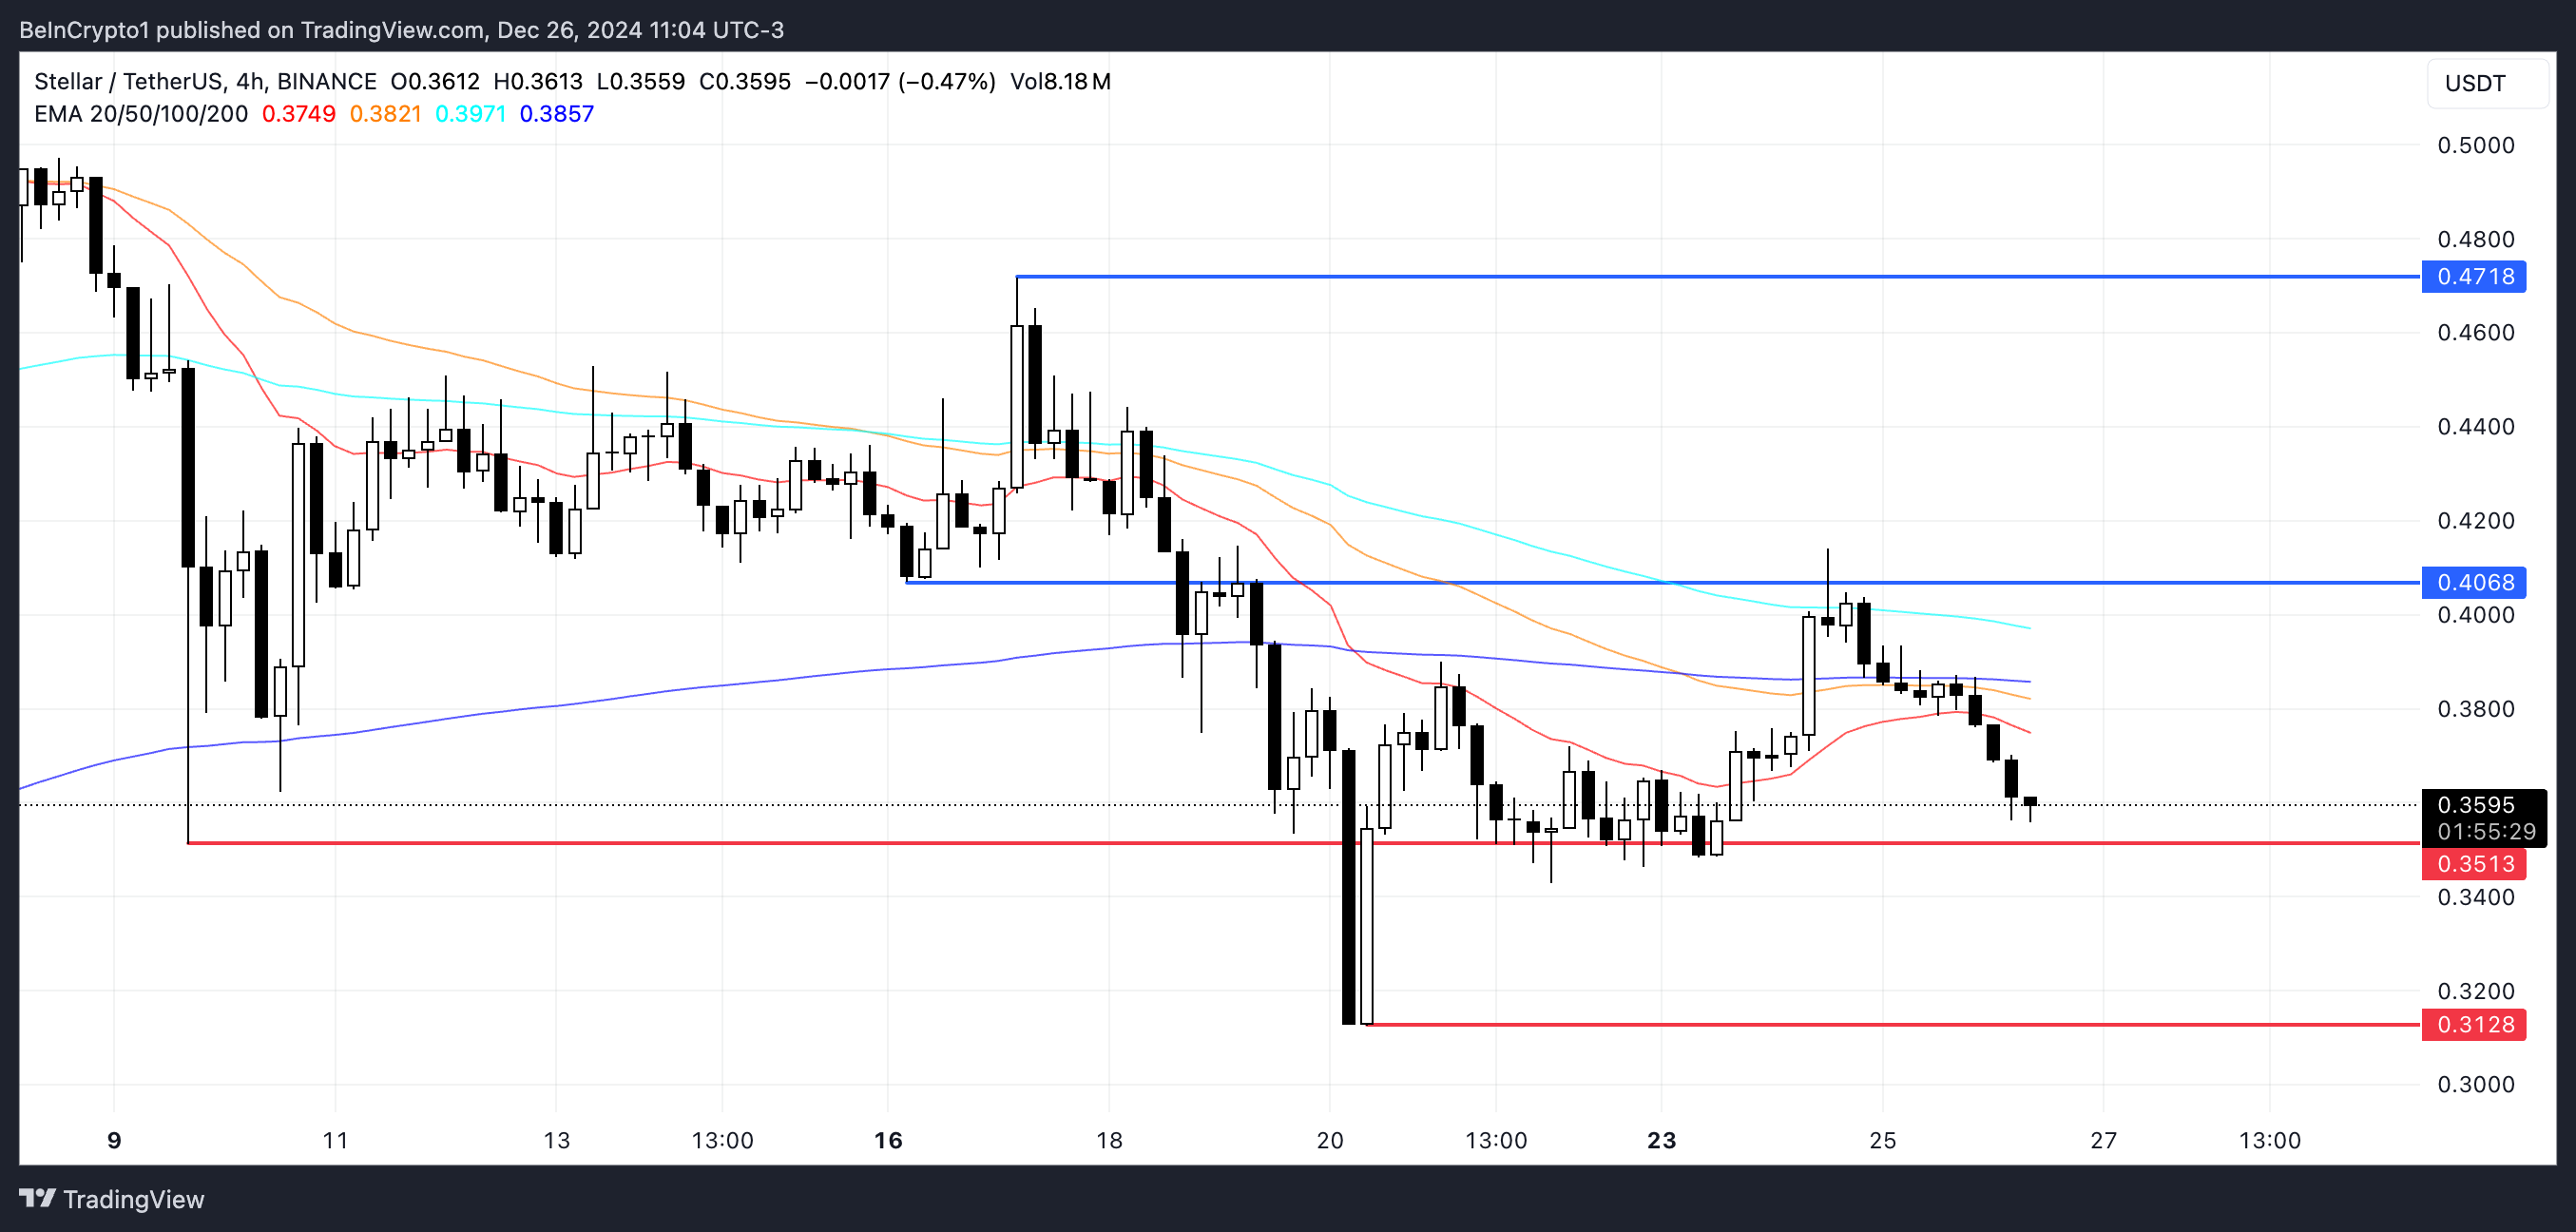 XLM Price Analysis. Source: TradingView
On the other hand, if XLM manages to hold above the $0.351 support and rebound, it could regain upward momentum and test the resistance at $0.40.
Breaking through this resistance could open the door for XLM to climb further, potentially testing the next significant level at $0.47.
Recommended Articles


