Why is ONDO’s price outlook bullish?

Source Fxstreet
  • DefiLlama data shows that Ondo TVL reached a new ATH of $613.75 million.
  • Ondo’s Supply Distribution metric shows whale accumulation.
  • On-chain data shows that ONDO’s daily trading volume is rising, and the supply of exchanges is decreasing.
  • Investors should be cautious about decreasing daily active addresses.


Ondo (ONDO) continues to trade higher at around $0.78 on Thursday, having rallied 14% so far this week following a 12% increase last week. This bullish momentum appears poised to continue as on-chain data shows a new all-time high in Total Value Locked (TVL), coupled with whale accumulation, rising trading volume, and decreasing supply on exchanges.


ONDO bulls remain strong as on-chain metrics indicate continued momentum

Crypto aggregator platform DefiLlama data shows a bullish outlook for Ondo. The data shows that Ondo’s TVL increased from $537.13 million at the end of August to $618.32 million on September 22, making a new all-time high (ATH).

This rise in TVL indicates growing activity and interest within the Ondo ecosystem. It suggests that more users deposit or utilize assets within ONDO-based protocols, adding credence to the bullish outlook.
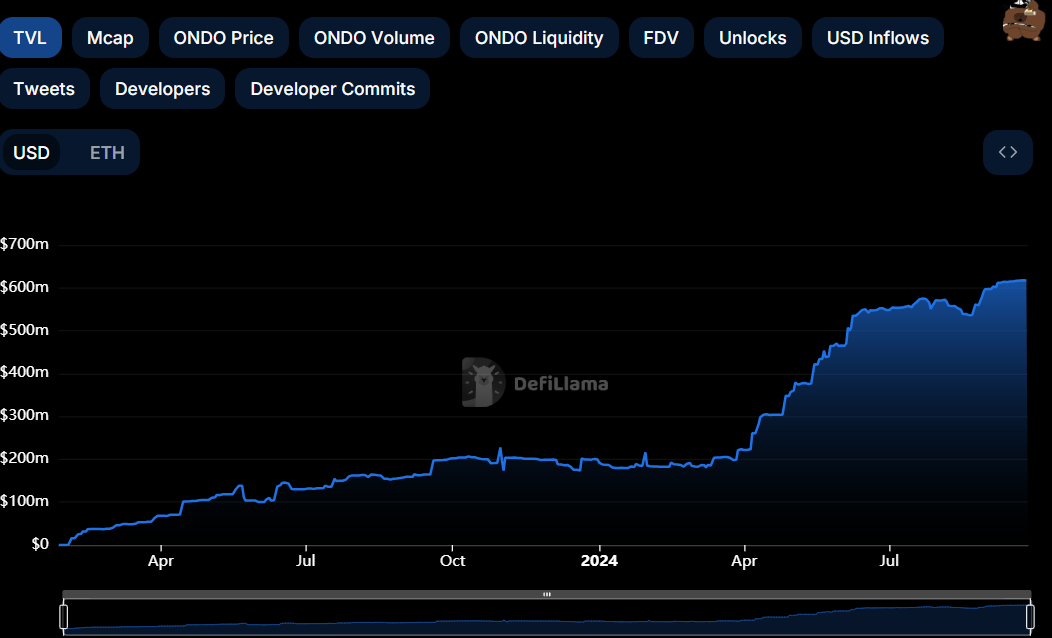
ONDO TVL chart

ONDO TVL chart

Moreover, Santiment’s Supply Distribution metric shows that whales are accumulating ONDO tokens. This metric shows that wallet holding has increased from Monday to Thursday. During this period, holders holding 100,000 to 1 million, 1 million to 10 million, and 10 million to 100 million tokens have increased from 79.17 million to 80.24 million, 395.32 million to 403.05 million and 479.60 million to 908.05 million, respectively. This development shows that investors have confidence in ONDO tokens and are accumulating.

ONDO Supply Distribution metric chart

ONDO Supply Distribution metric chart

Additionally, Ondo’s daily trading volume and supply on exchanges align with the bullish outlook. Ondo’s daily trading volume has risen from 202.18 million to 496.96 million from September 15 to Thursday, the highest since August 5. This rise indicates a surge in traders’ interest and liquidity in the Ondo chain.

The exchange’s supply fell from 345 million to 330 million during the same period. This fall indicates increasing confidence among investors as holders remove ONDO tokens from exchanges and store them in cold wallets.

ONDO Supply on Exchanges and Volume chart 

ONDO Supply on Exchanges and Volume chart 

Despite a new all-time high in TVL, whales accumulating, rising trading volume and decreasing supply in exchanges, Ondo’s daily active addresses have remained low. Declining addresses point to lower demand for the network. This suggests that investors should exercise caution when anticipating a sudden price increase.

ONDO Daily Active Addresses chart

ONDO Daily Active Addresses chart

Disclaimer: For information purposes only. Past performance is not indicative of future results.
placeholder
Natural Gas sinks to pivotal level as China’s demand slumpsNatural Gas price (XNG/USD) edges lower and sinks to $2.56 on Monday, extending its losing streak for the fifth day in a row. The move comes on the back of China cutting its Liquified Natural Gas (LNG) imports after prices rose above $3.0 in June. It
Author  FXStreet
Jul 01, 2024
Natural Gas price (XNG/USD) edges lower and sinks to $2.56 on Monday, extending its losing streak for the fifth day in a row. The move comes on the back of China cutting its Liquified Natural Gas (LNG) imports after prices rose above $3.0 in June. It
placeholder
The dollar weakened, equities dipped, and gold hit record highsThe dollar weakened, equities fell, and gold set new records on Wednesday as investors waited for a Fed rate cut later in the day.
Author  Cryptopolitan
Sep 17, 2025
The dollar weakened, equities fell, and gold set new records on Wednesday as investors waited for a Fed rate cut later in the day.
placeholder
ECB Policy Outlook for 2026: What It Could Mean for the Euro’s Next MoveWith the ECB likely holding rates steady at 2.15% and the Fed potentially extending cuts into 2026, EUR/USD may test 1.20 if Eurozone growth proves resilient, but weaker growth and an ECB pivot could pull the pair back toward 1.13 and potentially 1.10.
Author  Mitrade
Dec 26, 2025
With the ECB likely holding rates steady at 2.15% and the Fed potentially extending cuts into 2026, EUR/USD may test 1.20 if Eurozone growth proves resilient, but weaker growth and an ECB pivot could pull the pair back toward 1.13 and potentially 1.10.
placeholder
My Top 5 Stock Market Predictions for 2026Five 2026 market predictions written in a native, news-style voice: AI’s winners and losers, broader sector leadership, dividend demand, valuation cooling as the Shiller CAPE sits at 39 (Dec. 31, 2025), and quantum-computing bursts—while keeping all original facts and numbers unchanged.
Author  Mitrade
Jan 06, Tue
Five 2026 market predictions written in a native, news-style voice: AI’s winners and losers, broader sector leadership, dividend demand, valuation cooling as the Shiller CAPE sits at 39 (Dec. 31, 2025), and quantum-computing bursts—while keeping all original facts and numbers unchanged.
placeholder
Gold Price Forecast: XAU/USD opens lower around $4,450 on fears of widening Iran conflictsGold price (XAU/USD) opens over 1% lower to near $4,445.00 on Monday, as oil prices have rallied further on fears of further widening of conflicts in the Middle East. WTI Oil price is up almost 3% above $102.50 in the opening trade, increasing fears of higher inflation expectations globally.
Author  FXStreet
Yesterday 01: 40
Gold price (XAU/USD) opens over 1% lower to near $4,445.00 on Monday, as oil prices have rallied further on fears of further widening of conflicts in the Middle East. WTI Oil price is up almost 3% above $102.50 in the opening trade, increasing fears of higher inflation expectations globally.
goTop
quote