Bitcoin Approaches $65,000: Is Now The Perfect Time To Buy?

Source Newsbtc

As Bitcoin price valuation inches closer to the $65,000 mark, the asset has grabbed the attention of market analysts, with one recently highlighting a key indicator that now suggests a potential further recovery in BTC’s price.

Particularly, according to a recent post on the CryptoQuant Quicktake platform by an analyst under the pseudonym ‘Darkfost,’ the Bitcoin Stock-to-Flow (S2F) reversion chart is now showing a major buy signal for Bitcoin.

S2F Signal Prime Buy Opportunity

The S2F model is widely used to forecast Bitcoin’s price by measuring its scarcity. It indicates whether the market is leaning towards a buy or sell zone based on its supply rate.

Darkfost explained that the S2F reversion chart is now signalling a potential buying opportunity, with the SF ratio dipping below 1, which represents a green zone.

Bitcoin S2F reversion chart.

This zone suggests that Bitcoin may be undervalued compared to its historical trend, making it a potential time to accumulate BTC.

The analyst elaborated that the last time Bitcoin entered this buy zone was in June and September of 2023, followed by notable price recoveries.

Investors who had taken positions during these periods saw favorable returns as Bitcoin’s price rallied in the following months.

Notably, the S2F model’s predictive nature has often been a major tool for traders looking to capitalize on long-term Bitcoin trends. Asides its movement below 1, when the SF ratio climbs above 1, it signals a red zone, or profit-taking opportunity.

Bitcoin Price Action And Key Technical Levels

In addition to the S2F signal, Bitcoin’s price action in the past few days has also resulted from recent macroeconomic events, particularly the US Federal Reserve’s interest rate cut.

Following the rate reduction by 50 basis points on Wednesday, Bitcoin surged past $64,000 in the early hours of today, marking a significant rally given the asset has been in a bearish and accumulation phase prior.

However, as of now, the cryptocurrency has retraced slightly from its 24-hour high above $64,000 and is trading at $63,036, down by a mere 0.1% over the past day.

Bitcoin (BTC) price chart on TradingView

Meanwhile, despite the S2F reversion chart pointing to a potential buying opportunity, another crypto analyst, Ali, has raised concerns about Bitcoin’s near-term future.

In a recent post on X, Ali highlighted Bitcoin’s current position relative to its 200-day Simple Moving Average (SMA), a critical indicator for determining the strength of a market trend. Bitcoin is currently testing this level, which historically has been an essential factor in confirming a bull run.
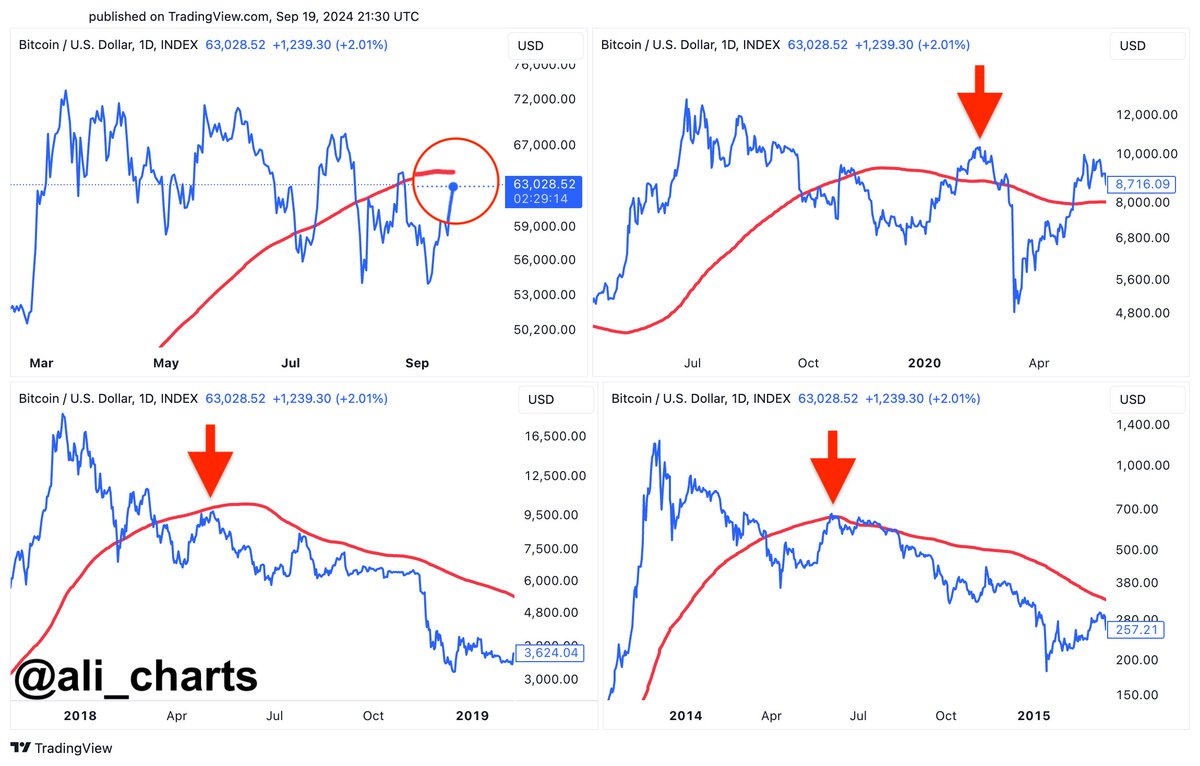
Bitcoin price chart.

Ali noted that previous failures to reclaim the 200-day SMA, as seen in 2020, 2018, and 2014, led to significant price corrections. If Bitcoin fails to hold above this level in the coming days, it could signal a broader market downturn.

However, if it maintains support, Bitcoin could continue its upward trajectory, setting the stage for further gains.

Featured image created with DALL-E, Chart from TradingView

Disclaimer: For information purposes only. Past performance is not indicative of future results.
placeholder
Top 3 Price Prediction: Bitcoin, Ethereum, Ripple – BTC, ETH and XRP Look for a Foothold After a Sharp ShakeoutBitcoin trades near $92,600 after a dip below $90,000, while Ethereum around $3,118 and XRP near $2.21–$2.23 sit on key support zones, as BTC, ETH and XRP all try to turn a sharp correction into a tradable rebound rather than a deeper slide.
Author  Mitrade
Nov 19, Wed
Bitcoin trades near $92,600 after a dip below $90,000, while Ethereum around $3,118 and XRP near $2.21–$2.23 sit on key support zones, as BTC, ETH and XRP all try to turn a sharp correction into a tradable rebound rather than a deeper slide.
placeholder
Bitcoin Volatility Spikes: Is Options-Driven Pricing Making a Comeback?Bitcoin's volatility is surging, suggesting a shift back to options-driven price action seen before Bitcoin ETFs were launched.
Author  Mitrade
Nov 24, Mon
Bitcoin's volatility is surging, suggesting a shift back to options-driven price action seen before Bitcoin ETFs were launched.
placeholder
2025 Black Friday is coming! Which stocks may see volatility?Coming on the day right after Thanksgiving in the United States, Back Friday marks the start of the holiday shopping season. Sales data from this shopping frenzy day reflects investor confidence and consumer trends. The National Retail Federation (NRF) predicts that holiday season (Nov and Dec) retail sales in 2025 will likely exceed $1 trillion for the very first time, which represents a year-over-year increase of 3.7 to 4.2 percent. Historic data from the past decade show that the retail sector has generally outperformed the S&P 500 during the weeks before and after Black Friday. The following retailing companies are expected to be big winners:
Author  Insights
Nov 24, Mon
Coming on the day right after Thanksgiving in the United States, Back Friday marks the start of the holiday shopping season. Sales data from this shopping frenzy day reflects investor confidence and consumer trends. The National Retail Federation (NRF) predicts that holiday season (Nov and Dec) retail sales in 2025 will likely exceed $1 trillion for the very first time, which represents a year-over-year increase of 3.7 to 4.2 percent. Historic data from the past decade show that the retail sector has generally outperformed the S&P 500 during the weeks before and after Black Friday. The following retailing companies are expected to be big winners:
placeholder
Gold Price Forecast: XAU/USD rises to near $4,150 as Fed rate cut bets growGold price (XAU/USD) attracts some buyers to around $4,140 during the early Asian session on Tuesday. The precious metal rises on growing expectations of a US Federal Reserve (Fed) interest rate cut in the December policy meeting.
Author  FXStreet
22 hours ago
Gold price (XAU/USD) attracts some buyers to around $4,140 during the early Asian session on Tuesday. The precious metal rises on growing expectations of a US Federal Reserve (Fed) interest rate cut in the December policy meeting.
placeholder
Bitcoin Bleeds to $86K, But This Key Indicator Screams "The Top Isn't In"Bitcoin’s adjusted Spent Output Profit Ratio (aSOPR) has spent nearly two years coiling below the extremes seen at past bull-market peaks, even as BTC trades around $86,300 and down 9% on the week — a setup that leaves open the possibility that this cycle’s true top may still lie ahead.
Author  Mitrade
16 hours ago
Bitcoin’s adjusted Spent Output Profit Ratio (aSOPR) has spent nearly two years coiling below the extremes seen at past bull-market peaks, even as BTC trades around $86,300 and down 9% on the week — a setup that leaves open the possibility that this cycle’s true top may still lie ahead.
goTop
quote