

This Solana Memecoin Climbs 36%, On The Verge Of Reaching $1 And Record Highs

Source Newsbtc

The excitement surrounding memecoins is making a notable comeback as Solana-based tokens outperform larger cryptocurrencies, particularly following the recent announcement from the Federal Reserve regarding interest rate cuts.

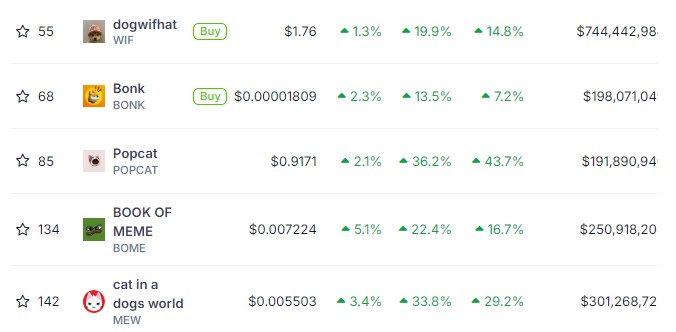
Among the standout performers is Popcat (POPCAT), which has experienced a remarkable 36% spike in just 24 hours, bringing the token close to its all-time high achieved in July of this year, underscoring the renewed enthusiasm for memecoins amidst changing economic conditions.

Popcat Records Nearly 100% Gain In A Month

On Wednesday, NewsBTC reported that the Federal Reserve announced its first rate cut in four years, reducing the federal funds rate by 0.50 percentage points. This adjustment marks a significant shift since the onset of the COVID-19 pandemic, lowering the target range to 4.75%–5%, down from 5.25%–5.5%. 

These rates were the highest seen since 2001, and the decision is seen as a bullish signal for the broader market, suggesting potential price increases shortly, even as volatility is expected.

In response to this news, Solana saw nearly a 10% surge in the last 24 hours, edging closer to the $150 mark after successfully reclaiming key support levels. This momentum has fostered renewed confidence in tokens built on the Solana network, exemplified by Popcat’s performance.
Solana

Currently trading at $0.918, Popcat is now just 7% shy of its all-time high of $0.993 reached two months ago. The latest increase coincides with a staggering 236% rise in trading volume, nearing the $200 million mark within just 48 hours, according to CoinGecko data. 

Looking at longer time frames, Popcat has demonstrated significant growth, recording a 44% increase over the past week and a 62% rise over the last two weeks. 

This translates to nearly a 100% gain in the past month, particularly striking compared to larger cryptocurrencies that have faced losses following significant market downturns on August 5 and September 6.

Key Levels To Watch For The Solana-Based POPCAT

Despite the uptrend recorded, POPCAT encountered challenges in maintaining its momentum earlier today. The token reached a daily high of $0.936 but struggled to consolidate above a critical resistance level at $0.939 on its POPCAT/USDT daily chart. 

This resistance has emerged as one of the last significant hurdles for Popcat before it can approach its all-time highs recorded in July. Should the token break through this barrier, the next resistance level is $0.971. 

Not surpassing both levels could lead to a brief phase of consolidation, which may be necessary for the token to gain the strength required to push further upward. However, if the current uptrend loses momentum, the inability to break these resistance levels could hinder Popcat’s progress.

On the downside, bullish investors should closely monitor the $0.834 level, as it serves as the nearest support floor for the memecoin. It could indicate a potential correction if the price falls below this support. 

In such a scenario, the next support level on the daily chart is significantly lower at $0.72. If the price reaches this level, it would represent a considerable decline of approximately 21% from its current trading price of $0.918.

Solana

Featured image from DALL-E, chart from TradingView.com

Disclaimer: For information purposes only. Past performance is not indicative of future results.
placeholder
China's factories are pricing in 5.7%. Its shoppers are pricing in 0.7%.China's October PPI rose 5.7% year on year, the fastest since June 2022, while CPI slowed to 0.7% and core CPI to 0.8%. Input prices rose faster than factory-gate prices, squeezing mid-stream margins by roughly five percentage points. The Hang Seng fell 0.13% on a day the S&P 500 rose 2.35%, the only major market to sit out the risk-on session.
Author  Irene Q.
Nov 10, Tue
China's October PPI rose 5.7% year on year, the fastest since June 2022, while CPI slowed to 0.7% and core CPI to 0.8%. Input prices rose faster than factory-gate prices, squeezing mid-stream margins by roughly five percentage points. The Hang Seng fell 0.13% on a day the S&P 500 rose 2.35%, the only major market to sit out the risk-on session.
placeholder
Gold Price Analysis Today | Forex Gold Analysis | XAU/USD Analysis - November 11, 2026Get the latest gold price analysis, forex gold insights, and XAU/USD analysis for November 11, 2026. Read on for the details.
Author  Mitrade
Nov 11, Wed
Get the latest gold price analysis, forex gold insights, and XAU/USD analysis for November 11, 2026. Read on for the details.
placeholder
Gold Extends Slide Below $4,000 as Rising US Inflation, Fed December Hike Bets Pressure Prices On November 12, gold prices (XAUUSD) extended their recent losses, falling further below $4,000 in early Asian trading to hit an intraday low near $3,968, marking a third consecutive day
Author  TradingKey
Yesterday 02: 00
On November 12, gold prices (XAUUSD) extended their recent losses, falling further below $4,000 in early Asian trading to hit an intraday low near $3,968, marking a third consecutive day
placeholder
Gold closed below $4,000 again — the ETF crowd and central banks stayed, the momentum money leftSpot gold is trading near $3,999, its third consecutive lower daily low, after a 5.00% 10-year yield and a 102.85 dollar index raised the odds of a December hike to 87%. But the selling is not coming from the strategic holders: managed-money net longs fell to 324 tonnes, a 21-week low, and Goldman Sachs attributes roughly 95% of five weeks of selling to non-reportable positions. ETFs still hold a record 4,256 tonnes and central banks bought 321 tonnes in Q3. The table below sets the triggers, directions and levels.
Author  Irene Q.
Yesterday 03: 20
Spot gold is trading near $3,999, its third consecutive lower daily low, after a 5.00% 10-year yield and a 102.85 dollar index raised the odds of a December hike to 87%. But the selling is not coming from the strategic holders: managed-money net longs fell to 324 tonnes, a 21-week low, and Goldman Sachs attributes roughly 95% of five weeks of selling to non-reportable positions. ETFs still hold a record 4,256 tonnes and central banks bought 321 tonnes in Q3. The table below sets the triggers, directions and levels.
placeholder
US October PPI Preview: Fed Rate Hike Expectations Rise, PPI May Be Key Variable; How Will US Stocks, Dollar, and Gold Move?On Friday (Nov. 13) Eastern Time, the U.S. will release the October Producer Price Index (PPI). Following the October CPI once again exceeding expectations, the market will look to the PP
Author  TradingKey
Yesterday 08: 36
On Friday (Nov. 13) Eastern Time, the U.S. will release the October Producer Price Index (PPI). Following the October CPI once again exceeding expectations, the market will look to the PP
goTop
quote