


The Stock Market Just Flashed a Signal We've Only Seen Once Before. Here's What History Says Could Come Next.
Key Points
The stock market has faced certain headwinds this year, such as concerns about import tariffs and a potential AI bubble.
The S&P 500 still is heading for a double-digit gain.
- 10 stocks we like better than S&P 500 Index ›
The S&P 500 has had its ups and downs this year -- concerns about President Donald Trump's import tariff plan, as well as worries about a potential artificial intelligence (AI) bubble forming, have represented headwinds. But the tailwinds have proven to be stronger, as the index reached multiple record highs and is heading for a double-digit increase.
Overall enthusiasm about the game-changing potential of AI has pushed AI stocks higher, and even as some concerns about valuations circulate, the positive momentum continues. Investors also are optimistic about a lower interest rate environment supporting corporate earnings growth. All of this has made 2025 a pretty good year for investors.
Where to invest $1,000 right now? Our analyst team just revealed what they believe are the 10 best stocks to buy right now. Continue »
Now, as we look ahead to the new year, it's important to pay attention to various elements that could impact stock performance. And there's one in particular that investors can't afford to miss. The stock market just flashed a signal we've only seen once before -- and here's what history says may come next.

Image source: Getty Images.
The S&P 500's performance this year
First, though, let's take a closer look at the stock market environment this year. The S&P 500 advanced in the early weeks of the year, then spiraled downward amid concern about the president's tariffs on imports. Investors worried the move would weigh on consumers' wallets and on companies' costs -- and all of this would hurt earnings. But Trump's negotiations with countries and exemptions on certain goods calmed those fears, and the market rebounded.
As I mentioned earlier, the S&P 500 reached another trouble spot last month as investors questioned whether an AI bubble was taking shape. But strong earnings and forecasts from AI players as well as a focus on the long-term potential of AI have helped maintain investors' interest in these players, even as their valuations have climbed.
Meanwhile, investors also have piled into growth stocks with the idea that today's lower interest rate backdrop will favor these sorts of players -- it means lower borrowing costs for these companies and potentially stronger buying power for their customers.
All of this has helped push the S&P 500 to a gain of about 15% since the start of the year. Now, for a clue about what's next, let's look to the signal the market recently flashed...
Valuation worries
Earlier, I spoke of worries about a possible AI bubble, a situation that arises when the price of a particular asset surpasses what it's truly worth. Valuations may be exceptionally high for certain AI stocks, but stocks overall also have shown hefty price tags in recent times.
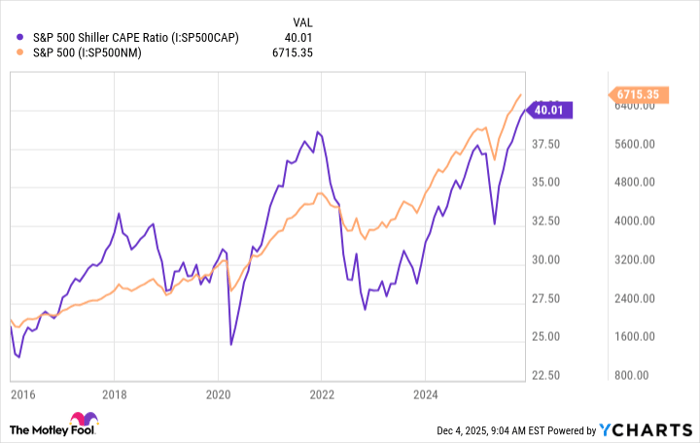
We can see this through the S&P 500 Shiller CAPE ratio, a tool that measures stock price in relation to earnings per share over a decade -- this allows for the impact of economic shifts. So, it offers us a clear idea of whether a stock is expensive or not.
This ratio recently reached the level of 40, something it's only done once before -- during the dot-com bubble around the year 2000 -- since the S&P 500 launched as a 500-company index.
This means stocks are trading at one of their highest levels ever, and history shows us that following such peaks, the S&P 500 generally declines.

S&P 500 Shiller CAPE Ratio data by YCharts
After the S&P 500 Shiller CAPE ratio surpassed 40 in late 1999, the S&P 500 went on to lose 37% over three years.
More recently, on other occasions when the ratio reached a peak, the S&P 500 then fell, but declines have been short-lived.
S&P 500 Shiller CAPE Ratio data by YCharts
Some good news for investors
So, today, with the S&P 500 Shiller CAPE ratio at almost a record-high level, stocks soon could be heading for a drop. I won't end this article on a sour note, though, because I have two pieces of good news for you. First, as we've seen above, on some occasions the decline won't be very steep and won't last long.
Second, and most importantly, the index always has recovered and advanced over the long term. This is fantastic news for you as a long-term investor, as it means that any of these dips -- short or long -- will have a limited impact on your performance. If you own quality stocks, they're likely to rebound and deliver a win over the long haul.
Should you invest $1,000 in S&P 500 Index right now?
Before you buy stock in S&P 500 Index, consider this:
The Motley Fool Stock Advisor analyst team just identified what they believe are the 10 best stocks for investors to buy now… and S&P 500 Index wasn’t one of them. The 10 stocks that made the cut could produce monster returns in the coming years.
Consider when Netflix made this list on December 17, 2004... if you invested $1,000 at the time of our recommendation, you’d have $556,658!* Or when Nvidia made this list on April 15, 2005... if you invested $1,000 at the time of our recommendation, you’d have $1,124,157!*
Now, it’s worth noting Stock Advisor’s total average return is 1,001% — a market-crushing outperformance compared to 194% for the S&P 500. Don’t miss out on the latest top 10 list, available when you join Stock Advisor.
See the 10 stocks »
*Stock Advisor returns as of December 1, 2025
Adria Cimino has no position in any of the stocks mentioned. The Motley Fool has no position in any of the stocks mentioned. The Motley Fool has a disclosure policy.
Recommended Articles


