


Ethereum price forecast amid $39 million outflows in ETH ETFs
- Ethereum ETFs break inflows streak with over $39 million in net outflows.
- BlackRock's crypto ETF on-chain holdings have overtaken those of Grayscale ETFs.
- Donald Trump holds over $2 million in Ethereum, per Arkham Intelligence.
- Ethereum could strengthen bearish momentum if its price breaks below the lower rising trendline of an ascending triangle.
Ethereum (ETH) is up more than 2% on Friday as ETH ETFs broke their three-day inflow streak with over $39 million in outflows. Meanwhile, ETH's potential rally is hindered by a key trendline that follows a three-year symmetry triangle.
Daily digest market movers: Ethereum ETF outflows, BlackRock surpasses Grayscale, Trump ETH holdings
Ethereum ETFs ended their three-day net inflows streak on Thursday after recording net outflows of $39.2 million, according to Farside Investors data. The outflows were characterized by an exodus of $42.5 million in Grayscale's ETHE and minor to zero flows in other products.
Following the flows across ETH ETFs, Arkham Intelligence reported in an X post on Friday that BlackRock's on-chain holdings across its Bitcoin and Ethereum ETFs, IBIT and ETHA, have surpassed that of Grayscale's GBTC, BTC Mini, ETHE and ETH Mini.
BLACKROCK ETF HOLDINGS OVERTAKE GRAYSCALE FOR THE FIRST TIME
— Arkham (@ArkhamIntel) August 16, 2024
BlackRock’s ETFs IBIT and ETHA have just overtaken Grayscale’s ETFs GBTC, BTC Mini, ETHE and ETH Mini in on-chain holdings.
Blackrock ETFs now have the largest collective holdings of any provider.
BlackRock ETF… pic.twitter.com/PB41LEGc97
Meanwhile, Nasdaq ISE, LLC withdrew its proposal to trade options on Ethereum ETFs on August 13, according to a Thursday filing on the Securities & Exchange Commission's (SEC) website.
Additionally, data from Arkham Intelligence reveals that Republican presidential candidate Donald Trump holds $3.6 million in cryptocurrency, including $1.29 million worth of Ethereum and $986,000 worth of Wrapped Ethereum. This brings his combined Ethereum holdings to over $2 million.
Donald Trump has made several pro-crypto moves in the past months in hopes of winning crypto-centric voters' support as the US presidential election draws closer.
While the holdings may indicate the former President's positive stance toward crypto, it's important to note that the cryptocurrencies may have come from the sale of his NFT collection as opposed to direct investment.
ETH technical analysis: Ethereum's next move is dependent on key triangles
Ethereum is trading around $2,610 on Friday, up more than 2% on the day. The price decline triggered over $72 million in ETH liquidations, with long and short liquidations accounting for $63.4 and $8.9 million, respectively.
Since the market decline on August 5, ETH has been consolidating due to a descending trendline that has constantly prevented any attempt upward. The trendline suggests ETH could decline toward the $2,000 to $2,200 range in the coming weeks before staging a fresh rally.
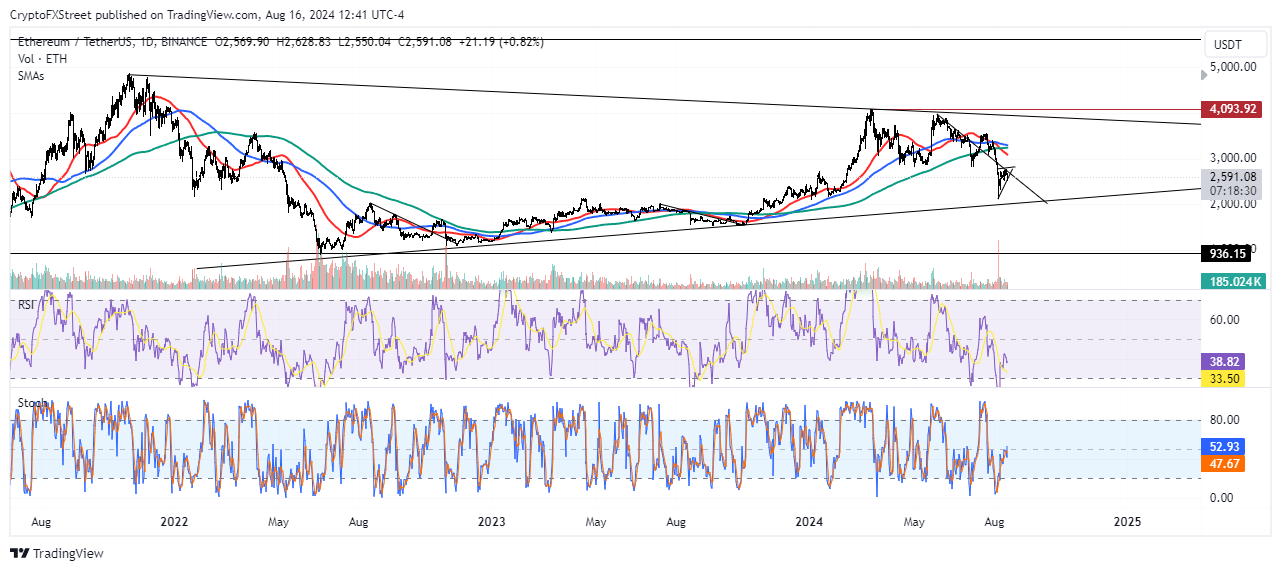
ETH/USDT Daily chart
As indicated by key descending trendlines in the chart above, ETH posted a similar move from August 2022 to November 2022 and July 2023 to October 2023 before eventually seeing a rally.
A successful completion of this move could see ETH attempt a move toward the upper trendline of a three-year symmetry triangle.
On the 4-hour chart, ETH is attempting to breach a rising lower trendline of an ascending triangle. Such a move will give strength to the bearish momentum.
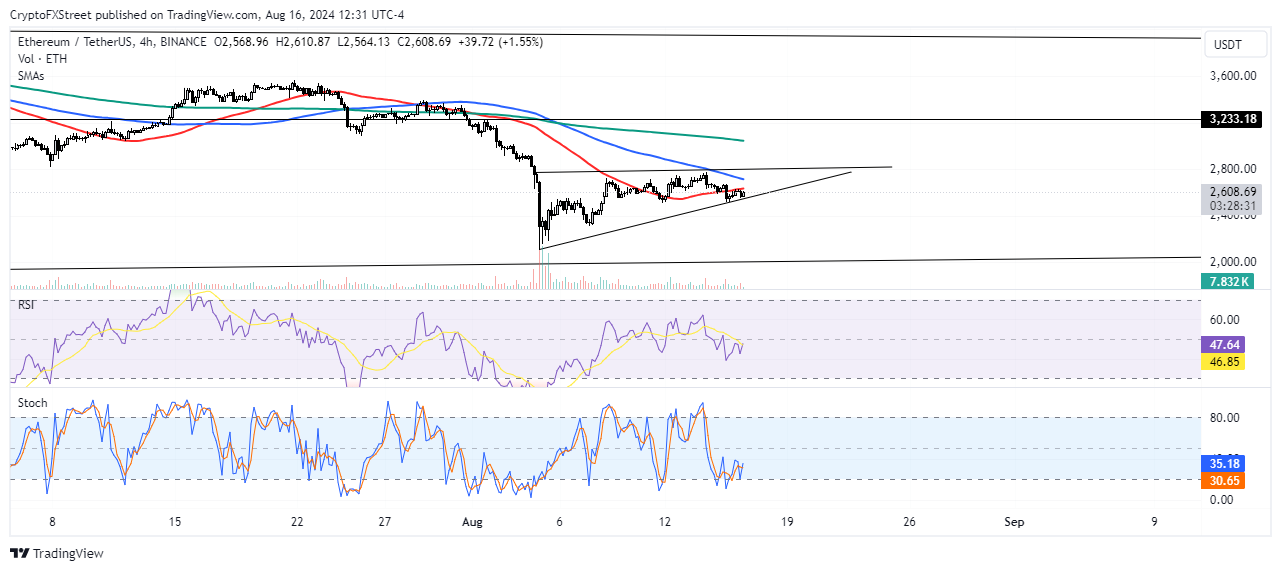
ETH/USDT 4-hour chart
However, a successful move above the horizontal line of the triangle could signal a bullish reversal. Such a move will see ETH rally toward the resistance around $3,230. If ETH breaks above this resistance, it could attempt to tackle the upper trendline of the three-year symmetry triangle.
A daily candlestick close below the lower trendline of the symmetry triangle could trigger a heavy correction for ETH.
Ethereum FAQs
Ethereum is a decentralized open-source blockchain with smart contracts functionality. Serving as the basal network for the Ether (ETH) cryptocurrency, it is the second largest crypto and largest altcoin by market capitalization. The Ethereum network is tailored for scalability, programmability, security, and decentralization, attributes that make it popular among developers.
Ethereum uses decentralized blockchain technology, where developers can build and deploy applications that are independent of the central authority. To make this easier, the network has a programming language in place, which helps users create self-executing smart contracts. A smart contract is basically a code that can be verified and allows inter-user transactions.
Staking is a process where investors grow their portfolios by locking their assets for a specified duration instead of selling them. It is used by most blockchains, especially the ones that employ Proof-of-Stake (PoS) mechanism, with users earning rewards as an incentive for committing their tokens. For most long-term cryptocurrency holders, staking is a strategy to make passive income from your assets, putting them to work in exchange for reward generation.
Ethereum transitioned from a Proof-of-Work (PoW) to a Proof-of-Stake (PoS) mechanism in an event christened “The Merge.” The transformation came as the network wanted to achieve more security, cut down on energy consumption by 99.95%, and execute new scaling solutions with a possible threshold of 100,000 transactions per second. With PoS, there are less entry barriers for miners considering the reduced energy demands.
Recommended Articles


