


Monero Price Forecast: XMR poised for a 13% crash
- Monero is retesting a descending trendline, suggesting a potential decline ahead.
- Traders looking to short XMR might consider entering around the $160 level.
- A daily candlestick close above $169.28 would invalidate the bearish thesis.
Monero (XMR) is retesting a descending trendline and is trading slightly lower by 1% at $156.21 on Friday. Traders looking to short XMR might consider entering around the $160 level, anticipating a potential decline in the upcoming days.
Monero price eyes for a crash after retesting resistance level
Monero price retested the 50% retracement level of the rally from the swing low of $92.04 on Feburary 24 and the swing high of $183.07 on June 10 at $137.55 on Monday, and bounced 8% over the following three days. However, as of Friday, it is trading slightly lower by 1% at $156.21.
If XMR continues to rise, it may encounter resistance near the descending trendline around $160, a level that has previously acted as resistance, presenting a potential shorting opportunity for traders.
If the $160 level holds as resistance, XMR could drop 13% and revisit the mentioned 50% price retracement level at $137.55.
The Relative Strength Index (RSI) and the Awesome Oscillator (AO) on the daily chart are below their neutral levels of 50 and zero, respectively; the momentum indicators strongly suggest bearish dominance.
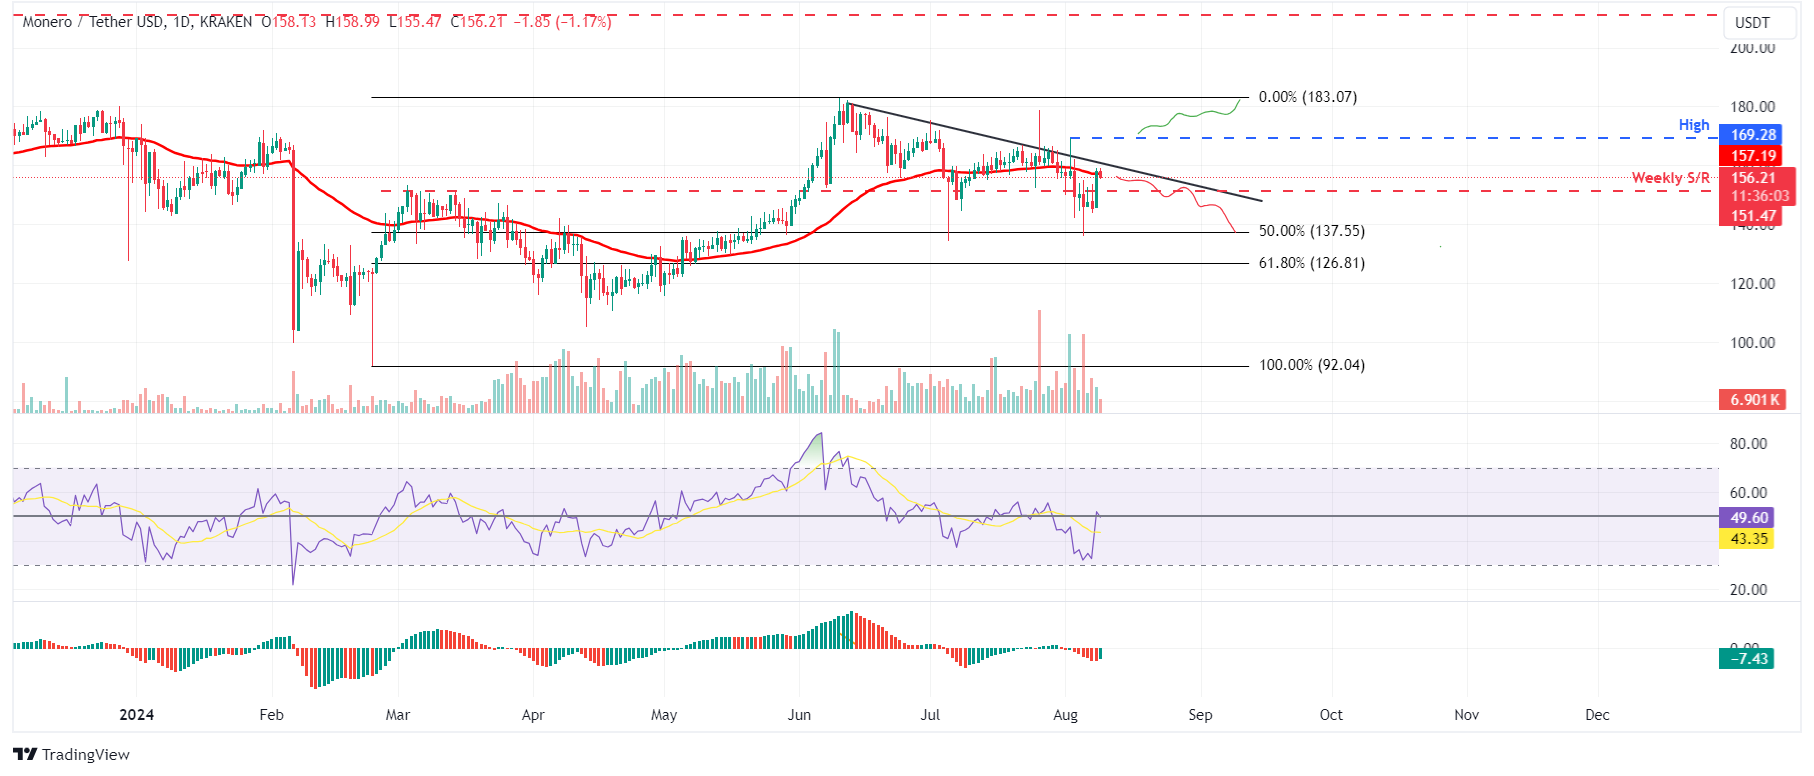
XMR/USDT daily chart
However, if the XMR daily candlestick closes above $169.28, it will produce a higher high in the daily time frame. Such a development would give rise to a bullish market structure. This change in market structure would invalidate the bearish thesis and catalyze an 8% increase in Monero’s price to revisit its June 10 high of $183.07.
Recommended Articles


