


US Consumer Data Sparks Relief Rally in Bitcoin, Gold, and Stocks
Global markets staged a broad rebound on February 6 after a sharp sell-off the previous day pushed stocks, crypto, and commodities into deeply oversold territory. Bitcoin recovered to around $70,000, while US equities, gold, and silver also advanced, driven by technical buying and easing near-term macro fears.
The recovery followed a violent deleveraging phase rather than a shift in fundamentals.
Technical Levels Sparked The Initial Bounce
The rebound began after key technical levels held across asset classes. The S&P 500 touched its 100-day moving average, a level closely watched by systematic and discretionary traders.That triggered mechanical buying from funds rebalancing risk exposure after several sessions of heavy selling.
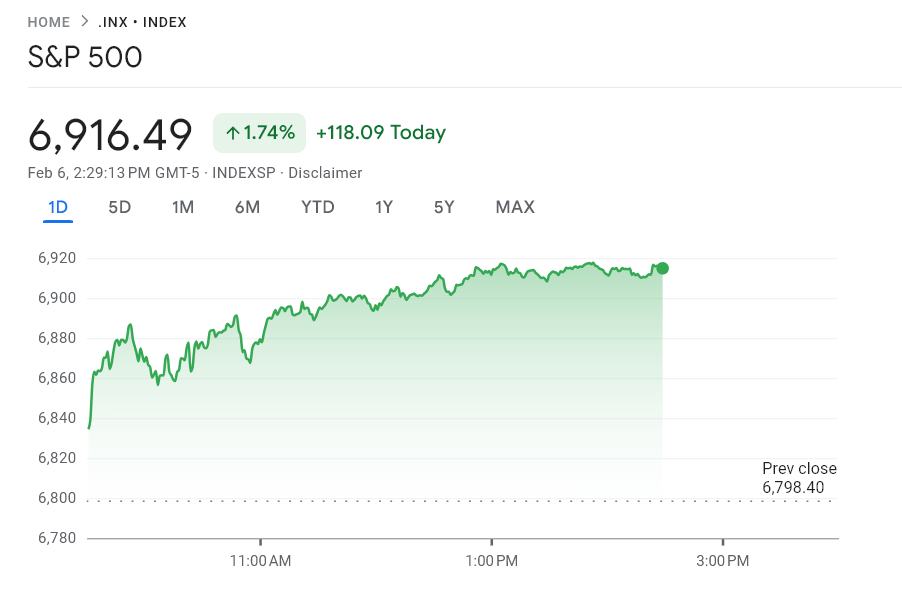 S&P 500 Chart. Source: Google Finance
Bitcoin followed a similar pattern. After briefly falling to $60,000, the asset rebounded sharply as forced liquidations slowed and funding rates stabilized.
The absence of fresh liquidation pressure allowed spot buyers to step in, supporting a short-term recovery.
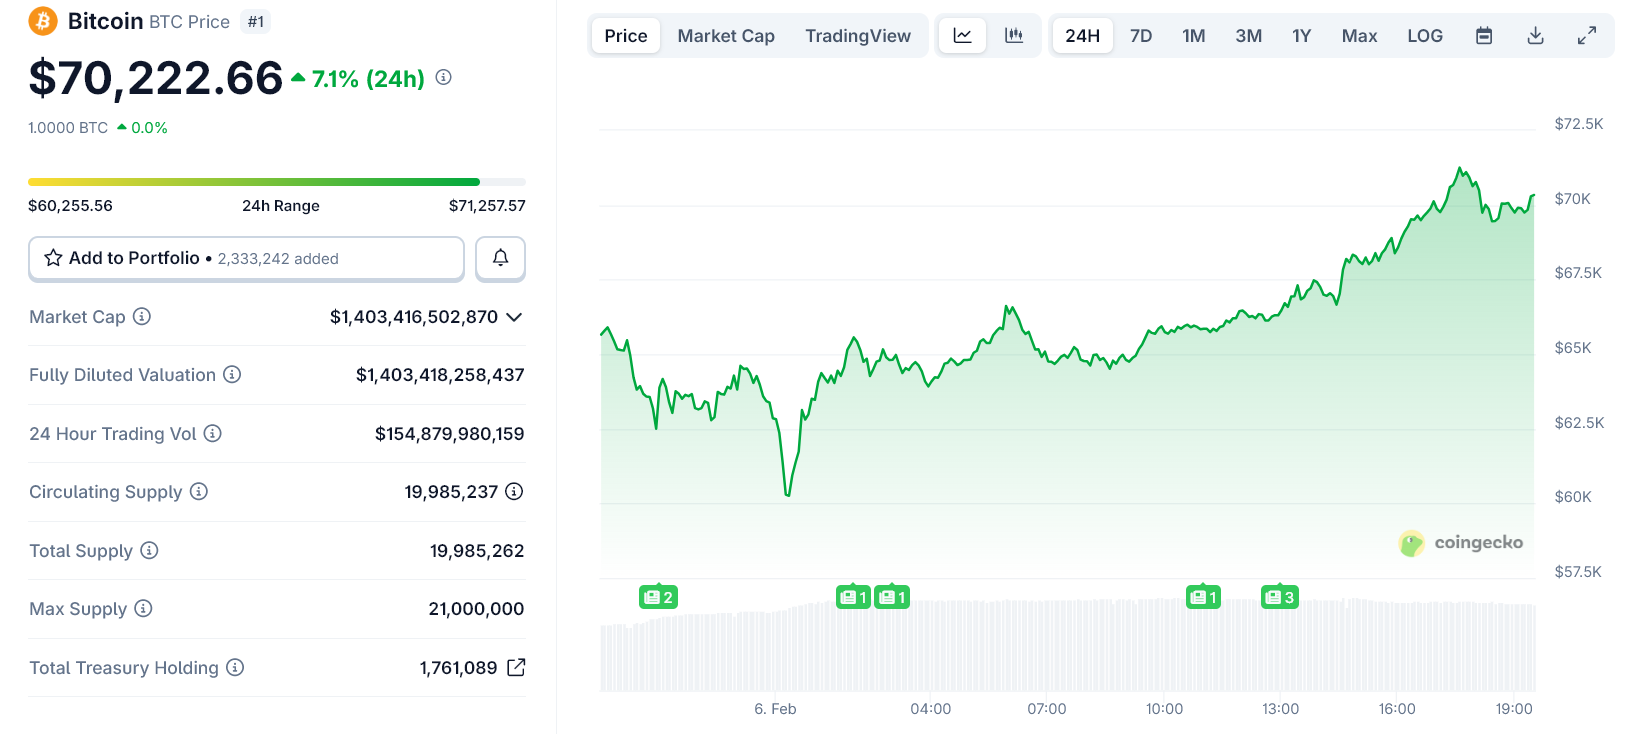 Bitcoin Price Chart. Source: CoinGecko
Positioning Reset Reduced Selling Pressure
The previous sell-off had flushed leverage across markets.
In crypto, derivatives positioning had become heavily skewed toward longs, amplifying downside once prices broke support. By February 6, much of that excess leverage had already been cleared.
As a result, marginal selling pressure eased. With fewer margin calls and reduced forced selling, prices were able to rebound even without new bullish catalysts.
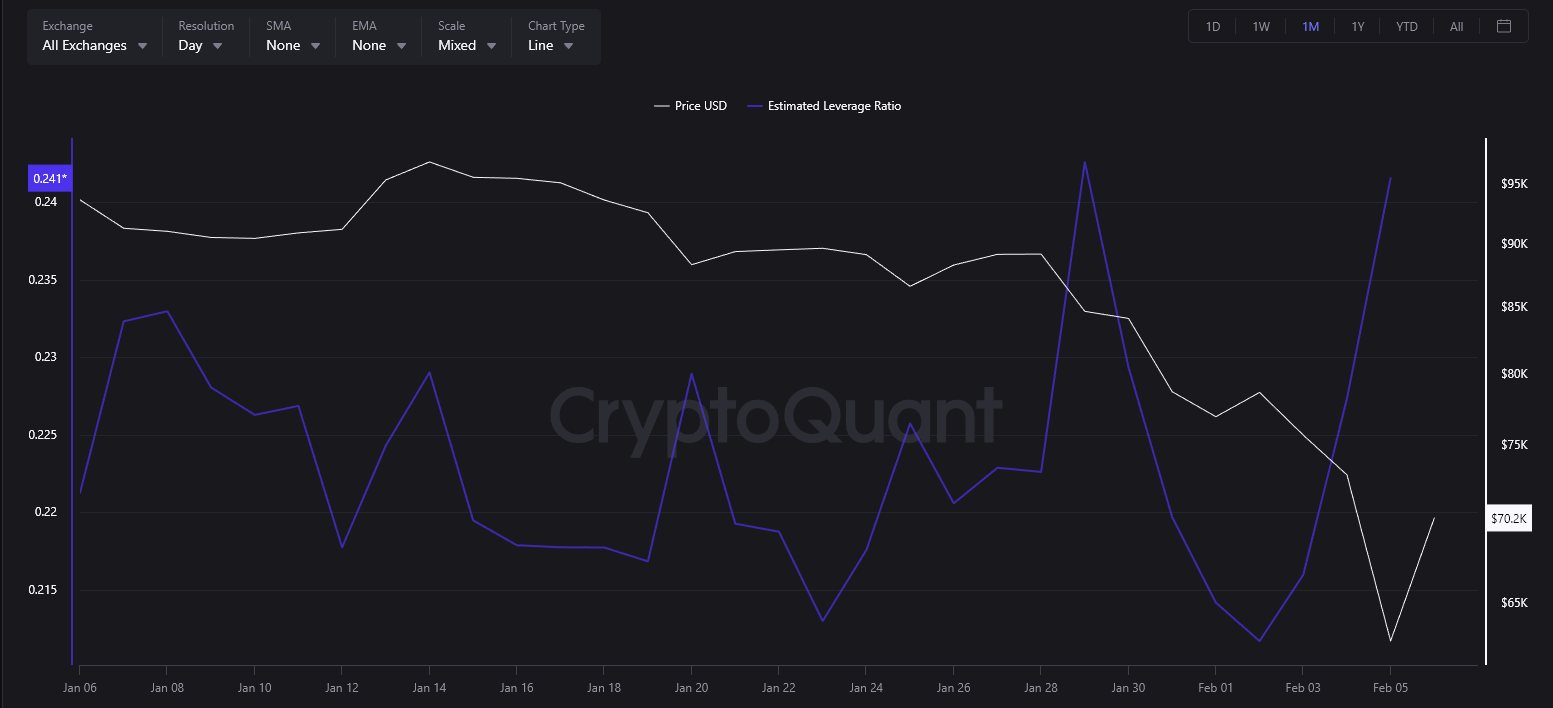 Bitcoin Estimated Leverage Ratio Across All Exchanges. Source: CryptoQuant
The chart shows leverage building through January before being sharply flushed as price broke support in early February.
After that reset, forced selling pressure eased, allowing price to rebound despite the absence of new bullish catalysts.
Macro Signals Eased Near-Term Stress
US macro data also helped stabilize sentiment. Consumer sentiment data released on February 6 came in stronger than expected, marking a six-month high.
While not signaling strong growth, the data reduced immediate fears of a sudden economic deterioration.
Bond markets reacted by pricing a slightly higher probability of a near-term rate cut from the Federal Reserve, pushing short-term yields lower before stabilizing. That shift eased financial conditions at the margin, supporting risk assets.
Gold and silver also recovered sharply, reinforcing the view that the prior session’s decline reflected liquidity stress rather than a fundamental rejection of safe-haven assets.
A softer US dollar and bargain-hunting contributed to the move.
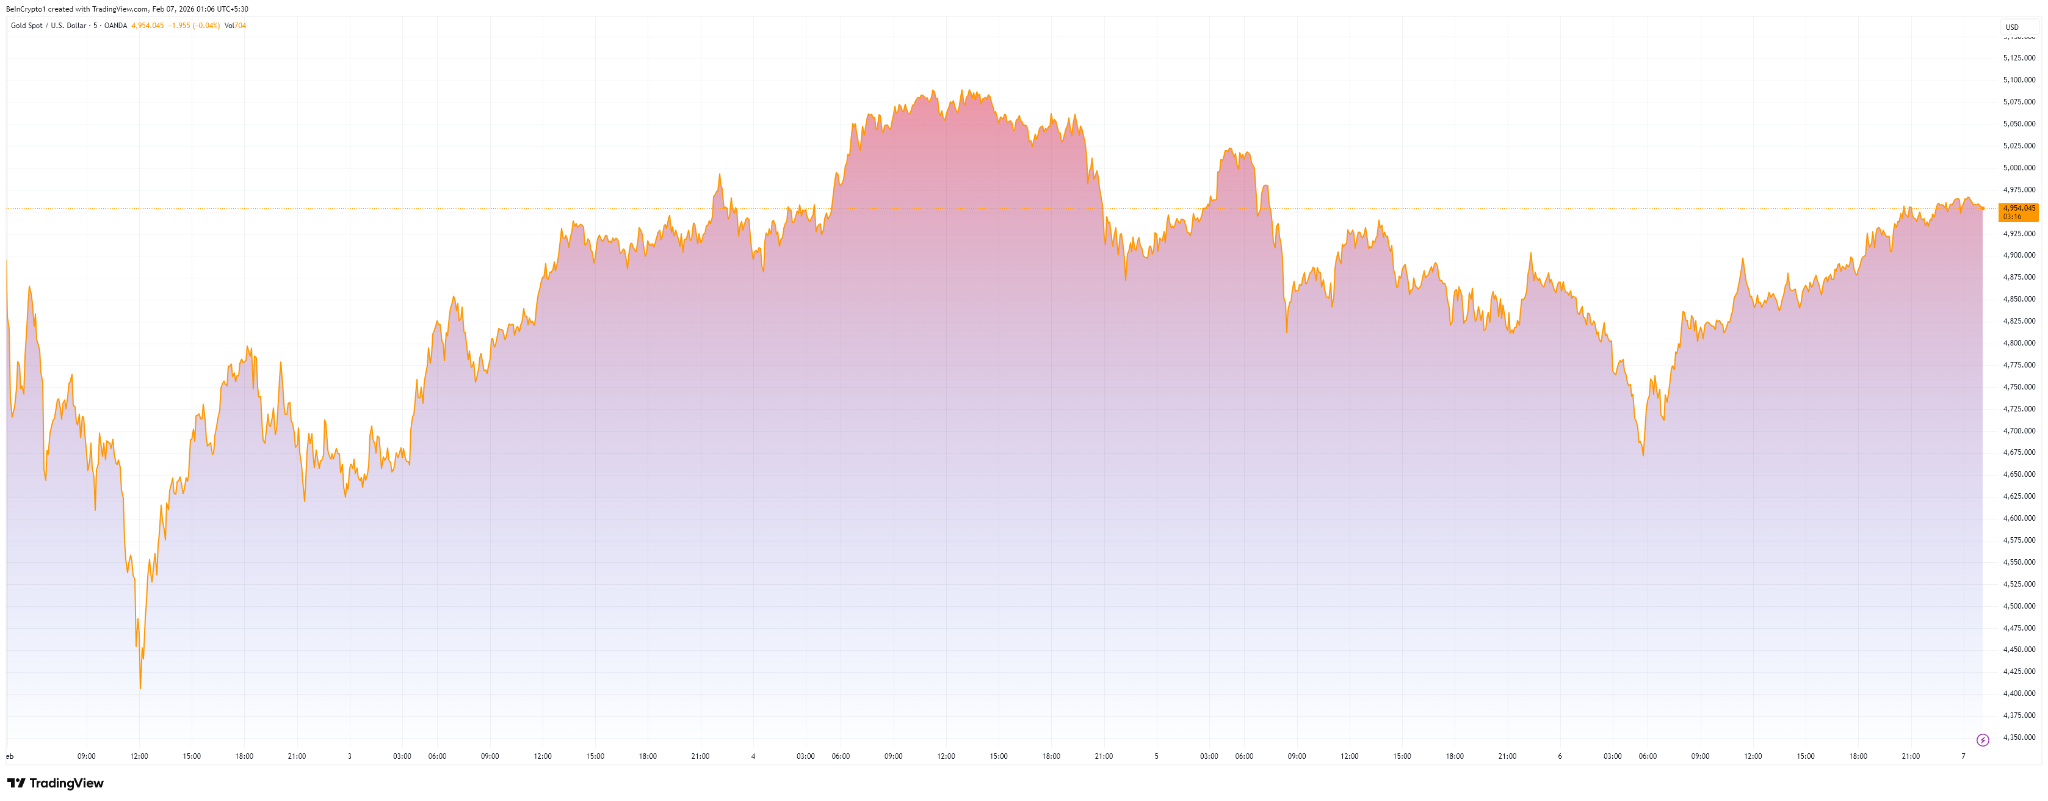 Gold Price Chart Over the Past Week. Source: TradingView
Relief Rally, Not A Trend Reversal
The February 6 rebound reflects a technical relief rally driven by oversold conditions, positioning resets, and short-term macro relief. It does not yet confirm a durable trend reversal.
Markets remain sensitive to liquidity conditions, interest-rate expectations, and capital flows. Volatility is likely to persist as investors reassess risk in a tighter financial environment.
Recommended Articles


