

Cardano Price Forecast: On-chain and derivatives weakness point to further ADA downside

Source Fxstreet
  • Cardano extends its decline, trading below $0.169 on Friday, with losses nearing 4% so far this week.
  • Weakening derivatives metrics and bearish on-chain indicators support the ongoing correction.
  • The deteriorating technical outlook suggests further downside risks for ADA.

Cardano (ADA) extends losses, trading below $0.169 on Friday, with losses nearing 4% so far this week. Moreover, ADA is heading into its sixth consecutive weekly correction, down more than 30% since early October. Weakening derivatives metrics and bearish on-chain indicators point to declining market participation, while the technical outlook suggests further downside risks as sellers maintain control.

Derivatives data shows bearish bias

Derivatives data shows a bearish bias for Cardano. CoinGlass’ long-to-short ratio for ADA reads 0.86 on Monday, nearing the lowest level over a month. A ratio below one indicates bearish sentiment, as traders bet that asset prices will fall.
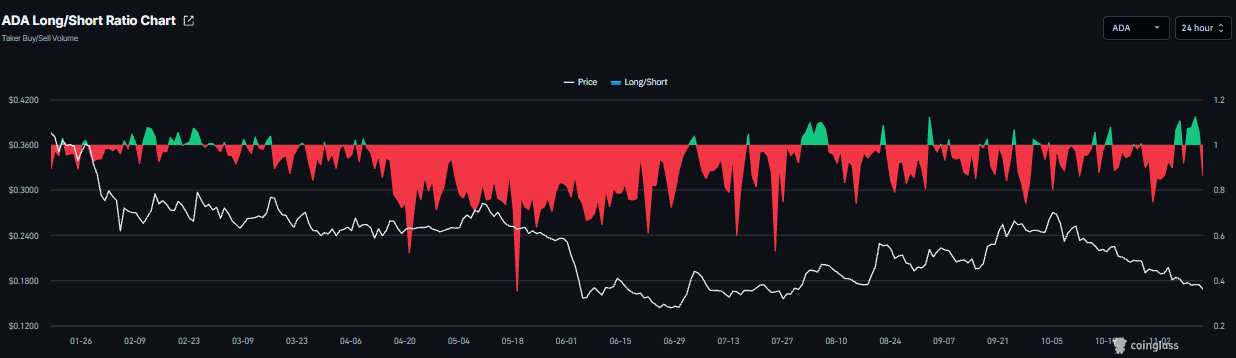
Cardano long-to-short ratio chart. Source: Coinglass

In addition, Cardano’s funding rate flipped negative on Thursday and reads -0.0015% on Friday, indicating shorts are paying longs and suggesting a bearish outlook.
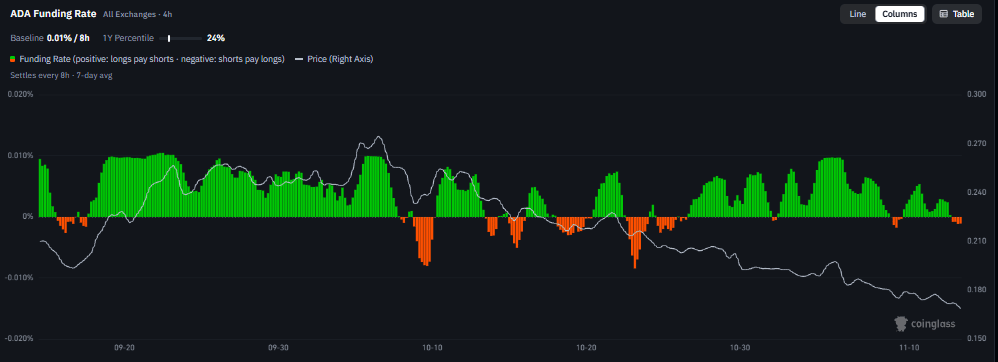
Cardano funding rate chart. Source: Coinglass

On-chain metrics show cautionary signs 

CryptoQuant’s summary data shows a cautious outlook for Cardano. ADA’s spot and futures markets show large whale orders alongside heating conditions. Both markets also show sell-side dominance. These highlight a bearish, cautious sentiment bias among ADA traders.
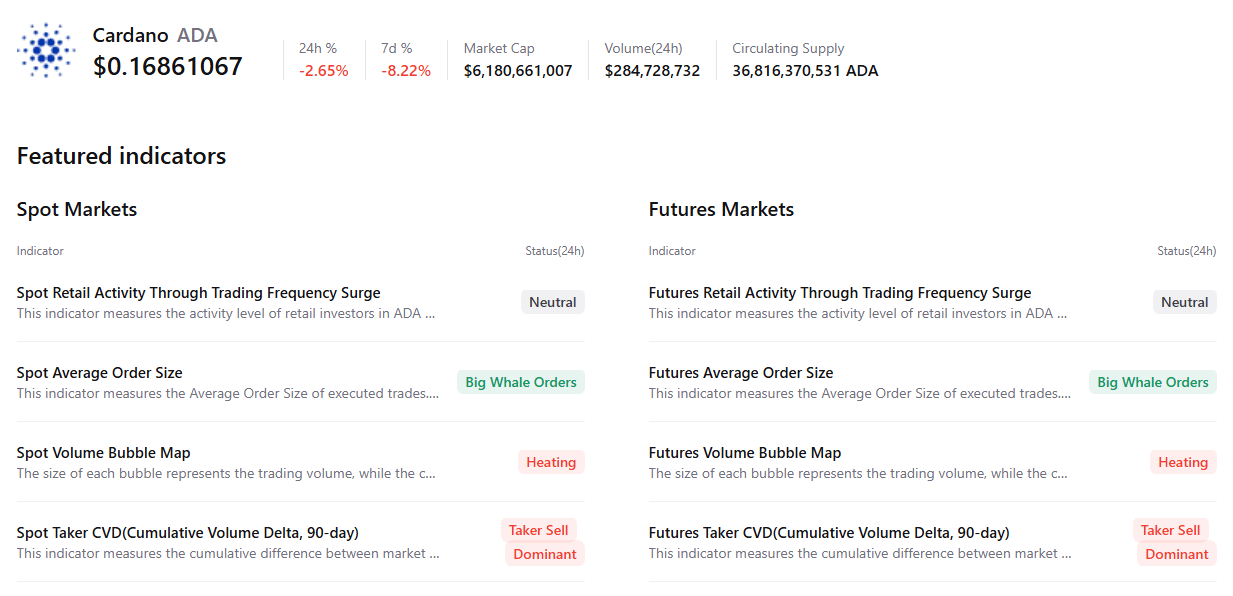
Cardano summary chart. Source: CryptoQuant 

Cardano technical outlook: Bears to push ADA lower

Cardano price trades at $0.168 on Friday, holding a bearish near-term bias as it remains decisively below the 50-day, 100-day and 200-day Exponential Moving Averages (EMAs) at $0.203, $0.208 and $0.229, respectively.

Momentum remains weak, with the Relative Strength Index (RSI) slipping toward oversold territory near 28. Meanwhile, the Moving Average Convergence Divergence (MACD) indicator stays negative with a flat histogram, suggesting persistent downside pressure rather than an imminent reversal.

On the topside, initial resistance appears at the horizontal barrier near $0.183, ahead of a dense EMA cluster between $0.203 and $0.229, while higher resistances are seen at $0.236, $0.245 and $0.296.

On the downside, the next notable support is the horizontal floor at $0.156, and a clear break beneath this level would expose additional selling risk within the prevailing downtrend.
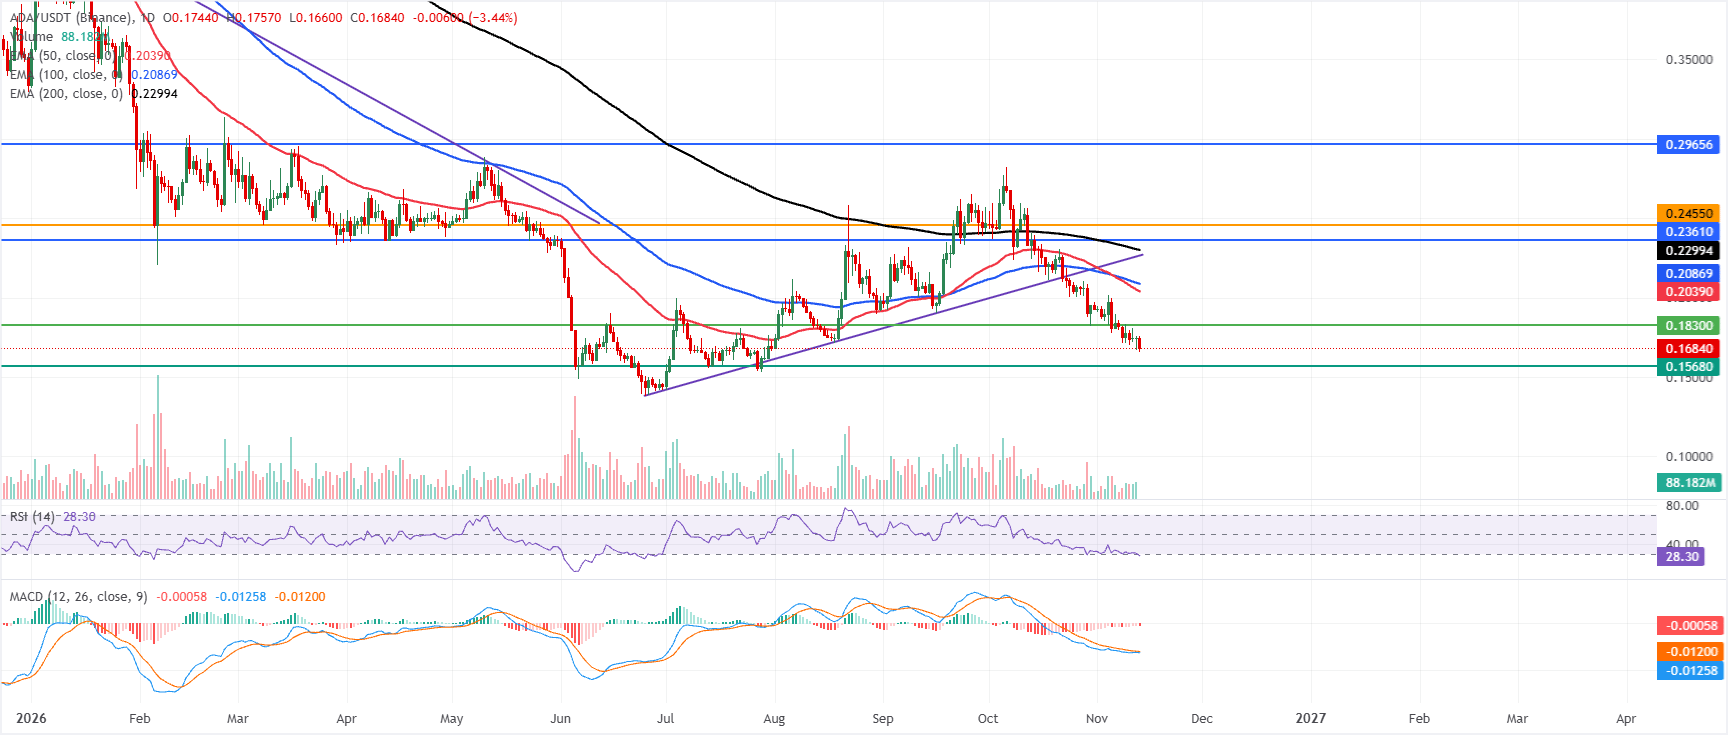
ADA/USDT daily chart

(The technical analysis of this story was written with the help of an AI tool. Know more.)

Disclaimer: For information purposes only. Past performance is not indicative of future results.
placeholder
Ethereum Drops Below $2,000 After Plunging Over 20% in a Month as Odds of $1,500 Retest SurgeEthereum Plunges Over 20% in a Month, Risking a Retest of $1,500 After Losing the $2,000 Defense Line.On November 13, Ethereum (ETH) plunged more than 5%, officially falling below the key
Author  TradingKey
12 hours ago
Ethereum Plunges Over 20% in a Month, Risking a Retest of $1,500 After Losing the $2,000 Defense Line.On November 13, Ethereum (ETH) plunged more than 5%, officially falling below the key
placeholder
Gold Price Forecast: Gold Tumbles Below $3,900 as Trump Says No Need for Iran Deal; Can October PPI Spur a Rebound? As of the Asian session on Friday (November 13), gold prices (XAUUSD) rebounded intraday following Thursday's sharp decline, trading near $3,910. Previously, gold tumbled 2.76% on Thursda
Author  TradingKey
14 hours ago
As of the Asian session on Friday (November 13), gold prices (XAUUSD) rebounded intraday following Thursday's sharp decline, trading near $3,910. Previously, gold tumbled 2.76% on Thursda
placeholder
Brent rose 3.3% and US crude stocks built 4.66 million barrels in the same weekBrent January settled at 95.82, up 3.3%, and WTI at 88.74, up 2.55%, after the US signalled it would not pursue a deal with Iran and attacks on Gulf shipping continued. In the same week, EIA data showed US crude inventories rising 4.657 million barrels against expectations of a 1.1 million draw, with gasoline up another 1.799 million. OPEC output also rebounded 1.96 million barrels a day to 27.16 million in October, led by Saudi Arabia at 10.56 million. This piece separates the geopolitical premium from the physical balance and lays out where each side of the trade is anchored.
Author  Irene Q.
18 hours ago
Brent January settled at 95.82, up 3.3%, and WTI at 88.74, up 2.55%, after the US signalled it would not pursue a deal with Iran and attacks on Gulf shipping continued. In the same week, EIA data showed US crude inventories rising 4.657 million barrels against expectations of a 1.1 million draw, with gasoline up another 1.799 million. OPEC output also rebounded 1.96 million barrels a day to 27.16 million in October, led by Saudi Arabia at 10.56 million. This piece separates the geopolitical premium from the physical balance and lays out where each side of the trade is anchored.
placeholder
Gold hit a one-year low while central banks bought 321 tonnes — the sellers were never the ones you thinkSpot gold closed at 3,876 on Thursday, down 2.8% and its lowest close in more than a year, with an intraday low near 3,852. The dollar is at a 19-month high of 103.21 and the 10-year yield is at 5.10%, so the price move is easy to explain. What is harder to explain is who sold: central banks bought 321 tonnes in Q3, the PBoC added for a 24th straight month, ETF holdings are near a record 4,256 tonnes, and roughly 95% of the futures selling came from non-reportable and sovereign-type accounts rather than hedge funds. This piece separates the two books that have to balance.
Author  Irene Q.
18 hours ago
Spot gold closed at 3,876 on Thursday, down 2.8% and its lowest close in more than a year, with an intraday low near 3,852. The dollar is at a 19-month high of 103.21 and the 10-year yield is at 5.10%, so the price move is easy to explain. What is harder to explain is who sold: central banks bought 321 tonnes in Q3, the PBoC added for a 24th straight month, ETF holdings are near a record 4,256 tonnes, and roughly 95% of the futures selling came from non-reportable and sovereign-type accounts rather than hedge funds. This piece separates the two books that have to balance.
placeholder
Today’s Market Recap: Nvidia Drops Over 4% After Jensen Huang Resigns, AMD and Broadcom Both Rise Over 5% On November 12, the three major U.S. stock indices closed slightly lower. Nvidia announced that Jensen Huang had stepped down immediately as CEO and director, draggi
Author  TradingKey
19 hours ago
On November 12, the three major U.S. stock indices closed slightly lower. Nvidia announced that Jensen Huang had stepped down immediately as CEO and director, draggi
Related Instrument
goTop
quote