


Ethereum Price Forecast: ETH drops near $2,200 after Binance hack
Ethereum price today: $2,230
- Ethereum declines near $2,200 on Friday, triggering over $350 million in liquidations as derivatives flip bearish.
- The top altcoin is under pressure from risk-off sentiment following a $6.3 billion Binance hack and selloffs in tech stocks.
- ETH eyes support at $2,204 after falling below the $2,256 horizontal level.
Ethereum (ETH) drops toward $2,200 on Friday as the crypto market remains weighed down by the Binance hack and tech selloffs.
Binance hack and tech selloffs fuel ETH selling
The top altcoin has seen intense selling pressure across spot and futures venues over the past day, pulling its price from $2,330 to $2,177 before recovering above $2,200. The move triggered Ethereum futures liquidations worth $350 million in the past 24 hours, driven by over $311 million in long liquidations, per Coinglass data.
Heavy liquidations pushed funding rates to -0.0105, the lowest level since early June. The flip to negative territory indicates short positions have gained dominance in ETH perpetual futures.
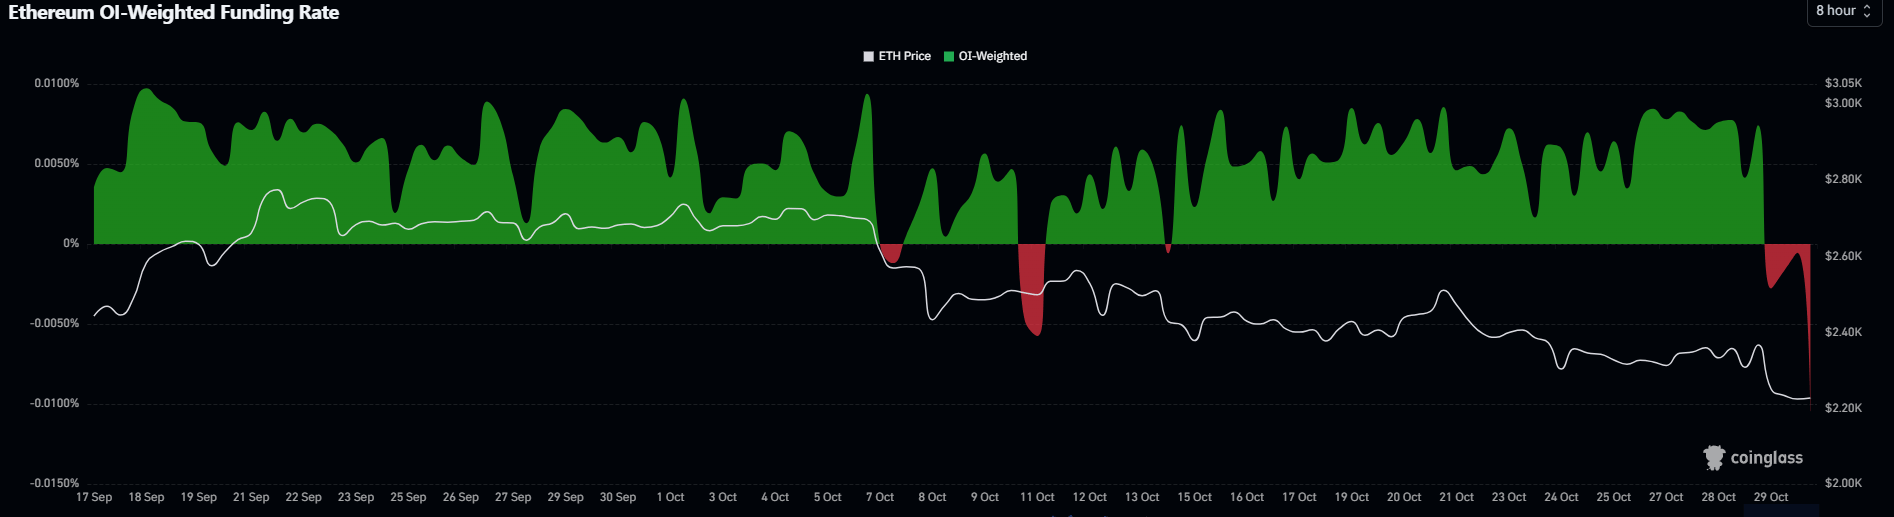
Funding rates are periodic payments between long and short traders in perpetual futures markets to keep a contract's price anchored to its underlying spot counterpart.
Ethereum's open interest, the total worth of outstanding contracts in a derivatives market, declined by 410,000 ETH to 12.61 million ETH.
On the spot side, US spot ETH exchange-traded funds (ETFs) continued their weakness, posting $105.48 million in net outflows on Thursday. The products are on track for their worst month on record, with outflows worth $1.45 billion so far in October, surpassing the $1.42 billion withdrawals in November 2025.
The risk-off sentiment follows Thursday's $6.3 billion hack on crypto exchange Binance. Partners froze $3 billion of the stolen funds while Binance paused withdrawals.
The exchange said it will cover the stolen assets with its own funds and may resume withdrawals in 48 hours.
Aside from the hack, selloffs in tech stocks are also weighing on the crypto market, which has shown a rising positive correlation with the tech-heavy Nasdaq in the past few months. The index dropped 3.3% on Friday alongside a 2.1% decline in the S&P 500 at the time of writing.
Risk assets remain pressured as rising inflation and expectations of a Federal Reserve (Fed) rate hike in December keep investors on edge.
Ethereum technical outlook: ETH eyes $2,204 support after decline below $2,256
On the daily chart, ETH is keeping a bearish near-term tone as it remains capped beneath all key Exponential Moving Averages (EMAs). Momentum reinforces the downside bias, with the 14-day Relative Strength Index (RSI) slipping into oversold territory near 29 and the Stochastic Oscillator hovering around 17, suggesting that while selling pressure dominates, the top altcoin could be approaching a short-term exhaustion phase rather than a clear reversal.
On the topside, initial resistance emerges at the horizontal barrier near $2,257, followed by $2,355 and then the EMA cluster starting at the 100-day EMA around $2,351 and extending toward the 50-day EMA near $2,435. Above these, higher hurdles are seen at $2,549, $2,637 and $2,782.
On the downside, immediate support is located at $2,205, ahead of a secondary floor at $2,107, with deeper levels at $1,972 and $1,828 likely to attract buyers if the current slide extends.
(The technical analysis of this story was written with the help of an AI tool. Know more.)
Recommended Articles


