

Crypto liquidations surpass $1.50 billion as Binance freezes $3 billion after hack

Source Fxstreet
  • Suspected hack of Binance wallets across the Bitcoin, Ethereum, and Tron networks triggers nearly $6 billion in outflows.
  • CoinGlass data shows over $1.50 billion wiped out in the last 24 hours as broader market sentiment turns bearish.
  • Bitcoin slips below $77,000 on Friday, extending Thursday’s 4% decline and heading toward a bearish October close with about 8% losses.

The broader cryptocurrency market is trading in the red on Friday, following news that the Binance wallets were hacked, resulting in the potential theft of $1.45 billion in Bitcoin (BTC) and $875 million in Ethereum (ETH), which could become the biggest crypto hack in history. The derivatives market witnessed over $1.50 billion in total liquidations over the last 24 hours, with Bitcoin slipping below $77,000.

Binance at risk of largest crypto hack ever

Changpeng Zhao, former CEO of Binance, was among the first to report a potential hack of Binance's hot wallet. The suspected hack affects wallets across the Bitcoin, Ethereum, and Tron (TRX) networks, putting $1.45 billion in BTC, $875 million in ETH, and other crypto assets at risk.

Binance, in a recent X post, announced the freezing of $3 billion in crypto assets, with the help of leading US Dollar-pegged stablecoin issuers, Tether and Circle. Paolo Ardoino, CEO of Tether, and Jeremy Allaire, Co-founder of Circle, revealed in separate X posts that they froze $1.567 billion in USDT and $800 million in USDC. 

Binance continues to reaffirm in each of its social media updates that the user funds are safe, and the internal teams continue to work closely with law enforcement, issuers, blockchain intelligence firms, and industry partners to trace and freeze additional assets. 

Bitcoin slips below $77,000, fueling crypto liquidations over $1.50 billion

The news of Binance, the largest crypto Centralized Exchange (CEX) by trading volume, being hacked for over $3 billion spread like wildfire among investors. Panic selling has pushed Bitcoin's price below $77,000 on Friday, extending the previous day's 4% decline.

In addition, the sell-off wiped out more than $1.50 billion in leveraged positions in the market. CoinGlass data shows total liquidations of $1.51 billion over the last 24 hours, led by $1.30 billion in long liquidations, reaffirming the near-term panic selling.
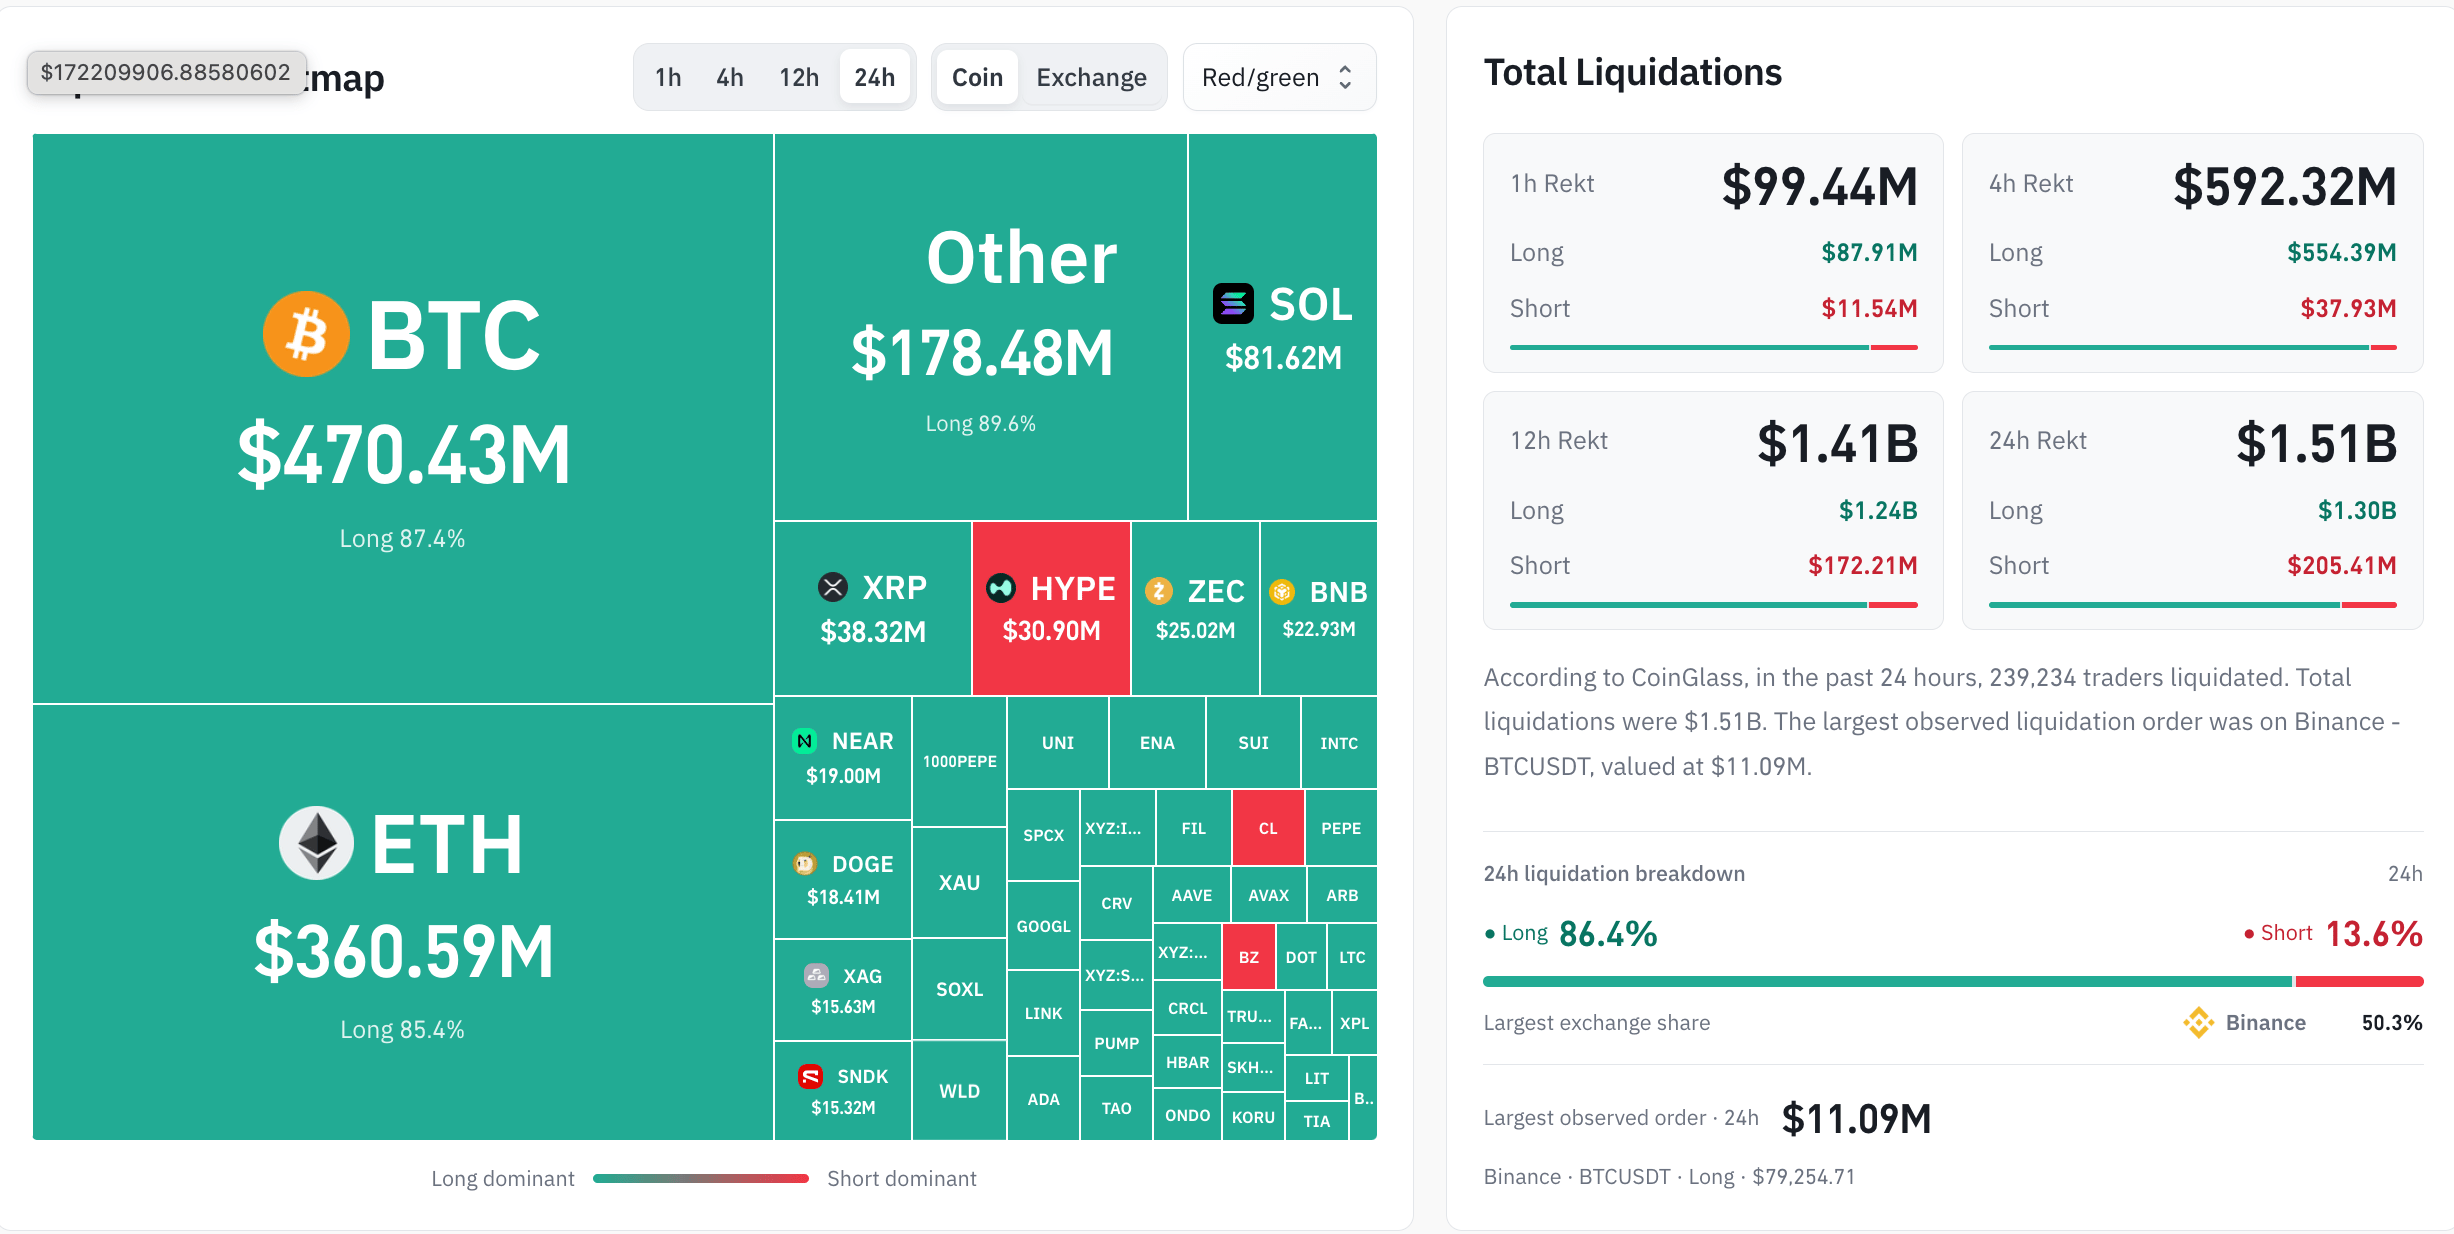
Crypto liquidation data. Source: CoinGlass

Technical outlook: Can Bitcoin extend its correction below $75,000?

Bitcoin trades around $76,676 at press time on Friday, retaining a bearish near-term bias below the 50-day Exponential Moving Average (EMA) at $80,556 while holding just above the 200-day EMA at $76,457. This configuration suggests the broader uptrend remains technically intact but under pressure, with price caught between long-term support and nearby overhead supply.

The Relative Strength Index (RSI) at 32 hovers near oversold territory, hinting at exhausted selling, yet the Moving Average Convergence Divergence (MACD) remains deeply negative, reinforcing the notion that downside risks persist.

Looking down, immediate support is seen at the 200-day EMA near $76,457, followed by the horizontal floor at $75,545. A daily close below this cluster would expose deeper levels at $70,000 as the next bearish target.

Chart Analysis BTC/USDT (Binance)
BTC/USDT daily price chart.

On the topside, initial resistance is provided by the 50-day EMA at $80,556, ahead of the horizontal barrier at $81,272, while a stronger recovery would need to clear $87,395 to ease the current bearish tone and reopen the path toward the recent highs.

(The technical analysis of this story was written with the help of an AI tool. Know more.)

Disclaimer: For information purposes only. Past performance is not indicative of future results.
placeholder
Anthropic files for a $2 trillion IPO — the $80.7 billion loss is the decoy, the $450 billion compute bill is the riskAnthropic publicly filed its S-1 on October 26, revealing $16.29 billion of first-half revenue (+1,304% year over year) and a $80.7 billion net loss — of which $72.4 billion is a non-cash convertible-note charge. The real number is the $450 billion of signed, mostly non-cancelable compute commitments. Here is what the filing says, why NVDA, ARM and MU are the tradeable read-through, and the conditions that decide whether the AI trade passes its first public valuation test.
Author  Irene Q.
Oct 27, Tue
Anthropic publicly filed its S-1 on October 26, revealing $16.29 billion of first-half revenue (+1,304% year over year) and a $80.7 billion net loss — of which $72.4 billion is a non-cash convertible-note charge. The real number is the $450 billion of signed, mostly non-cancelable compute commitments. Here is what the filing says, why NVDA, ARM and MU are the tradeable read-through, and the conditions that decide whether the AI trade passes its first public valuation test.
placeholder
Brent's $115 front month sits $4.6 above January — the $14 spread to WTI is the supply-risk premiumDecember Brent trades at $115.29 while January is $110.71, a $4.58 backwardation. The December Brent-WTI spread is $14.2, versus a $3-5 normal. That gap, not the headline, is where the Middle East supply risk is priced. Here is what the curve says, why the December contract's expiry on October 30 will mechanically cut the headline by $4.6, and the 108.81 neckline that decides the next move.
Author  Irene Q.
Oct 28, Wed
December Brent trades at $115.29 while January is $110.71, a $4.58 backwardation. The December Brent-WTI spread is $14.2, versus a $3-5 normal. That gap, not the headline, is where the Middle East supply risk is priced. Here is what the curve says, why the December contract's expiry on October 30 will mechanically cut the headline by $4.6, and the 108.81 neckline that decides the next move.
placeholder
Gold Price Analysis Today | Forex Gold Analysis | XAU/USD Analysis - October 29, 2026Get the latest gold price analysis, forex gold insights, and XAU/USD analysis for October 29, 2026. Read on for the details.
Author  Mitrade
Yesterday 02: 06
Get the latest gold price analysis, forex gold insights, and XAU/USD analysis for October 29, 2026. Read on for the details.
placeholder
The Fed held at 3.75%–4.00% — and two officials voted to hike. December is now 85% pricedThe FOMC held by a 10–2 vote, with Governor Cook and Cleveland Fed President Hammack dissenting for a 25bp hike. Chair Warsh offered no forward guidance and no dot plot, the 2-year yield fell 8bp to 4.70%, and the dollar slipped to 101.84 even as markets moved December hike odds to 85%–87%. Tonight's Q3 GDP and September core PCE are the next referee.
Author  Irene Q.
Yesterday 02: 55
The FOMC held by a 10–2 vote, with Governor Cook and Cleveland Fed President Hammack dissenting for a 25bp hike. Chair Warsh offered no forward guidance and no dot plot, the 2-year yield fell 8bp to 4.70%, and the dollar slipped to 101.84 even as markets moved December hike odds to 85%–87%. Tonight's Q3 GDP and September core PCE are the next referee.
placeholder
Gold Price Analysis Today | Forex Gold Analysis | XAU/USD Analysis - October 30, 2026Get the latest gold price analysis, forex gold insights, and XAU/USD analysis for October 30, 2026. Read on for the details.
Author  Mitrade
7 hours ago
Get the latest gold price analysis, forex gold insights, and XAU/USD analysis for October 30, 2026. Read on for the details.
Related Instrument
goTop
quote