

Cardano Price Forecast: ADA risks 15% downside as retail demand, bullish momentum wane

Source Fxstreet
  • Cardano holds steady around $0.2200 on Monday after facing a 12% decline last week.
  • Derivatives data shows declining Open Interest and a fluctuating funding rate, implying weak retail demand.
  • The technical outlook for ADA is bearish, pointing to nearly 15% downside potential toward the $0.1894 support level.

Cardano (ADA) is trading above $0.2200 at press time on Monday, holding steady after a 12% decline the previous week. The altcoin is losing retail interest as the notional value of active ADA futures positions declines. The technical outlook for ADA suggests a downside bias following the bearish breakout below a near-term support trendline last week.

Is Cardano losing retail support?

Cardano maintains a corrective tone, with a decline of over 10% so far in October, capping retail speculation. CoinGlass data shows the ADA futures Open Interest (OI) is declining, down to $475.58 million on Monday, from $549.14 million last week. This indicates a significantly reduced notional value of active contracts, linked to a declining spot price or positional wipeout.

At the same time, the funding rate stands at 0.0032%, reflecting a bullish bias among traders, anticipating a rebound, although the downside risk persists and increases the risk of a long squeeze.
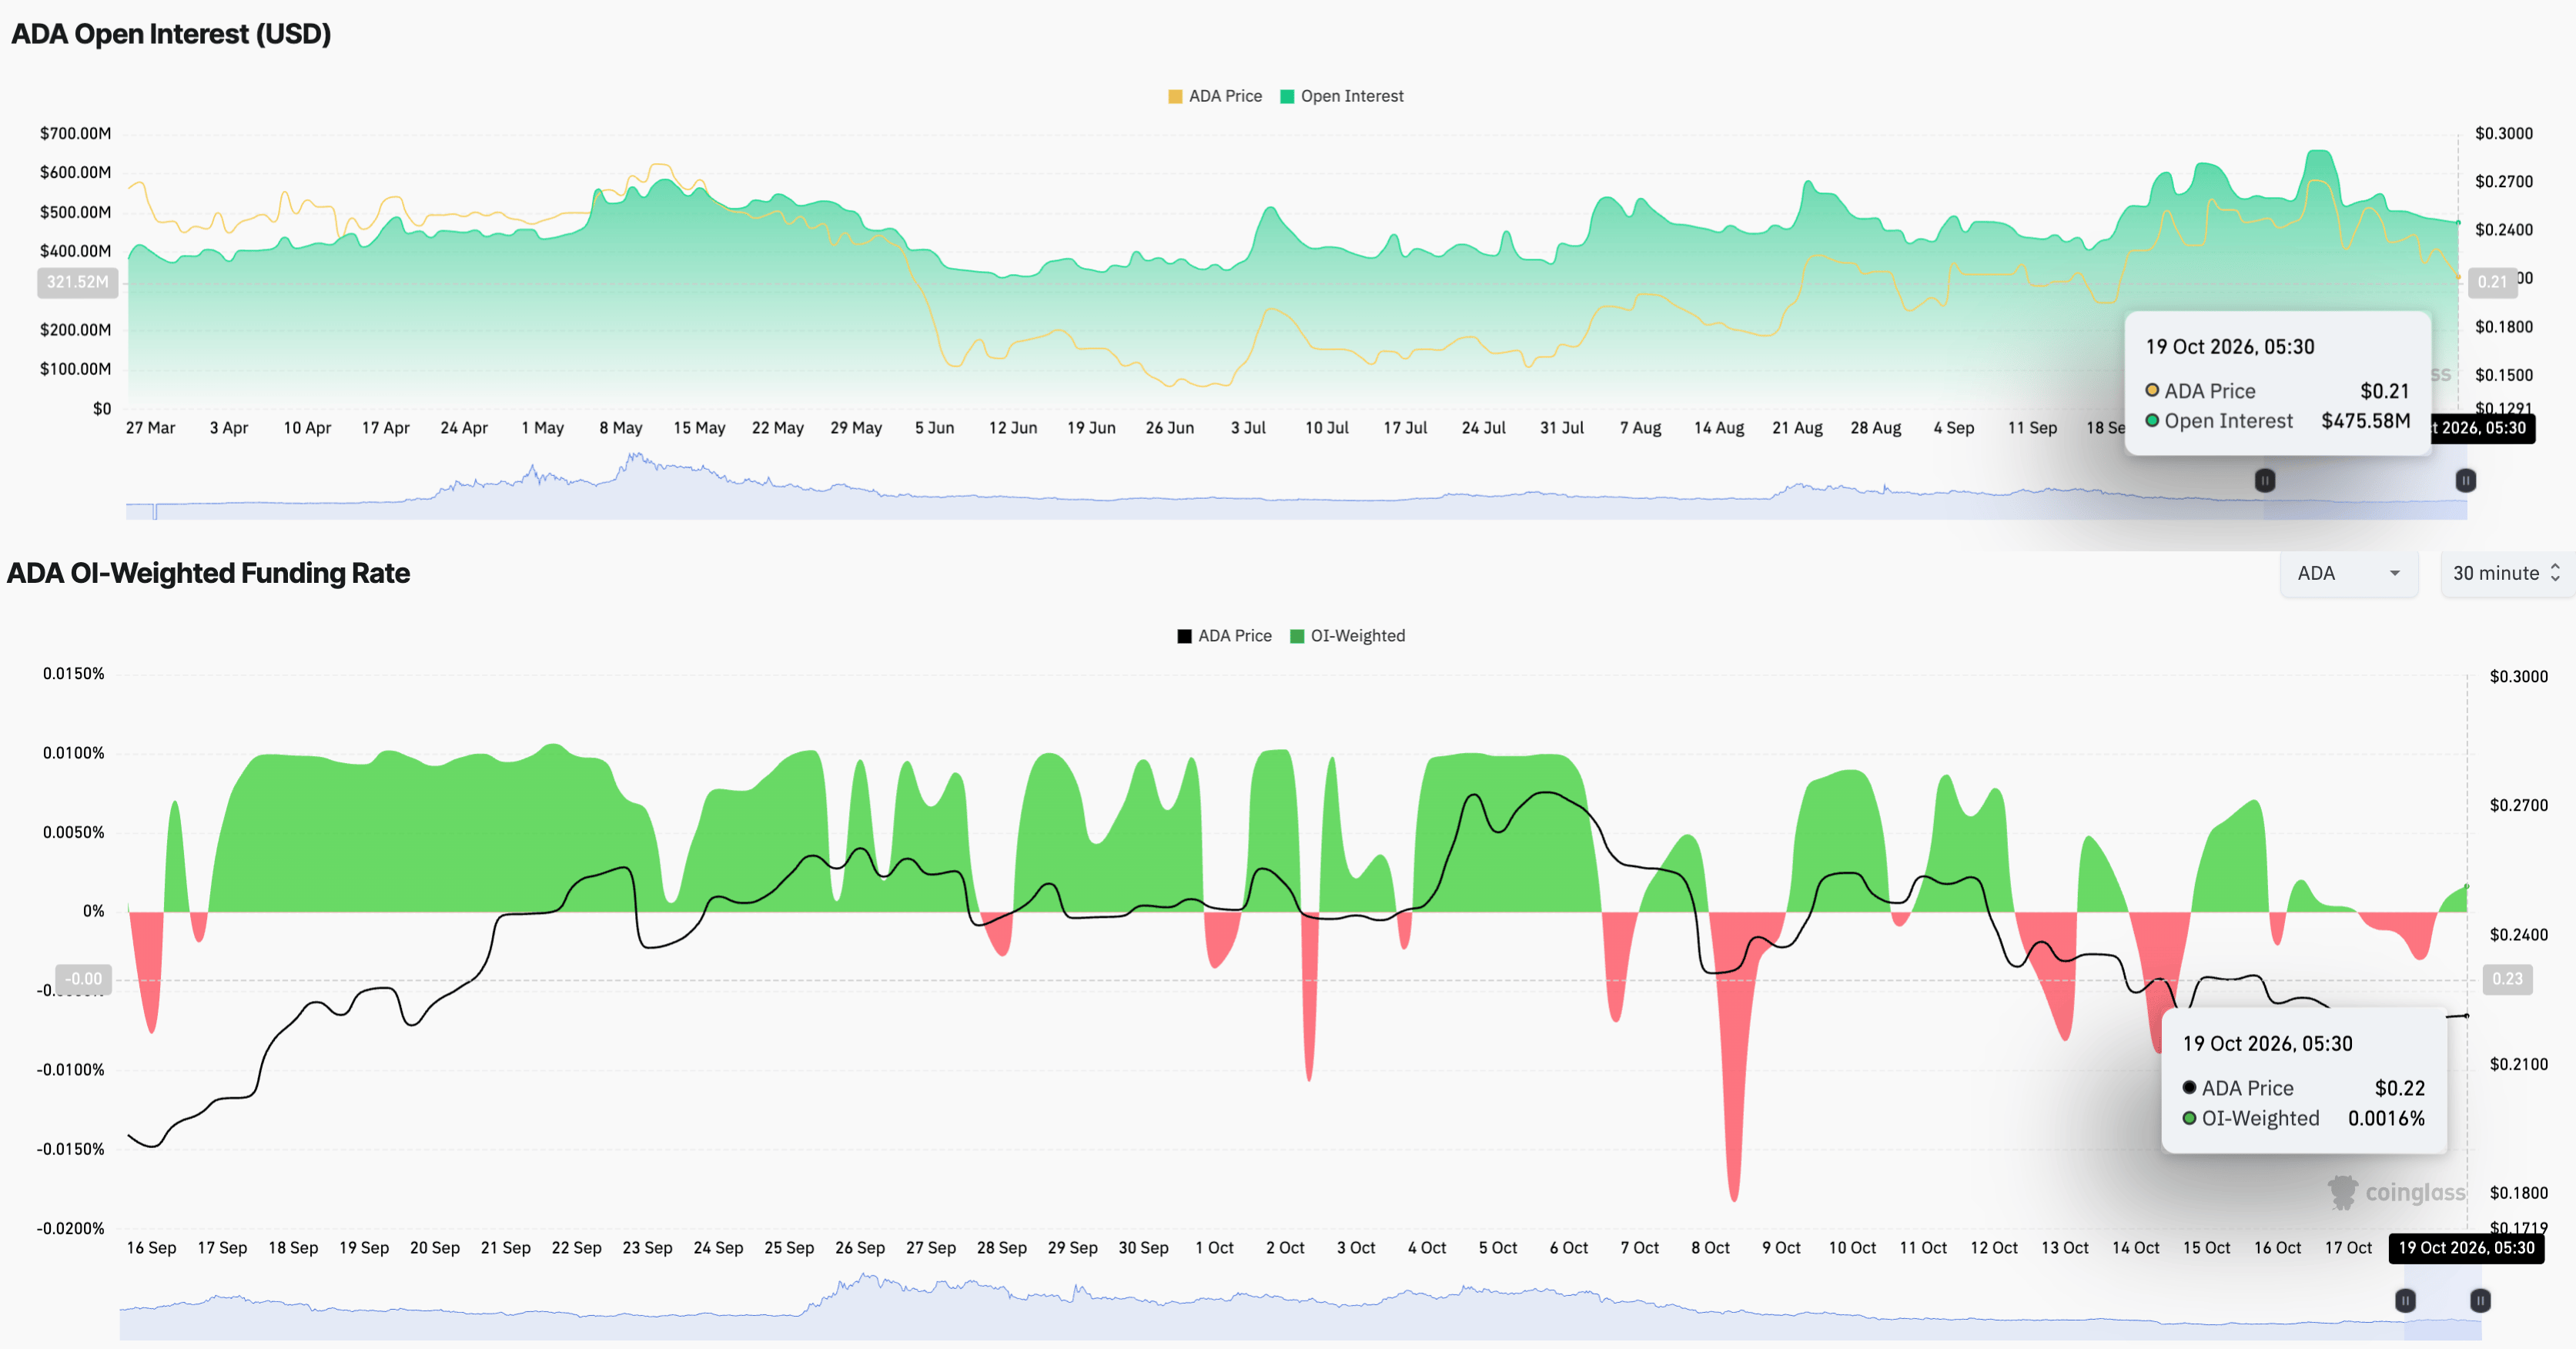
ADA derivatives data. Source: CoinGlass

On the other hand, Cardano’s large-wallet investors, commonly referred to as whales, remain muted. Santiment data shows investors holding over 100 million ADA tokens account for 15.99% of the circulating supply, marginally up from 15.95% last week, while the cohorts holding 10 million to 100 million tokens have stabilized at 38.11%, down from 38.27% in the same period.
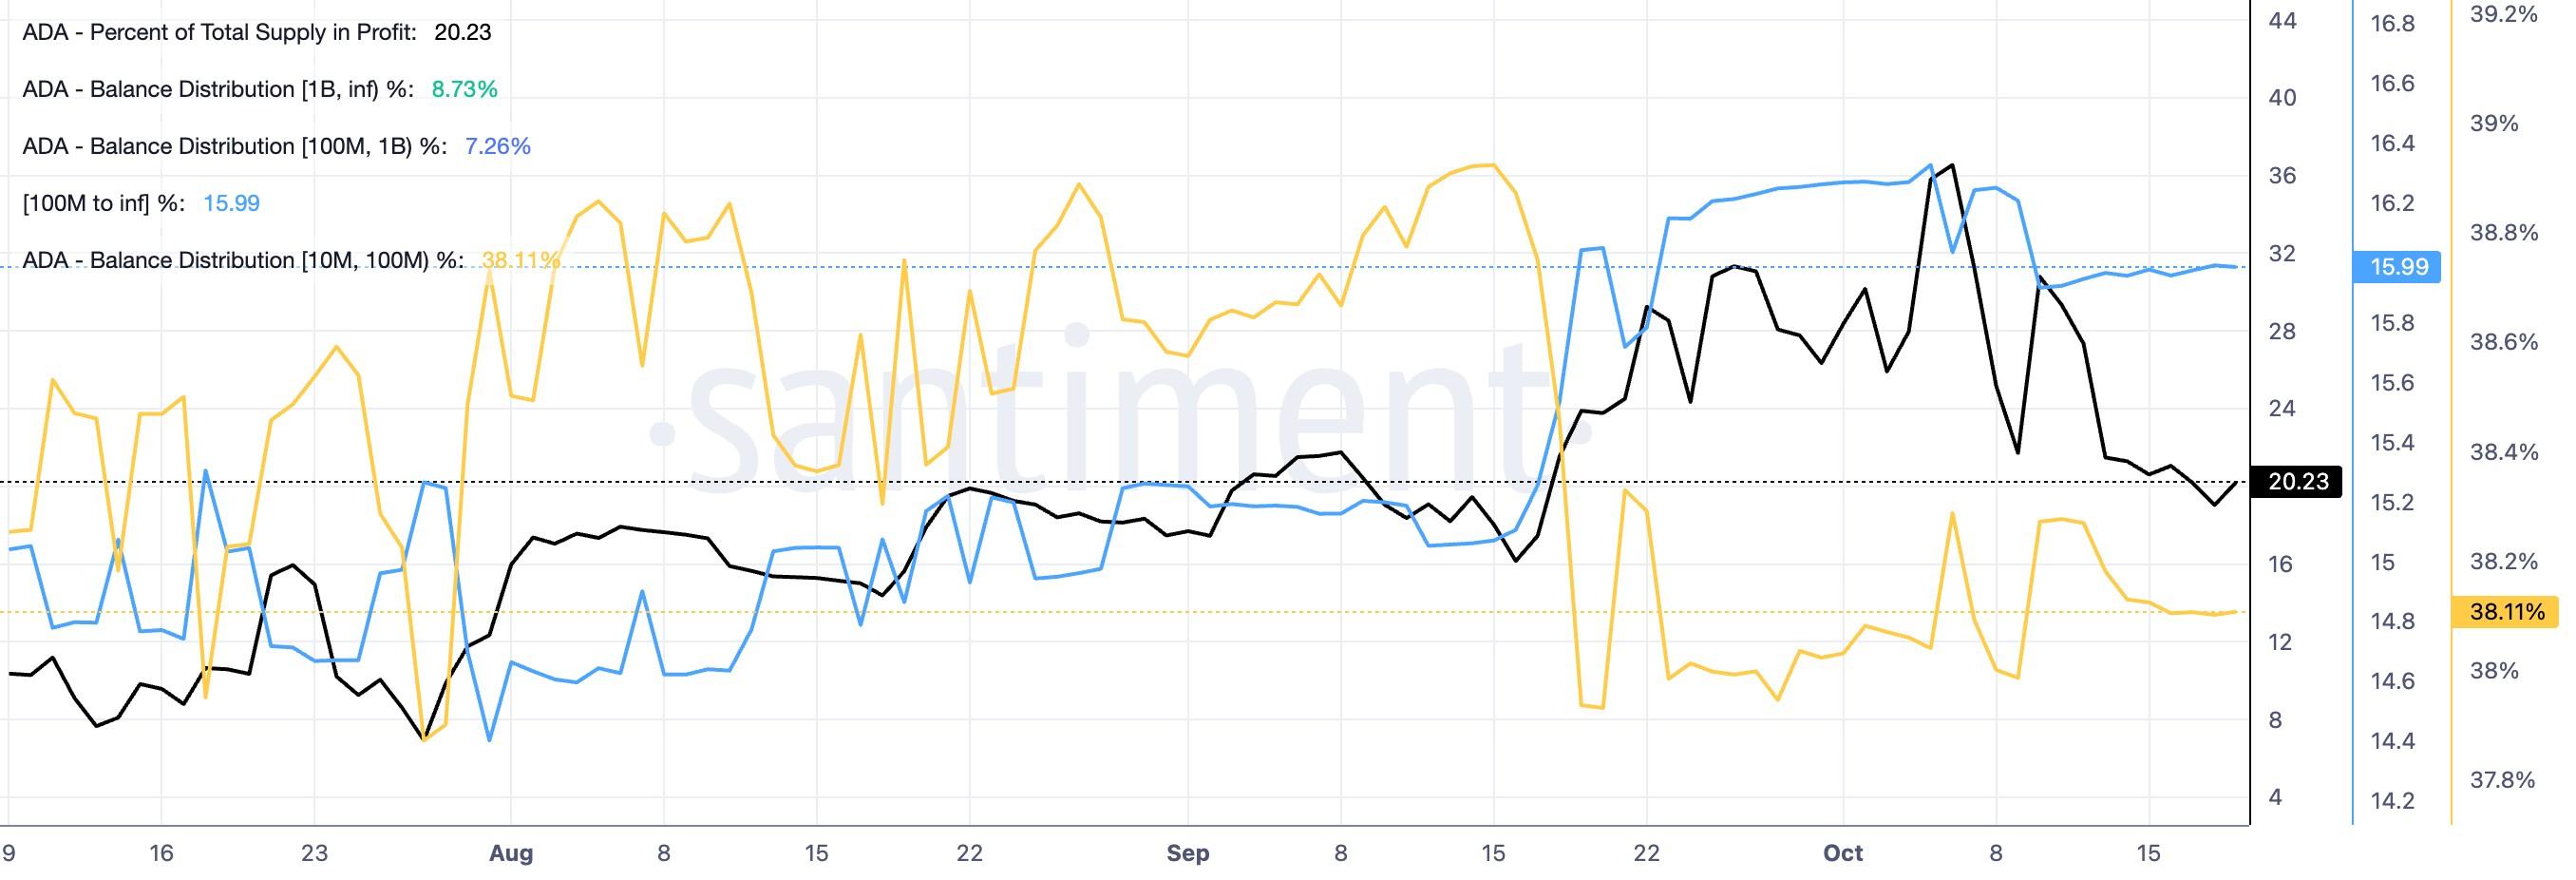
ADA on-chain data. Source: Santiment

Taken together, muted whale activity and declining retail demand reaffirm the short-term correction bias.

Technical outlook: Will Cardano price extend its decline below $0.20?

Cardano holds steady above $0.2200 on Monday, after a bearish breakout of a declining trendline around $0.2321 last week. The ADA price holds beneath both the 50-day and 200-day Exponential Moving Averages (EMAs) at roughly $0.2290 and $0.2395, respectively, reinforcing the bearish bias.

Momentum indicators add a negative bias as the Moving Average Convergence Divergence (MACD) is below zero with a negative histogram, and the Relative Strength Index (RSI) is hovering near 42, suggesting sellers retain the upper hand without yet reaching oversold conditions.

The path of least resistance warns of a steeper decline toward the next support level in sight, aligning with the August 30 low around $0.1894, implying a downside risk of nearly 15%.

Chart Analysis ADA/USDT (Binance)
ADA/USDT daily price chart.

On the topside, initial resistance is seen at the 50-day EMA near $0.2290, with the prior uptrend support-turned-barrier around $0.2321 forming the next cap, ahead of stronger supply at the 200-day EMA close to $0.2395.

(The technical analysis of this story was written with the help of an AI tool. Know more.)

Disclaimer: For information purposes only. Past performance is not indicative of future results.
placeholder
Gold Price Analysis Today | Forex Gold Analysis | XAU/USD Analysis - November 11, 2026Get the latest gold price analysis, forex gold insights, and XAU/USD analysis for November 11, 2026. Read on for the details.
Author  Mitrade
Nov 11, Wed
Get the latest gold price analysis, forex gold insights, and XAU/USD analysis for November 11, 2026. Read on for the details.
placeholder
Bitcoin lost its 200-day average — but the exit started three sessions before the CPIBitcoin fell 2.5% to about $73,400 on 11 November, an 11-week low, breaking its 200-day moving average near $73,100. The 24-hour liquidation tally reached $632 to $705 million, roughly 82% of it longs. But spot ETF outflows began three sessions earlier and USDT's market cap has shrunk $6.6 billion in 60 days — the leveraged length left before the inflation print did. A double top at 81,890 and 81,080 leaves a measured target of 69,366.
Author  Suzie
Nov 11, Wed
Bitcoin fell 2.5% to about $73,400 on 11 November, an 11-week low, breaking its 200-day moving average near $73,100. The 24-hour liquidation tally reached $632 to $705 million, roughly 82% of it longs. But spot ETF outflows began three sessions earlier and USDT's market cap has shrunk $6.6 billion in 60 days — the leveraged length left before the inflation print did. A double top at 81,890 and 81,080 leaves a measured target of 69,366.
placeholder
Gold Extends Slide Below $4,000 as Rising US Inflation, Fed December Hike Bets Pressure Prices On November 12, gold prices (XAUUSD) extended their recent losses, falling further below $4,000 in early Asian trading to hit an intraday low near $3,968, marking a third consecutive day
Author  TradingKey
Yesterday 02: 00
On November 12, gold prices (XAUUSD) extended their recent losses, falling further below $4,000 in early Asian trading to hit an intraday low near $3,968, marking a third consecutive day
placeholder
Nvidia slid 7.7% after hours while AMD and Broadcom rose — the AI trade changed hands, it didn't breakNvidia closed Wednesday at 173.73, up 2.87%, then fell as much as 8.1% to 159.44 after reports that its board was preparing for a possible leadership change. The same session, the Philadelphia Semiconductor Index rose 5.7% with all 30 components higher, CoreWeave jumped 24.7% on 168% revenue growth, and Micron added 11.9%. If AI demand were being repriced, AMD and Broadcom would not be bid. This is a governance discount on one name, and 204.54 — the 200-day average — is the level that settles it.
Author  Irene Q.
Yesterday 02: 45
Nvidia closed Wednesday at 173.73, up 2.87%, then fell as much as 8.1% to 159.44 after reports that its board was preparing for a possible leadership change. The same session, the Philadelphia Semiconductor Index rose 5.7% with all 30 components higher, CoreWeave jumped 24.7% on 168% revenue growth, and Micron added 11.9%. If AI demand were being repriced, AMD and Broadcom would not be bid. This is a governance discount on one name, and 204.54 — the 200-day average — is the level that settles it.
placeholder
Gold closed below $4,000 again — the ETF crowd and central banks stayed, the momentum money leftSpot gold is trading near $3,999, its third consecutive lower daily low, after a 5.00% 10-year yield and a 102.85 dollar index raised the odds of a December hike to 87%. But the selling is not coming from the strategic holders: managed-money net longs fell to 324 tonnes, a 21-week low, and Goldman Sachs attributes roughly 95% of five weeks of selling to non-reportable positions. ETFs still hold a record 4,256 tonnes and central banks bought 321 tonnes in Q3. The table below sets the triggers, directions and levels.
Author  Irene Q.
Yesterday 03: 20
Spot gold is trading near $3,999, its third consecutive lower daily low, after a 5.00% 10-year yield and a 102.85 dollar index raised the odds of a December hike to 87%. But the selling is not coming from the strategic holders: managed-money net longs fell to 324 tonnes, a 21-week low, and Goldman Sachs attributes roughly 95% of five weeks of selling to non-reportable positions. ETFs still hold a record 4,256 tonnes and central banks bought 321 tonnes in Q3. The table below sets the triggers, directions and levels.
Related Instrument
goTop
quote