

Pi Network Price Forecast: Steady decline risks a lower leg below $0.080

Source Fxstreet
  • Pi Network is down over 4% on Wednesday, extending a steady decline over the past seven days.
  • Social chatter surrounding the PI token surges to an annual high of 0.16% on Tuesday.
  • The technical outlook for PI is bearish, risking a breakout below the crucial support level near $0.0801.

Pi Network (PI) continues to extend a bearish phase over the last seven days, risking a breakout below the $0.0800 round figure. The social chatter surrounding the PI token is on the rise, likely driven by investors’ fear. The technical outlook for Pi Network suggests a downside bias as bearish momentum persists. 

Social chatter warns of investors’ panic

Pi Network is gaining social interest despite its declining spot price. Santiment data shows a surge in social dominance to 0.16% on Tuesday, up from 0.03% the previous day. This increase in social buzz surrounding the PI token coincides with the recent bearish phase, suggesting a potential stress building among investors. 
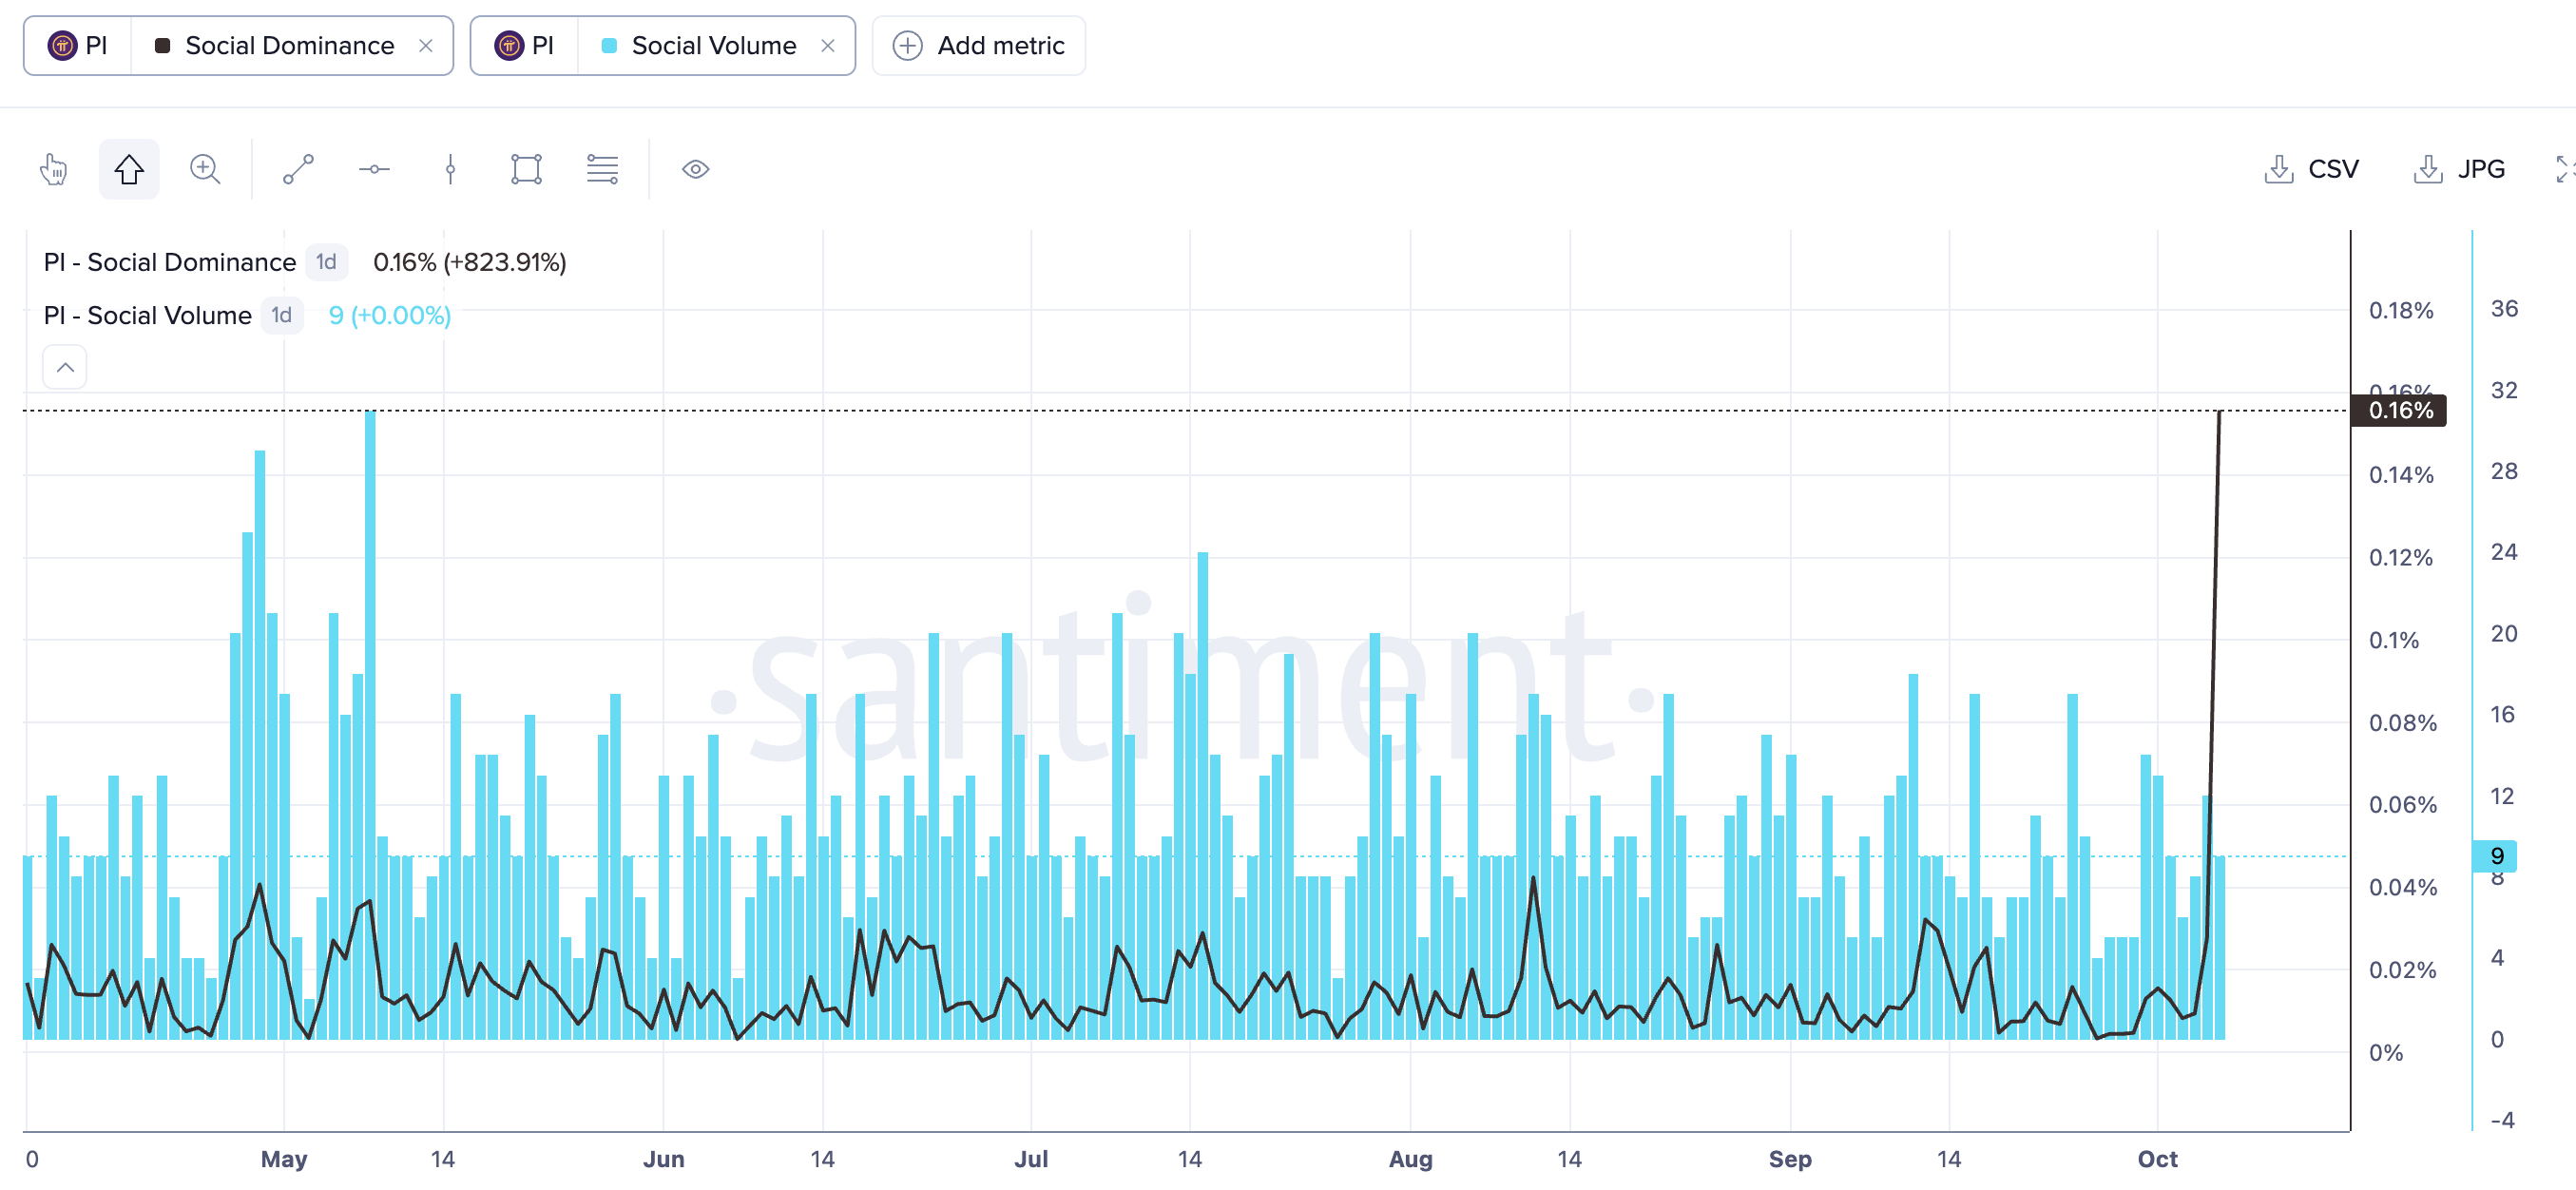
PI social interest data. Source: Santiment

Technical outlook: Pi Network holds at the last line of defense

Pi Network trades around $0.0830 at press time on Wednesday, maintaining a firm bearish bias. PI token holds extends a steady decline below the 50-day Exponential MOving Average (EMA) around $0.09061, which capped gains last week. Meanwhile, 100- and 200-day EMAs at $0.09890, and $0.1250, respectively, are well above the spot price, reaffirming a long-term downtrend.

The Moving Average Convergence Divergence (MACD) crosses below zero and signal line, while the Relative Strength Index (RSI) at 37 hovers just above oversold territory, hinting at persistent downside pressure.

The immediate support cluster of the 23.6% Fibonacci level at $0.08271, measured from $0.1341 to $0.0704, and the July 31 low at $0.0801 acts as the last line of defense. A confirmed breakout below this support zone could extend the decline towards the $0.0704 swing low, which could ignite dip buying interest.

Chart Analysis PI/USD (baha Crypto)
PI/USD daily price chart.

On the topside, initial resistance aligns at the 50-period EMA at $0.0906, followed by the 100-period EMA at $0.09890 near the 50% retracement level at $0.0990.

(The technical analysis of this story was written with the help of an AI tool. Know more.)

Disclaimer: For information purposes only. Past performance is not indicative of future results.
placeholder
WTI rises to near $89.50 as Middle East supply threats offset Persian Gulf recoveryWest Texas Intermediate (WTI) oil price extends its gains for the second successive day, trading around $89.50 per barrel during the Asian hours on Wednesday. Crude oil climbed as persistent risks to Middle East energy flows overshadowed signs of rising supply from the region.
Author  FXStreet
Oct 07, Wed
West Texas Intermediate (WTI) oil price extends its gains for the second successive day, trading around $89.50 per barrel during the Asian hours on Wednesday. Crude oil climbed as persistent risks to Middle East energy flows overshadowed signs of rising supply from the region.
placeholder
WTI slips below $90.50 as Trump signals no pre-election strike on IranWest Texas Intermediate (WTI) oil price declines after posting nearly 2.5% gains in the previous day, trading around $90.30 per barrel during Asian hours on Friday.
Author  FXStreet
Oct 09, Fri
West Texas Intermediate (WTI) oil price declines after posting nearly 2.5% gains in the previous day, trading around $90.30 per barrel during Asian hours on Friday.
placeholder
Hurricane Isaias has shut in a quarter of Gulf oil output — can WTI clear $92 before Thursday's EIA report?WTI trades at $90.80 after rebounding roughly 3% from Wednesday's $87.96 low as Hurricane Isaias — the Atlantic season's first — forces producers to shut in about 25% of US Gulf of Mexico output. Brent holds at $103.41. The first official read on the disruption arrives with the EIA weekly petroleum report on Thursday 15 October — here are the key levels and both scenarios.
Author  Irene Q.
Oct 09, Fri
WTI trades at $90.80 after rebounding roughly 3% from Wednesday's $87.96 low as Hurricane Isaias — the Atlantic season's first — forces producers to shut in about 25% of US Gulf of Mexico output. Brent holds at $103.41. The first official read on the disruption arrives with the EIA weekly petroleum report on Thursday 15 October — here are the key levels and both scenarios.
placeholder
US September CPI preview: inflation set to hit 3.7% — will the Fed hike in December?US September CPI lands Wednesday with headline inflation seen at 3.7% y/y and core at 0.2% m/m. December hike odds sit near 70% — here are the scenarios, the calendar and the key levels.
Author  Irene Q.
Yesterday 03: 23
US September CPI lands Wednesday with headline inflation seen at 3.7% y/y and core at 0.2% m/m. December hike odds sit near 70% — here are the scenarios, the calendar and the key levels.
placeholder
Gold posts first weekly gain in three weeks — can $4,200 hold through CPI?Spot gold closed at $4,194.645, up 1.47% — its first weekly gain in three weeks — and COMEX futures settled back above $4,200 at $4,220.30. Here are the drivers, the levels and the scenarios into Wednesday's CPI.
Author  Irene Q.
Yesterday 05: 48
Spot gold closed at $4,194.645, up 1.47% — its first weekly gain in three weeks — and COMEX futures settled back above $4,200 at $4,220.30. Here are the drivers, the levels and the scenarios into Wednesday's CPI.
goTop
quote