


Chainlink Price Forecast: Extends rally on rising ETF inflows, bullish derivatives and Infosys deal
- Chainlink extends its gains, trading above $13.40 on Friday, up over 7% so far this week.
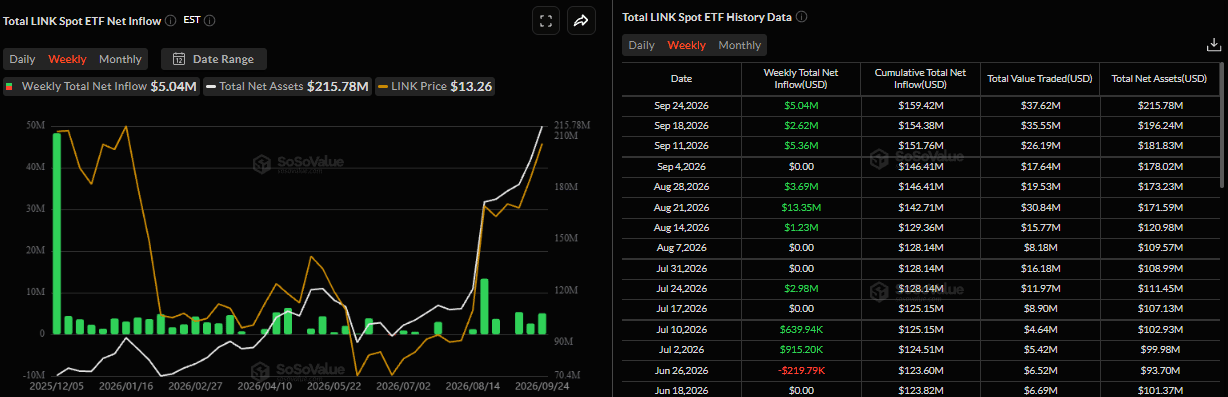
- US-listed spot ETFs are on track for a third straight week of inflows, with $5.04 million recorded through Thursday.
- Improving derivatives positioning and Chainlink’s expanding strategic partnerships support a constructive outlook for LINK.
Chainlink (LINK) extends its gains, trading above $13.40 at the time of writing on Friday and up more than 7% so far this week.
Three key factors support the bullish price action: strengthening institutional demand, improving derivatives positioning and expanding strategic partnerships. If these trends persist, LINK could extend its ongoing rally.
Strengthening LINK institutional demand
Institutional demand remains robust so far this week. SoSoValue data showed spot ETFs are on track for a third straight week of inflows, with $5.04 million recorded through Thursday. If these inflows continue and intensify on Friday, LINK could extend its ongoing rally.
Improving derivatives sentiment
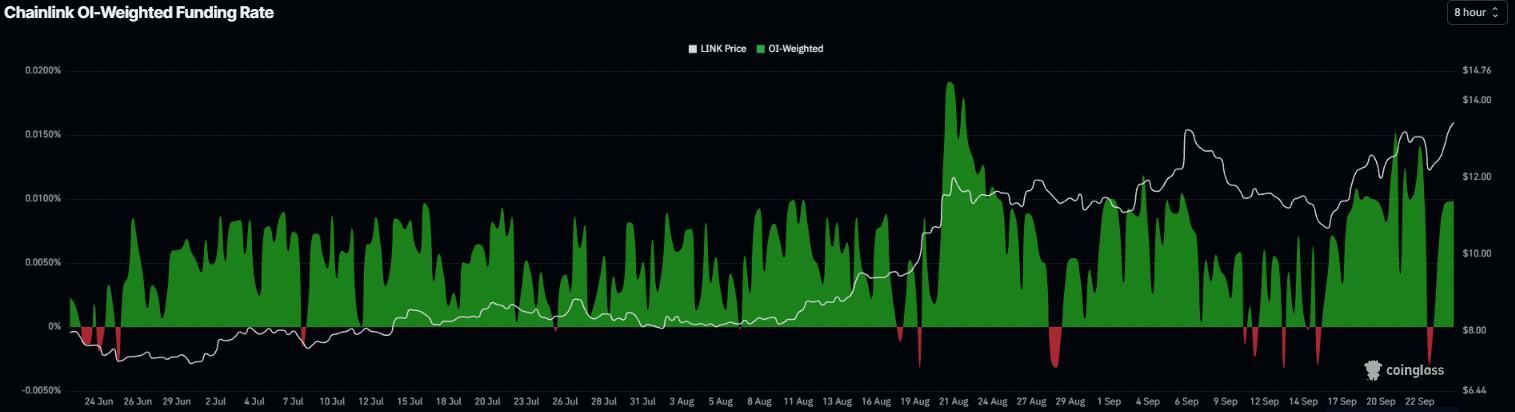
Derivatives data shows improving sentiment among Chainlink traders. Coinglass’s funding rates for LINK flipped positive on Wednesday and surged to 0.0098% on Friday. This indicates longs are paying shorts, reflecting a bullish outlook.
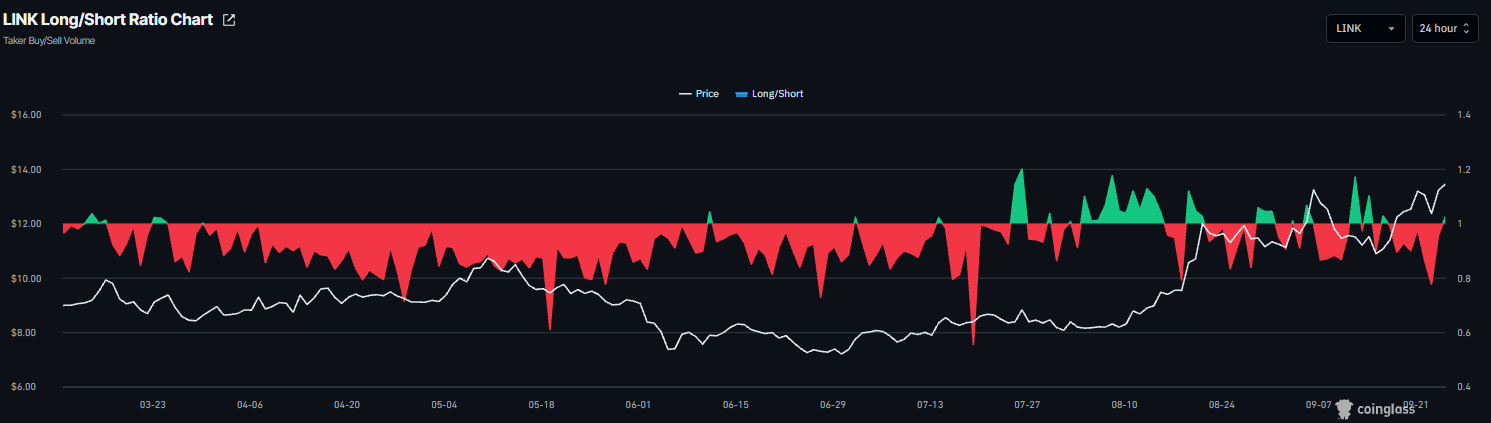
In addition, CoinGlass’ long-to-short ratio for Chainlink read 1.02 on Friday. A ratio above one indicates bullish sentiment, as traders bet that asset prices will rise.
Expanding strategic partnerships
Apart from strengthening institutional demand and improving derivatives positioning, Chainlink’s expanding strategic partnerships support a constructive outlook for LINK.
On Tuesday, Chainlink announced a strategic partnership with Infosys, a global IT leader with a market cap of over $40 billion.
Infosys supports critical banking and payments infrastructure for more than 1.7 billion customer accounts worldwide and is now standardizing the adoption of the Chainlink platform.
“Together, Infosys and Chainlink are creating a path to connect the world’s largest financial institutions to onchain markets,” said Chainlink on its X post.
Chainlink technical outlook: Bulls head toward higher marks
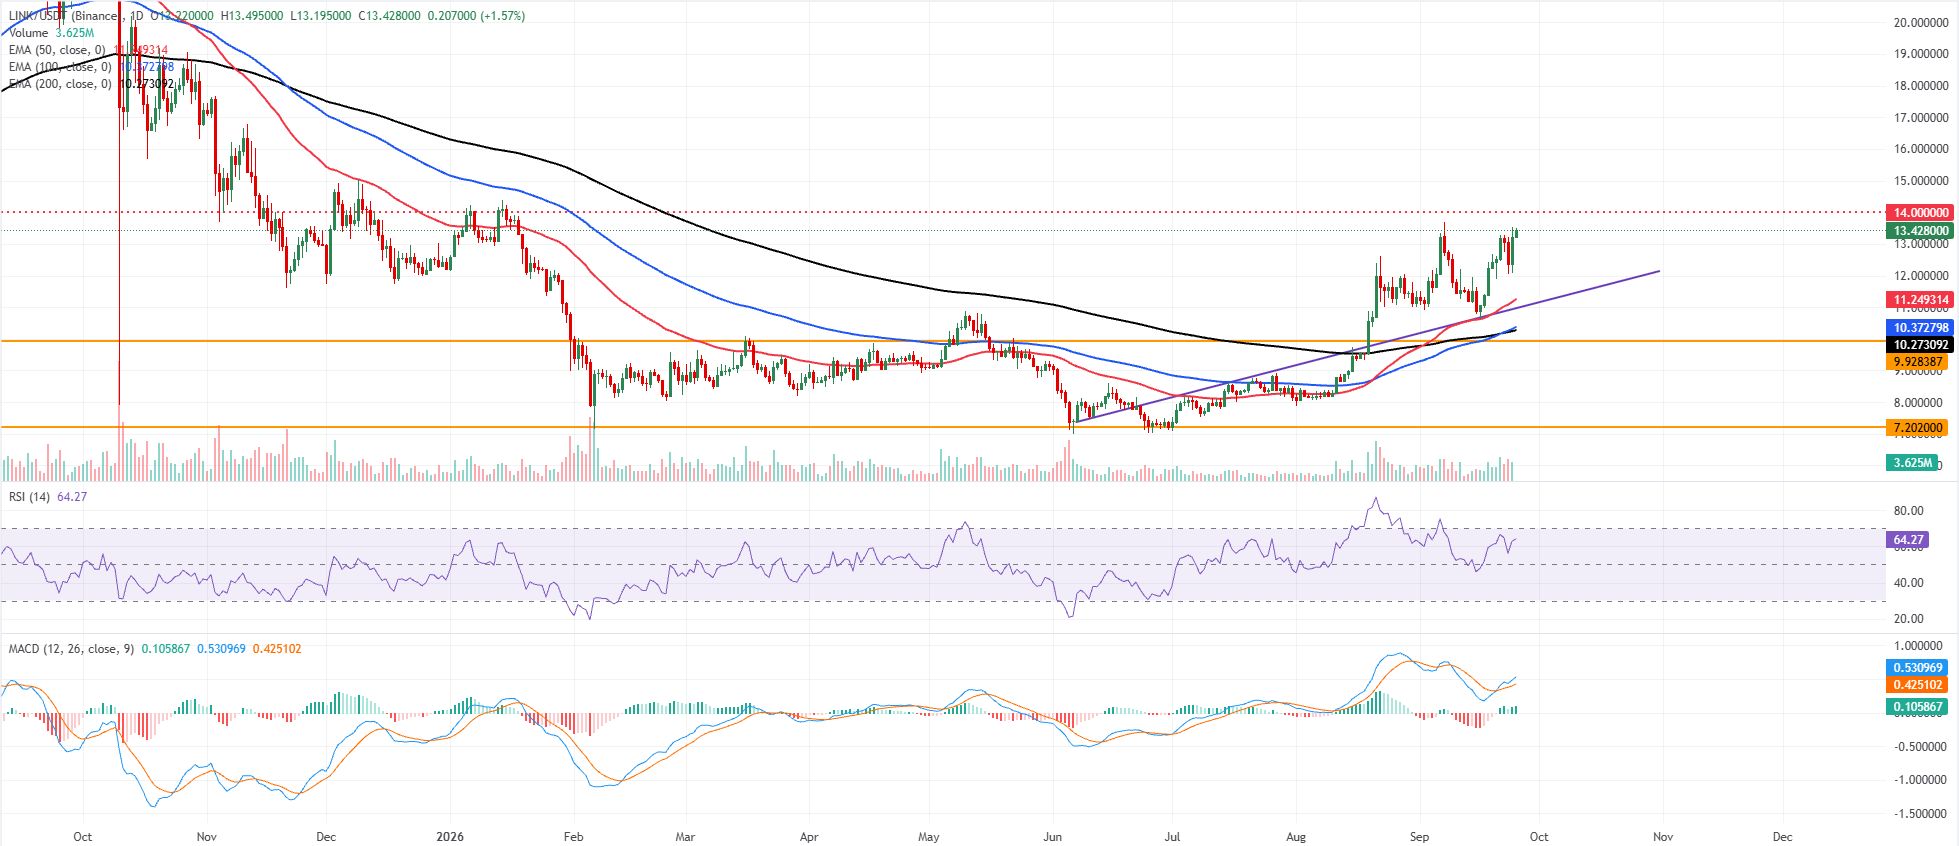
Chainlink price trades at $13.42, maintaining a bullish near-term bias as it holds above key Exponential Moving Averages (EMAs).
The 50-day EMA at $11.24, along with the 100-day EMA at $10.37 and the 200-day EMA at $10.27, sits well below the market and suggests a constructive underlying trend.
Momentum remains supportive, with the Relative Strength Index (RSI) around 64. At the same time, the Moving Average Convergence Divergence (MACD) indicator stays in positive territory, hinting at sustained buying pressure despite the recent overextension.
On the topside, initial resistance is located at the horizontal barrier near $14, where fresh supply could emerge if bulls attempt another leg higher.
On the downside, immediate support is seen at the 50-day EMA at $11.24, followed by a broader demand band defined by the 100-day EMA at $10.37 and the 200-day EMA at $10.27. Deeper setbacks would expose the prior horizontal floor at $9.92, while only a move toward the $7.2020 structural base would seriously undermine the prevailing bullish structure.
(The technical analysis of this story was written with the help of an AI tool. Know more.)
Recommended Articles


