


Crypto Overview: Bitcoin holds steady, resonates with Gold – ARB, PYTH extend gains
- Bitcoin hovers above $77,000 as momentum indicators point to easing bullish pressure.
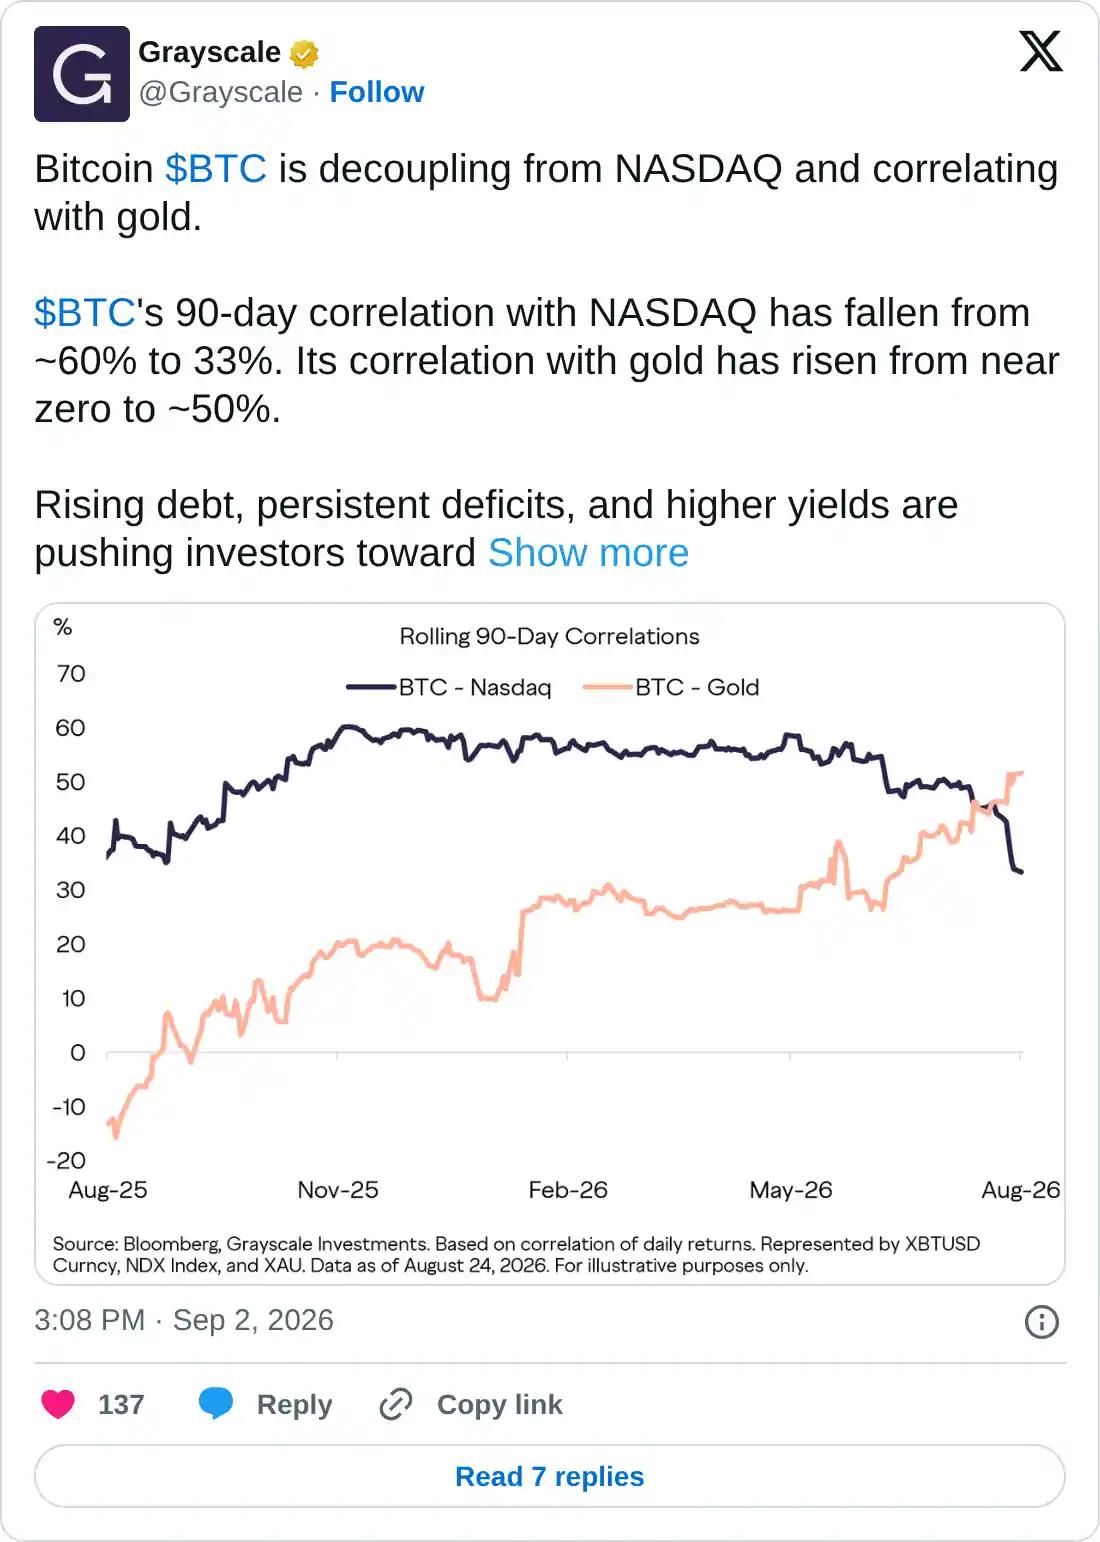
- Bitcoin’s 90-day correlation with Gold has climbed to roughly 50%, strengthening its position as a hedge against debasement.
- Arbitrum and Pyth Network record double-digit gains over the last 24 hours, emerging as top performers.
Bitcoin (BTC) price hovers above $77,000 on Thursday, losing bullish momentum as its correlation with Gold has risen to nearly 50% over the last 90 days. Arbitrum (ARB) and Pyth Network (PYTH) recorded double-digit gains over the last 24 hours, emerging as top performers.
Bitcoin starts to resonate with Gold
Bitcoin’s 90-day correlation with NASDAQ has reduced to 33% from nearly 60%, while its correlation with Gold has increased to almost 50%. The rising US debt of over $40 trillion, persistent deficits, and higher yields in the bond market are pushing investors toward hedges against debasement, such as Bitcoin and gold.
Although the recent announcement of doubling the long-maturity bond buyback operations to $4 billion from $2 billion, with lower yields in the near term, rising government debt poses a long-term threat. Taken together, Bitcoin's rising correlation with Gold amid the debasement trade strengthens the case for the scarce digital asset and its long-term growth.
Bitcoin bulls take a breather
Bitcoin trades around $77,328 at press time on Thursday, holding a bullish near‑term bias as price remains comfortably above the 50‑, 100‑, and 200‑day Exponential Moving Averages (EMAs), which are clustered between roughly $69,400 and $72,400.
The pair is also trading above the 50% retracement level at $75,233 of the $97,924-$57,800 downswing, reinforcing a constructive underlying structure.
The Relative Strength Index (RSI) near 65 suggests firm but easing from overbought momentum. However, the Moving Average Convergence Divergence (MACD) indicator has slipped below its signal line, hinting at a possible pause or consolidation.
Looking up, initial resistance emerges at the 78.6% Fibonacci retracement at $87,476, followed by the cycle high zone near $97,924.
On the downside, first support is seen at the 50% retracement at $75,233, ahead of a dense EMA demand band formed by the 200‑day EMA at $72,365, 50‑day EMA at $70,574, and the 100‑day EMA at $69,395, underpinning the broader bullish structure.
Arbitrum and Pyth Network extend gains
Arbitrum is up over 5% on Thursday, extending its 12% rise from the previous day. ARB holds a bullish near-term bias as price remains above the 50-day, 100-day, and 200-day EMAs at $0.0906, $0.0929, and $0.1164, respectively.
The four-day recovery tests the bullish breakout of the 78.6% Fibonacci retracement level at $0.1272, measured from $0.1495 to $0.0705. A confirmed breakout could target the $0.1495 swing high.
The MACD and signal line show a positive slope with improving momentum, while the RSI at 76 signals overbought conditions that could slow the advance.
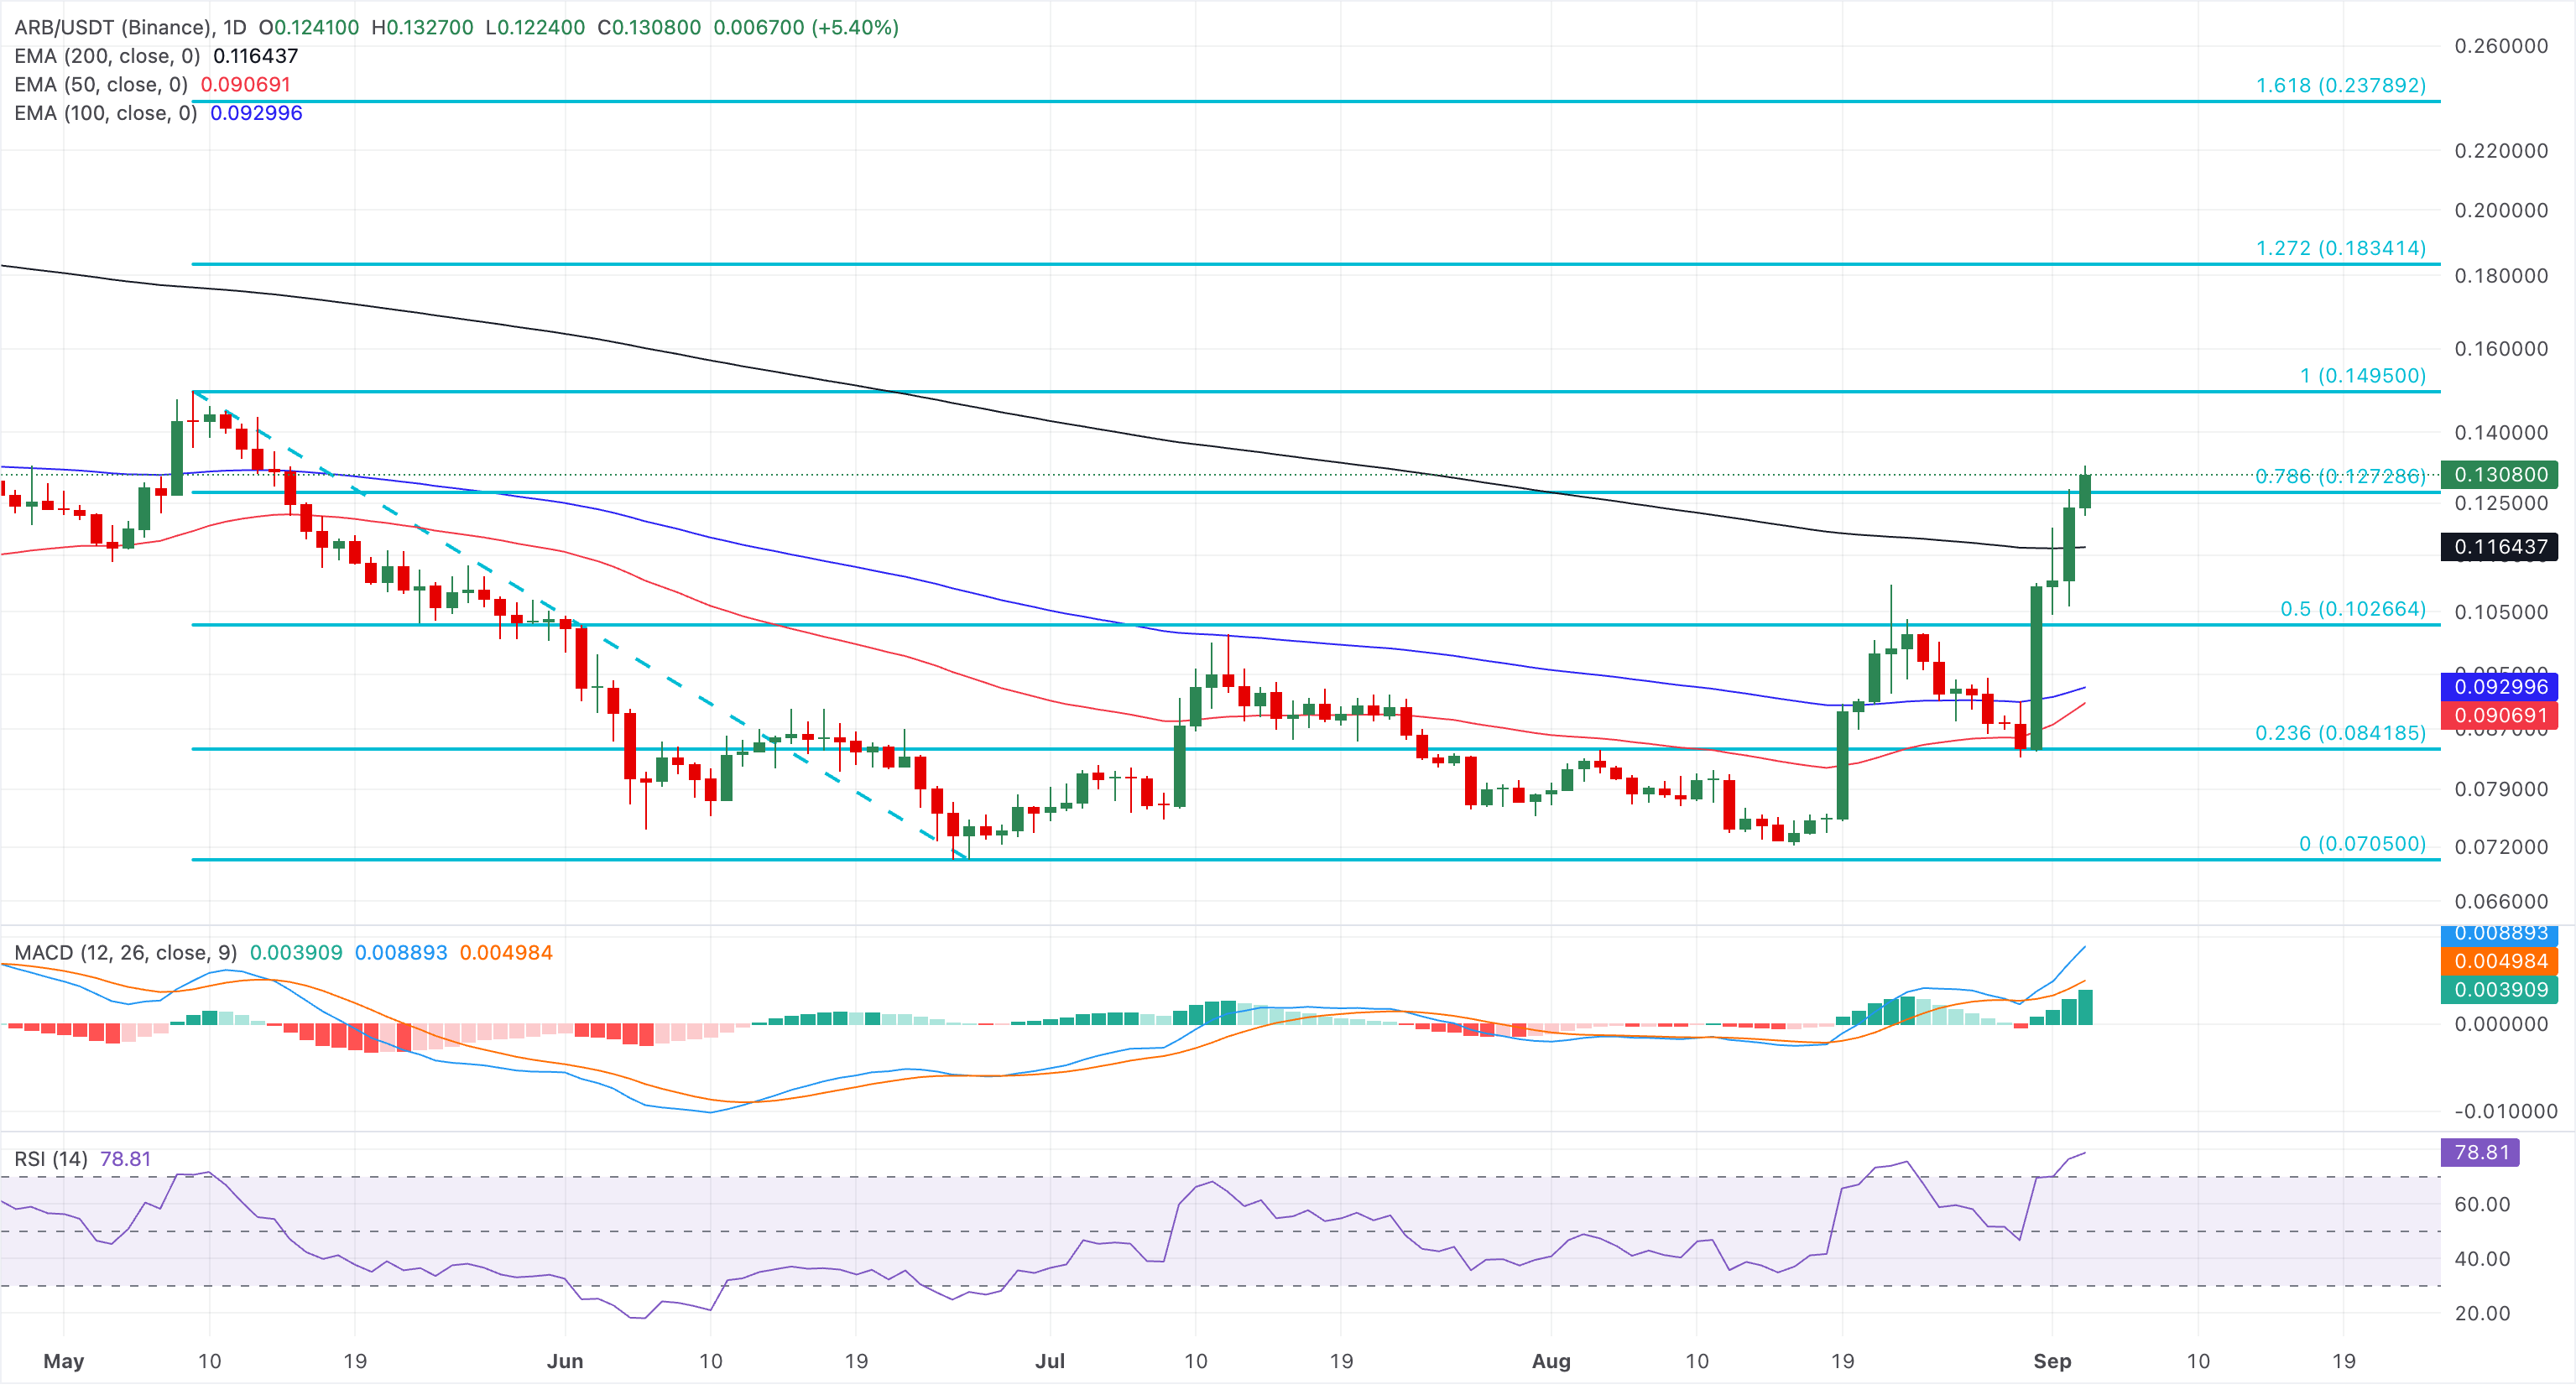
Looking down, initial support is seen at the 200-day EMA at $0.1164, followed by the 50% retracement level at $0.1026.
Pyth Network is up 3% on Thursday, advancing its 10% gains from the previous day. PYTH extends its recovery for the fourth consecutive day, comfortably above the 200-day EMA at $0.0499, while the 50- and 100-day EMAs are at $0.0455 and $0.0446, reinforcing a constructive bullish structure.
The broken downward resistance trendline now offers support around $0.0552, suggesting buyers have absorbed prior supply. The immediate resistance for PYTH is at the May 9 high of $0.0631, followed by the January 6 high of $0.0737.
The RSI near 75 enters the overbought zone, while the MACD bounces off its signal line, extending its upward trend and hinting that bullish momentum remains intact in the near term.
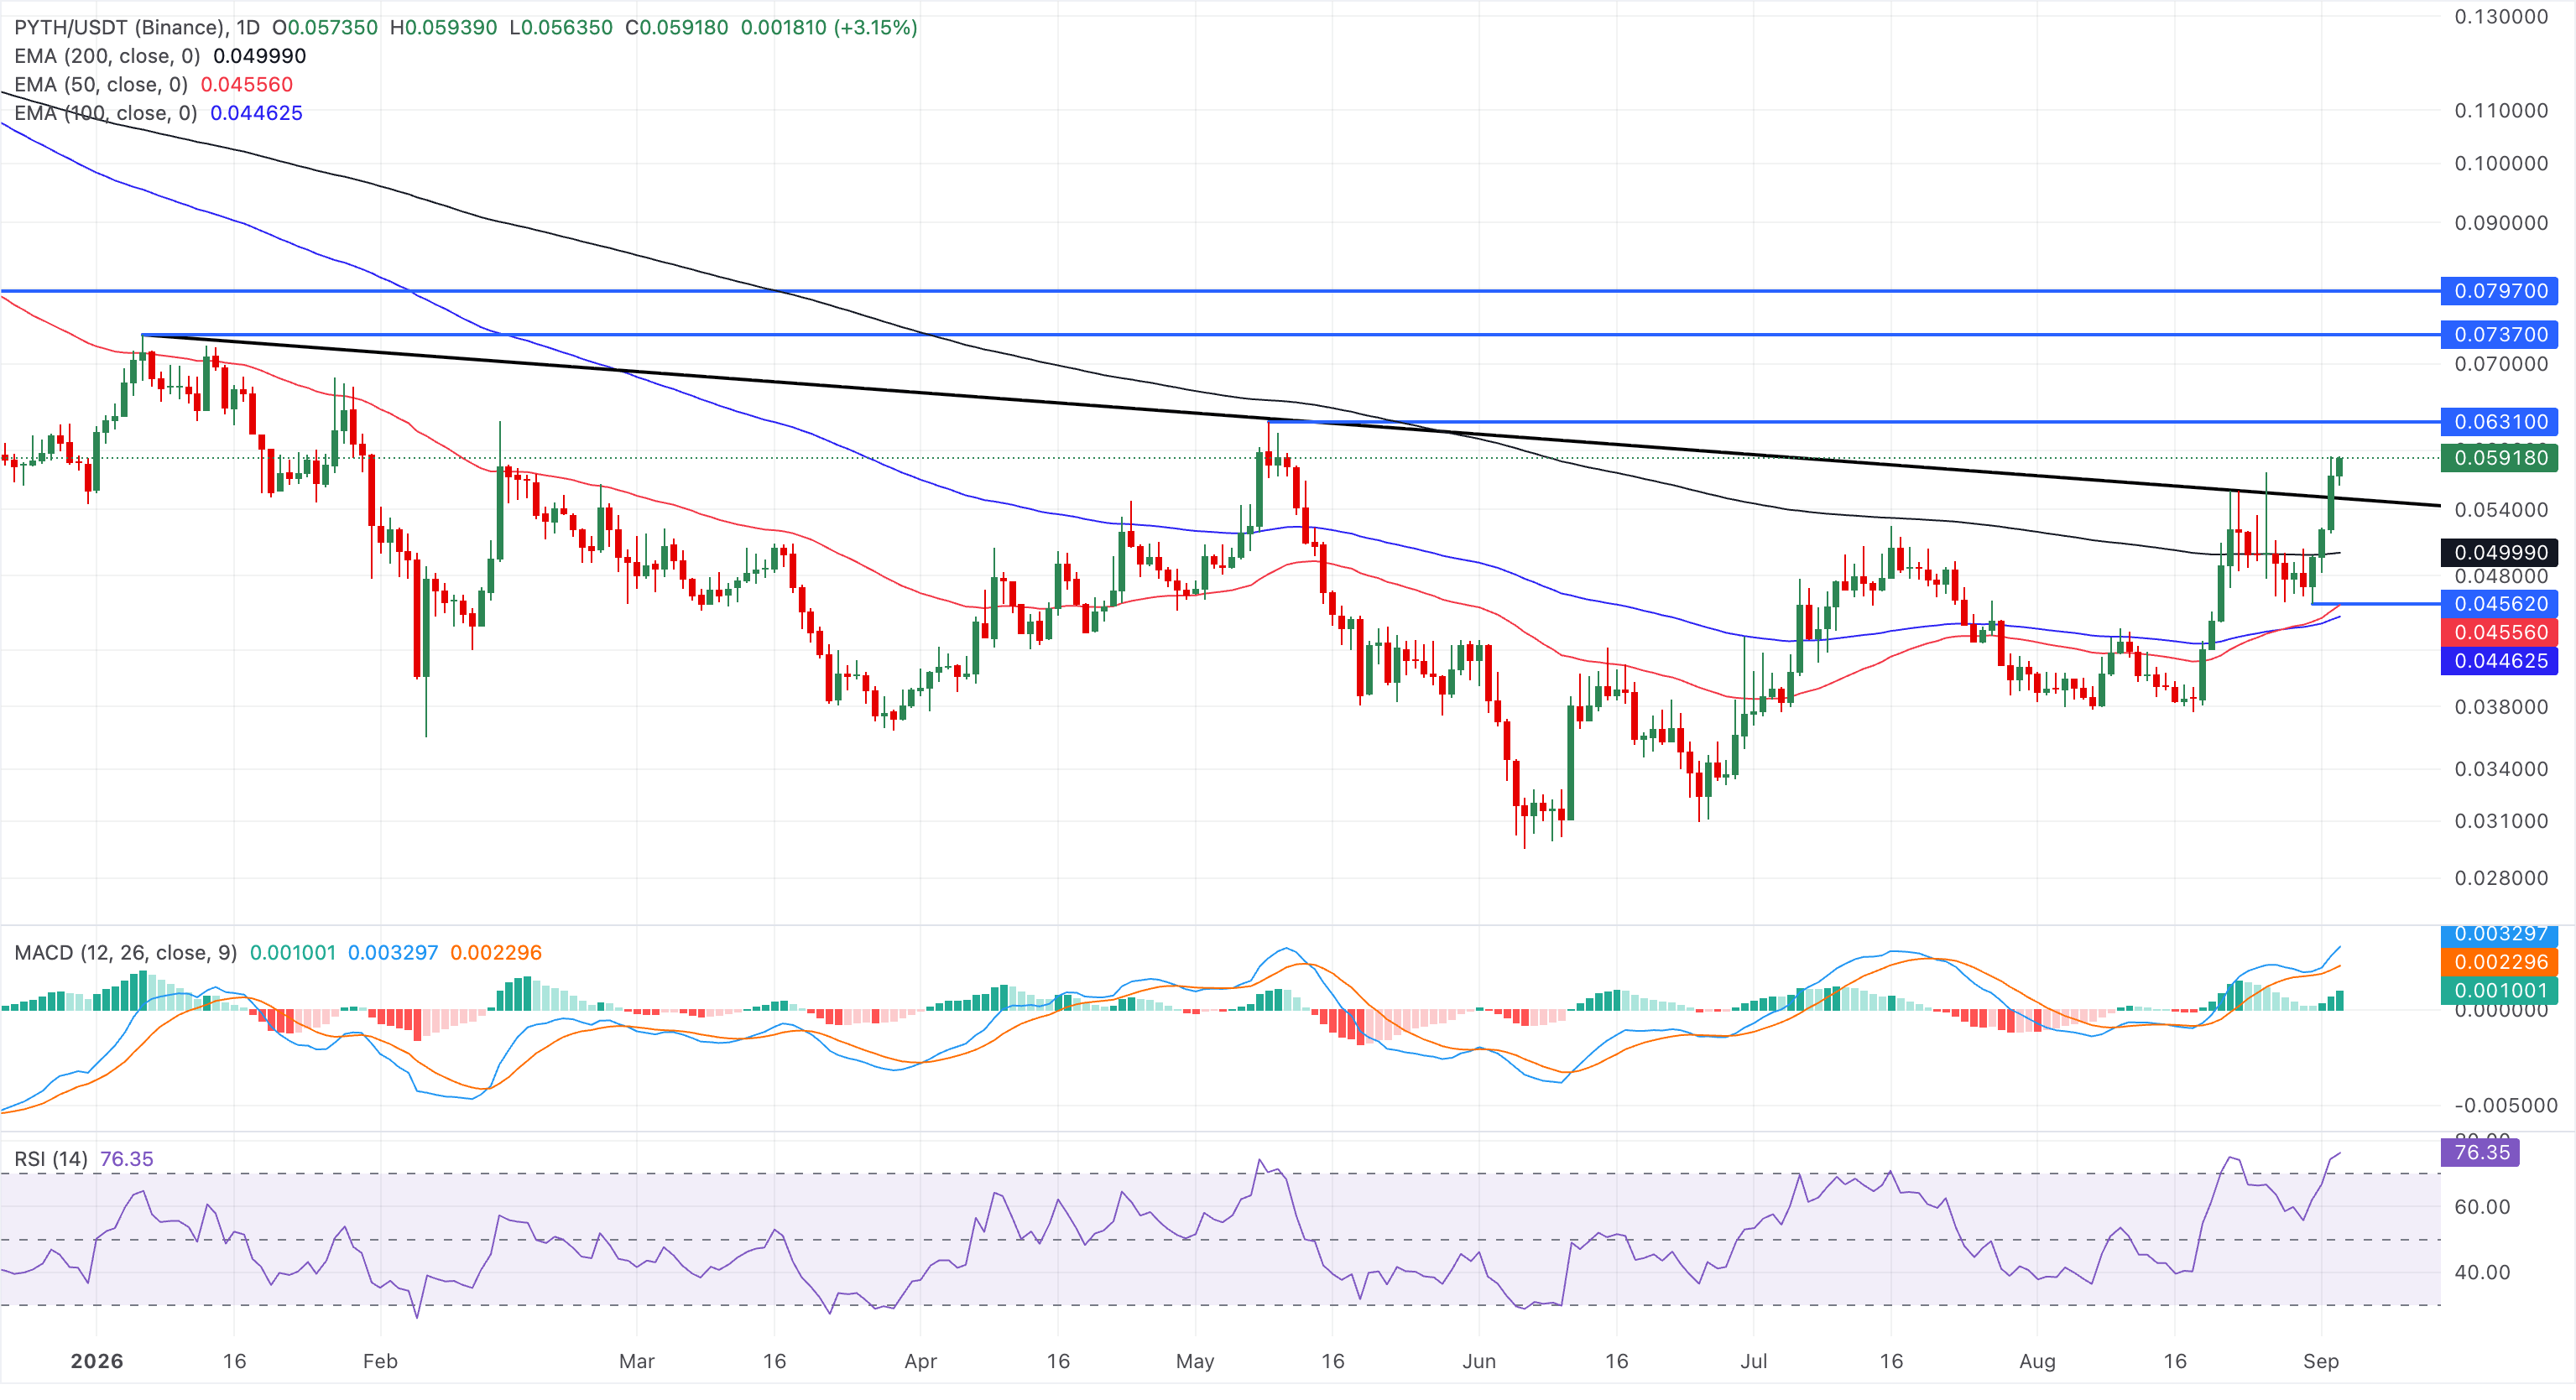
Immediate support lies at the former trendline break near $0.0552, ahead of the 200-day EMA at $0.0499, where a deeper pullback could test the durability of the current uptrend.
(The technical analysis of this story was written with the help of an AI tool. Know more.)
Recommended Articles


