

Ethereum Price Forecast: Rising stablecoin supply and ETF inflows behind ETH's rally

Source Fxstreet

Ethereum price today: $2,510

  • Ethereum reclaimed the $2,500 level after the stablecoin market cap began expanding, growing by $4.1 billion over the past two weeks.
  • US spot ETH ETFs have added $1.18 billion across eight consecutive days of net inflows.
  • ETH is consolidating above the $2,430 support.

Ethereum (ETH) reclaimed $2,500 on Thursday following an expansion in stablecoin supply and exchange-traded funds (ETFs) inflows.

Stablecoin growth and ETH ETFs inflows fuel rally

The total stablecoin market cap has increased by roughly $4.1 billion over the past two weeks. From that figure, $2.37 billion came in the past seven days.

The growth marks its first two-week expansion since mid-May, when the crypto market fell nearly 30% after a brief bear-market rally. Between mid-May and August 11, the stablecoin market contracted by roughly $16.1 billion.

Increased stablecoin inflows indicate new money is flowing into the crypto market, providing investors with more buying power. Outflows show investors are leaving the market after potentially booking profits/cutting losses.

While money is flowing into the crypto market through native crypto investors, traditional investors have also flipped bullish. US spot ETH exchange-traded funds (ETFs) have pulled in $1.18 billion in net inflows over eight consecutive trading days, their longest positive streak since April and largest eight-day flow since October, according to SoSoValue data.
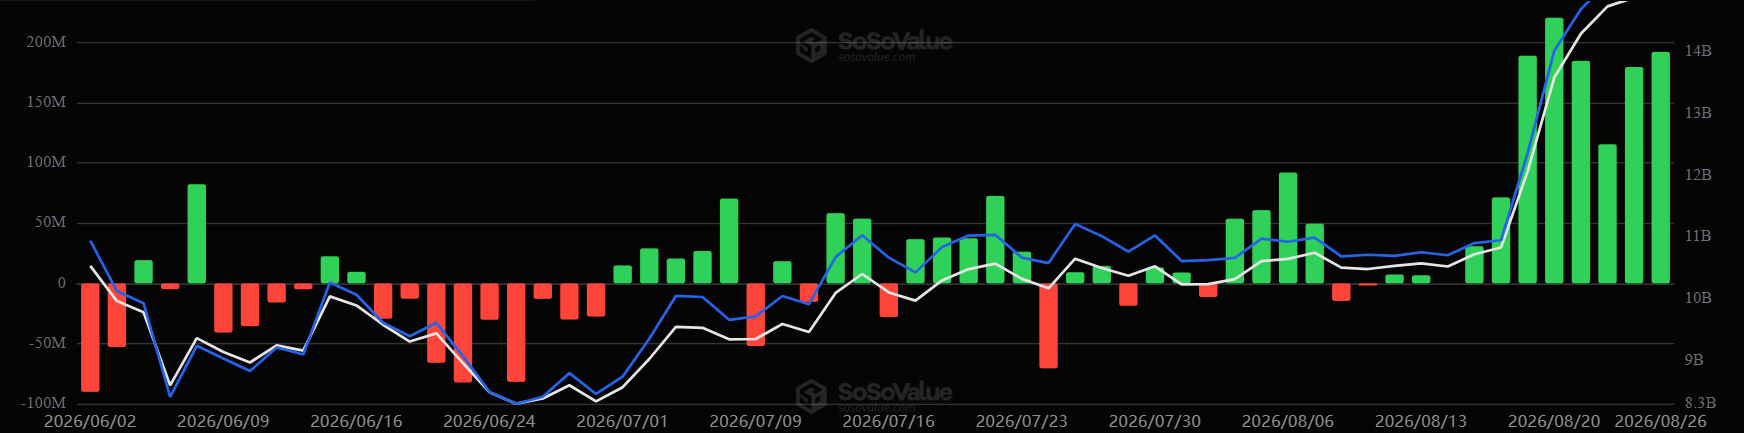
US Spot ETH ETFs. Source: SoSoValue

In addition, staked ETH has continued its uptrend, reaching 42.4 million ETH, representing 34.7% of total supply, per Ultrasound Money data.

Ethereum technical analysis: ETH consolidates above $2,430

Ethereum recorded $122.9 million in liquidations over the past 24 hours, driven by $77 million in short liquidations, per Coinglass data.

On the daily chart, ETH retains a bullish near-term bias as price holds well above both long- and short-term Exponential Moving Averages (EMAs), reinforcing a broad constructive structure.

However, momentum readings are stretched, as the 14-day Relative Strength Index (RSI) hovers in overbought territory near 77 and the Stochastic Oscillator (Stoch) climbs above 90, hinting that upside could be vulnerable to a corrective pause despite the firm underlying trend.

On the downside, immediate support is at the recent horizontal pivot around $2,432, with deeper support from the clustered short-term averages near $2,223 and the $2,172–$2,151 band, ahead of the mid-range EMA supports at $2,043 and $2,005.

Chart Analysis ETH/USDT (Binance)
ETH/USDT daily chart

On the topside, ETH faces initial resistance at $2,744, followed by a higher barrier at $2,883, where a clear daily close above the former would open the way for a fresh leg higher. A failure to overcome these caps would keep the focus on whether buyers can defend the support stack below $2,500.

(The technical analysis of this story was written with the help of an AI tool. Know more.)

Disclaimer: For information purposes only. Past performance is not indicative of future results.
placeholder
Natural Gas sinks to pivotal level as China’s demand slumpsNatural Gas price (XNG/USD) edges lower and sinks to $2.56 on Monday, extending its losing streak for the fifth day in a row. The move comes on the back of China cutting its Liquified Natural Gas (LNG) imports after prices rose above $3.0 in June. It
Author  FXStreet
Jul 01, 2024
Natural Gas price (XNG/USD) edges lower and sinks to $2.56 on Monday, extending its losing streak for the fifth day in a row. The move comes on the back of China cutting its Liquified Natural Gas (LNG) imports after prices rose above $3.0 in June. It
placeholder
ECB Policy Outlook for 2026: What It Could Mean for the Euro’s Next MoveWith the ECB likely holding rates steady at 2.15% and the Fed potentially extending cuts into 2026, EUR/USD may test 1.20 if Eurozone growth proves resilient, but weaker growth and an ECB pivot could pull the pair back toward 1.13 and potentially 1.10.
Author  Mitrade
Dec 26, 2025
With the ECB likely holding rates steady at 2.15% and the Fed potentially extending cuts into 2026, EUR/USD may test 1.20 if Eurozone growth proves resilient, but weaker growth and an ECB pivot could pull the pair back toward 1.13 and potentially 1.10.
placeholder
Financial Markets 2026: Volatility Catalysts in Gold, Silver, Oil, and Blue-Chip Stocks—A CFD Trader's OutlookGet a comprehensive financial market 2026 outlook exploring key economic drivers, volatility catalysts in gold, oil and stocks, and what the evolving economic outlook means for cfd trading strategies and risk management on global markets.
Author  Rachel Weiss
May 15, Fri
Get a comprehensive financial market 2026 outlook exploring key economic drivers, volatility catalysts in gold, oil and stocks, and what the evolving economic outlook means for cfd trading strategies and risk management on global markets.
placeholder
Gold Price Forecast: Hotter-Than-Expected PCE Inflation Pressures Gold, Will Warsh's Jackson Hole Speech Spark a New Rally? As of the European session on August 27, today's gold price (XAUUSD) maintained a range-bound consolidation trend intraday, with the latest price trading near $4,600. On Wednesday, gold p
Author  TradingKey
Yesterday 10: 00
As of the European session on August 27, today's gold price (XAUUSD) maintained a range-bound consolidation trend intraday, with the latest price trading near $4,600. On Wednesday, gold p
placeholder
Silver Reclaims $70 to Hit Nearly Two-Month High as Monthly Gain Exceeds 20% On August 28 Eastern Time, international silver prices continued their recent strong rally, with spot silver (XAGUSD) briefly breaking through the key $70 mark intraday, after approaching
Author  TradingKey
3 hours ago
On August 28 Eastern Time, international silver prices continued their recent strong rally, with spot silver (XAGUSD) briefly breaking through the key $70 mark intraday, after approaching
Related Instrument
goTop
quote