


MSTR Stock Price Prediction: Bitcoin Tops $78,000, Driving Stock Up Over 10% Pre-Market; Has the Downtrend Reversed?
TradingKey - Pre-market on August 21, US Eastern Time, Bitcoin (BTC) continued its recent strong rally, at one point breaking above $78,000 and pushing crypto concept stocks higher. MicroStrategy (MSTR) surged over 10% in pre-market trading, extending its sharp rebound from the previous trading session.
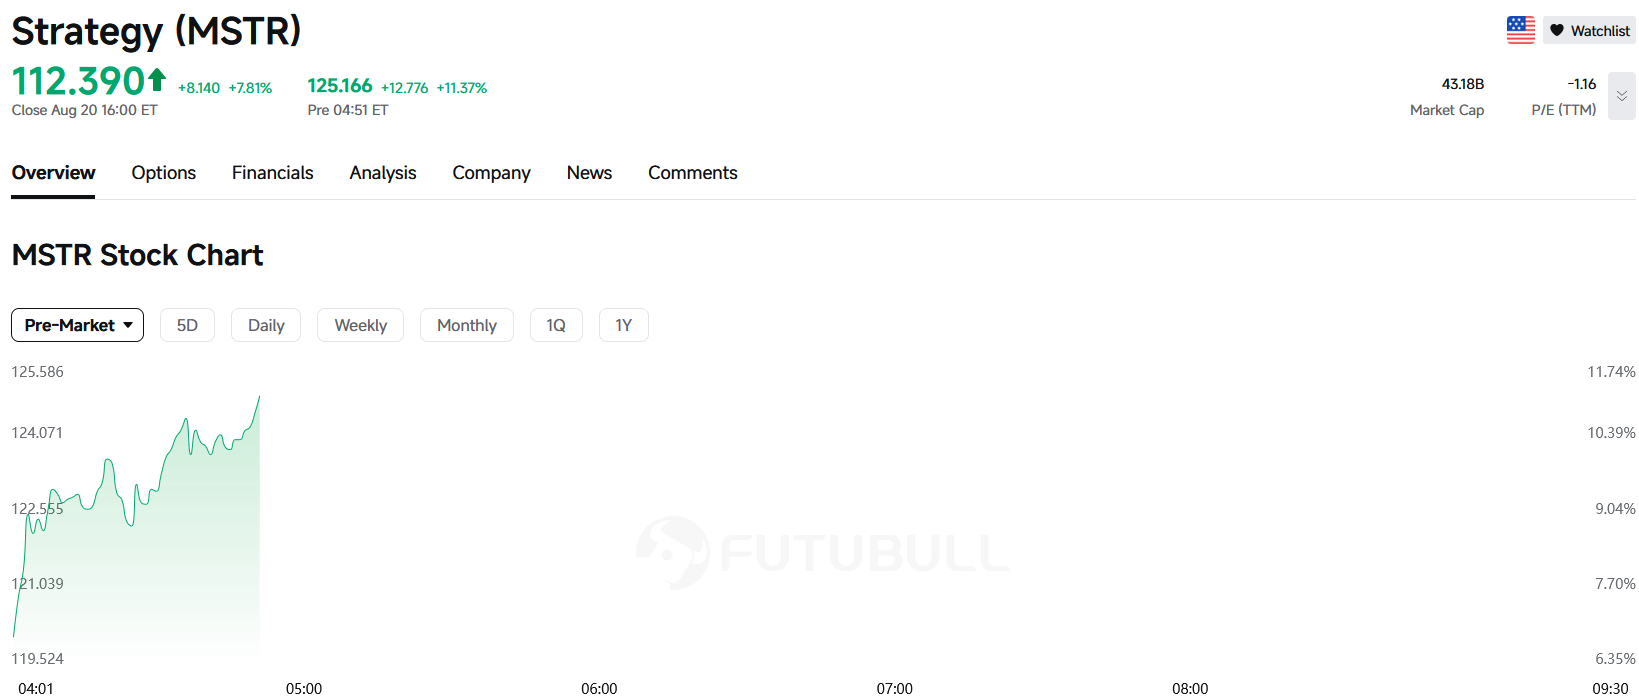
MSTR pre-market stock price movement, Source: FUTUBULL
Recently, the U.S. Treasury's expansion of long-term Treasury buybacks, Trump's push for cryptocurrency regulatory legislation, the SEC signaling a more positive stance on digital asset regulation, and the resurgence of large-scale capital inflows into Bitcoin ETFs have collectively improved market risk appetite. Meanwhile, Bitcoin breaking above MicroStrategy's average holding cost of around $75,000 has also significantly improved market expectations regarding the value of its Bitcoin assets.
Crypto Market Sees Multiple Catalysts as ETF Inflows Return
First, there have been new positive developments in the U.S. digital asset regulatory environment recently. Trump once again urged the U.S. Congress to advance the CLARITY Act, which focuses on further clarifying the digital asset regulatory framework as well as the jurisdictional boundaries between the SEC and the CFTC. At the same time, the U.S. SEC is also pushing forward new digital asset regulatory rules. A clearer regulatory framework helps reduce policy uncertainty faced by institutions entering the crypto market, serving as an important backdrop for the recent improvement in market risk appetite.
Second, institutional funds have returned to Bitcoin. U.S. spot Bitcoin ETFs recently logged single-day net inflows of approximately $517 million, marking the largest single-day inflow since early May. Among them, BlackRock's IBIT attracted about $285 million in net inflows, while ARK 21Shares' ARKB and Fidelity's FBTC also recorded significant inflows.
ETF capital flows are particularly crucial for the current price trend of BTC. Spot ETFs have become an essential channel for U.S. institutions to allocate to Bitcoin, and sustained net inflows signify incremental demand for spot purchases in the secondary market. Therefore, whether ETF flows can maintain net inflows moving forward will serve as an important indicator for gauging the sustainability of this BTC rally.
In addition, macro liquidity expectations have improved. The U.S. Department of the Treasury recently announced an expansion of its liquidity support buyback scale for long-term Treasuries, which eased pressure on long-term Treasury yields. For high-volatility risk assets like Bitcoin, weaker real interest rates and a softer U.S. dollar are typically favorable for valuations and capital risk appetite.
As for MSTR's stock price, MicroStrategy holds approximately 840,000 BTC at an average cost of about $75,000 per coin. With Bitcoin breaking back above $77,000, the company's Bitcoin holdings have returned to an overall profitable zone, improving market expectations regarding its asset value. As long as BTC can stabilize above $75,000–$77,000 and ETF inflows continue, MSTR's short-term rebound could remain supported; conversely, if BTC falls back below this price range, it could exert downside pressure on MSTR's stock price again.
MSTR Stock Technical Analysis
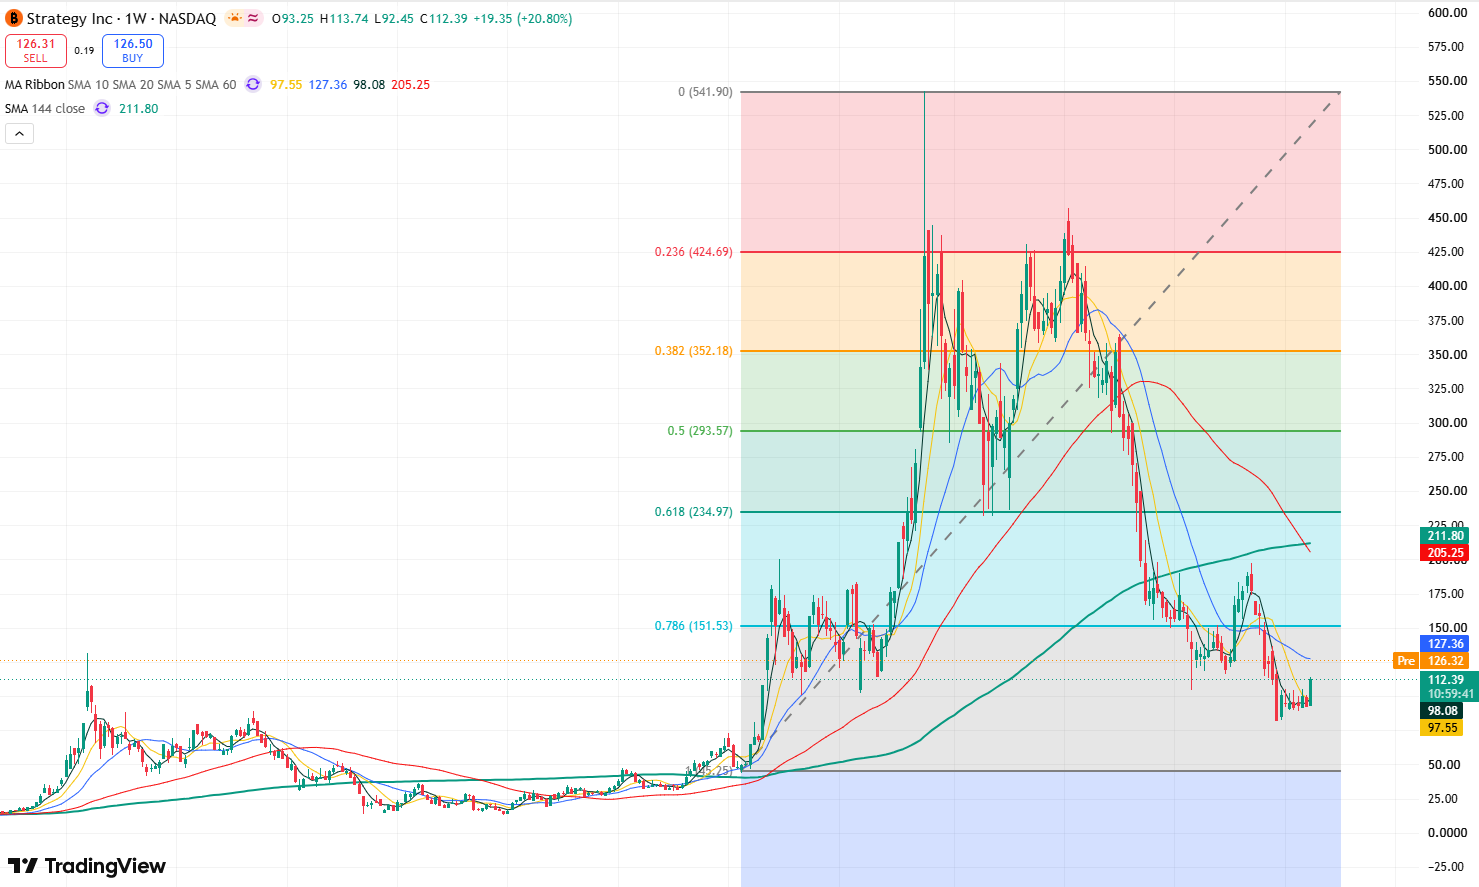
MSTR stock price weekly chart, source: TradingView
From the weekly chart of MSTR's stock price, MSTR has pulled back about 75% from its 2025 high to date, and the stock is still down about 30% year-to-date, indicating that the overall candlestick structure is biased toward the bearish side. Meanwhile, the continuous downward shift of candlestick highs and lows also indicates that the stock's overall trend remains downward. Although there has been a recent rebound, it remains a low-level bounce and technical structure repair, and a medium-term upward trend has not yet been fully confirmed as re-established.
Currently, the primary overhead resistance level to watch is around $120. If it breaks and holds above this level, the stock will open up upside space toward $150. Further up, watch the May rebound high of $197; if it breaks through this level, the stock is expected to test the $235 resistance level on the upside.
On the downside, the primary support level to watch below is around $105. If this level fails to hold, the stock may test the $100 mark on the downside. If it continues to decline, the stock could drop toward $80.
Recommended Articles


