


Ripple and Stellar outlook: Extend gains as expanded US Treasury buybacks trigger crypto short squeeze
- XRP extends gains, trading above $1.08 on Thursday after surging over 10% and closing above 50-day EMA the previous day.
- XLM surges toward the key resistance at $0.177 after rallying more than 9% the previous day.
- US Treasury’s decision to double its debt buyback operations boosts liquidity and helps trigger a short squeeze across both altcoins.
XRP and Stellar (XLM) extend their rallies on Thursday as improving liquidity conditions fuel a broader surge across the cryptocurrency market. XRP trades above $1.08, while XLM approaches the key $0.177 resistance level following surges of more than 10% and 9%, respectively, the previous day.
The US Treasury’s decision to double its debt buyback operations on Wednesday has improved liquidity conditions and helped trigger a short squeeze, supporting the sharp upside across both altcoins.
Short squeeze triggers liquidation
The US Department of the Treasury announced on Wednesday that it will double the size of some of its buyback operations aimed at supporting liquidity in the longer-dated Treasury securities market.
Reuters reported that the Treasury will increase liquidity support buybacks for longer-dated nominal coupon securities from $2 billion to at least $4 billion per operation.
This news supported the broader crypto market, as the increased Treasury buyback operation signaled improved liquidity conditions, eased liquidity concerns and boosted risk appetite. The move also contributed to a short squeeze across the crypto market, triggering liquidations and amplifying gains in XRP and XLM.
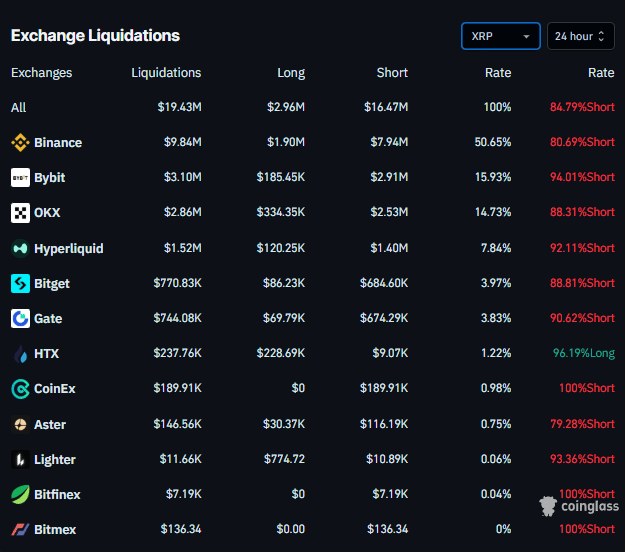
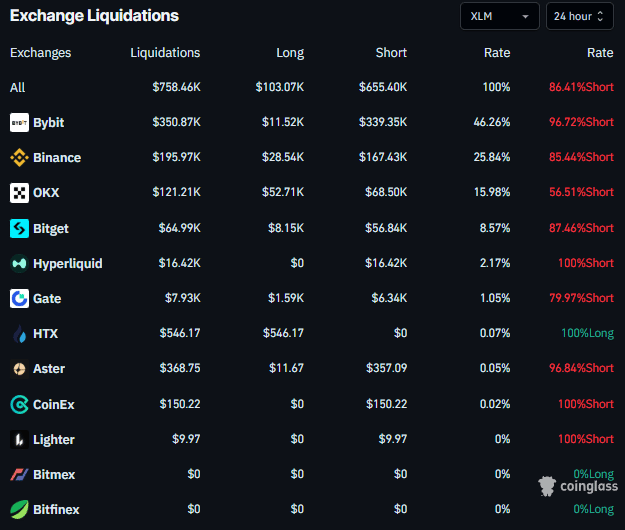
CoinGlass liquidation data shows that 172,642 traders were liquidated in the last 24 hours, totaling over $2.99 billion across the crypto market.
For XRP and XLM, over 84% and 86% of positions were long, respectively, indicating overly bullish positioning, with total liquidations of $19.43 million and $758,460.
XRP technical outlook: Closes above 50-day EMA
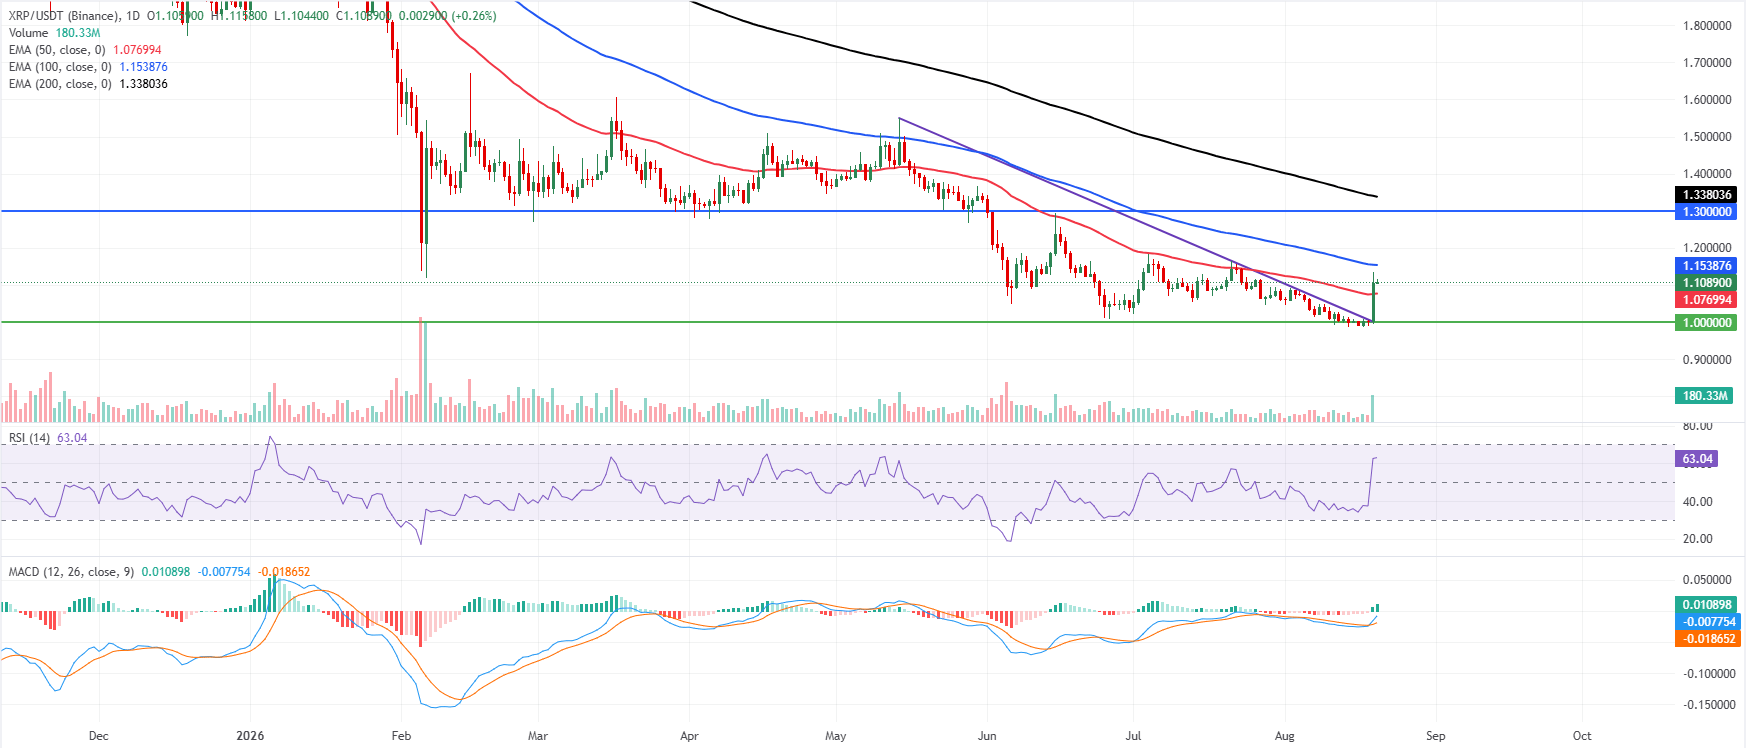
XRP price trades at $1.108 on Thursday, holding above the 50-day Exponential Moving Average (EMA) at $1.076 but still capped by the 100-day EMA at $1.153 and the longer-term 200-day EMA at $1.338 overhead.
This configuration hints at a recovery attempt within a broader capped structure, as price has reclaimed the broken downtrend resistance line around $0.995 as support.
Meanwhile, momentum improves: the Relative Strength Index (RSI) at 63 approaches overbought territory, and the Moving Average Convergence Divergence (MACD) stands above zero, suggesting strengthening bullish pressure that has yet to overcome the major moving-average barriers.
On the downside, initial support is seen at the 50-day EMA near $1.076, ahead of the horizontal floor at $1.000 and the former trendline break level at $0.995, which together define a key demand zone guarding the recent rebound.
On the topside, immediate resistance emerges at the 100-day EMA at $1.153, followed by the horizontal cap at $1.300; a sustained move above these hurdles would open the way toward the 200-day EMA at $1.338, while only a more extended advance could bring the distant structural barrier at $1.900 back into focus.
XLM technical outlook: Surges to key resistance
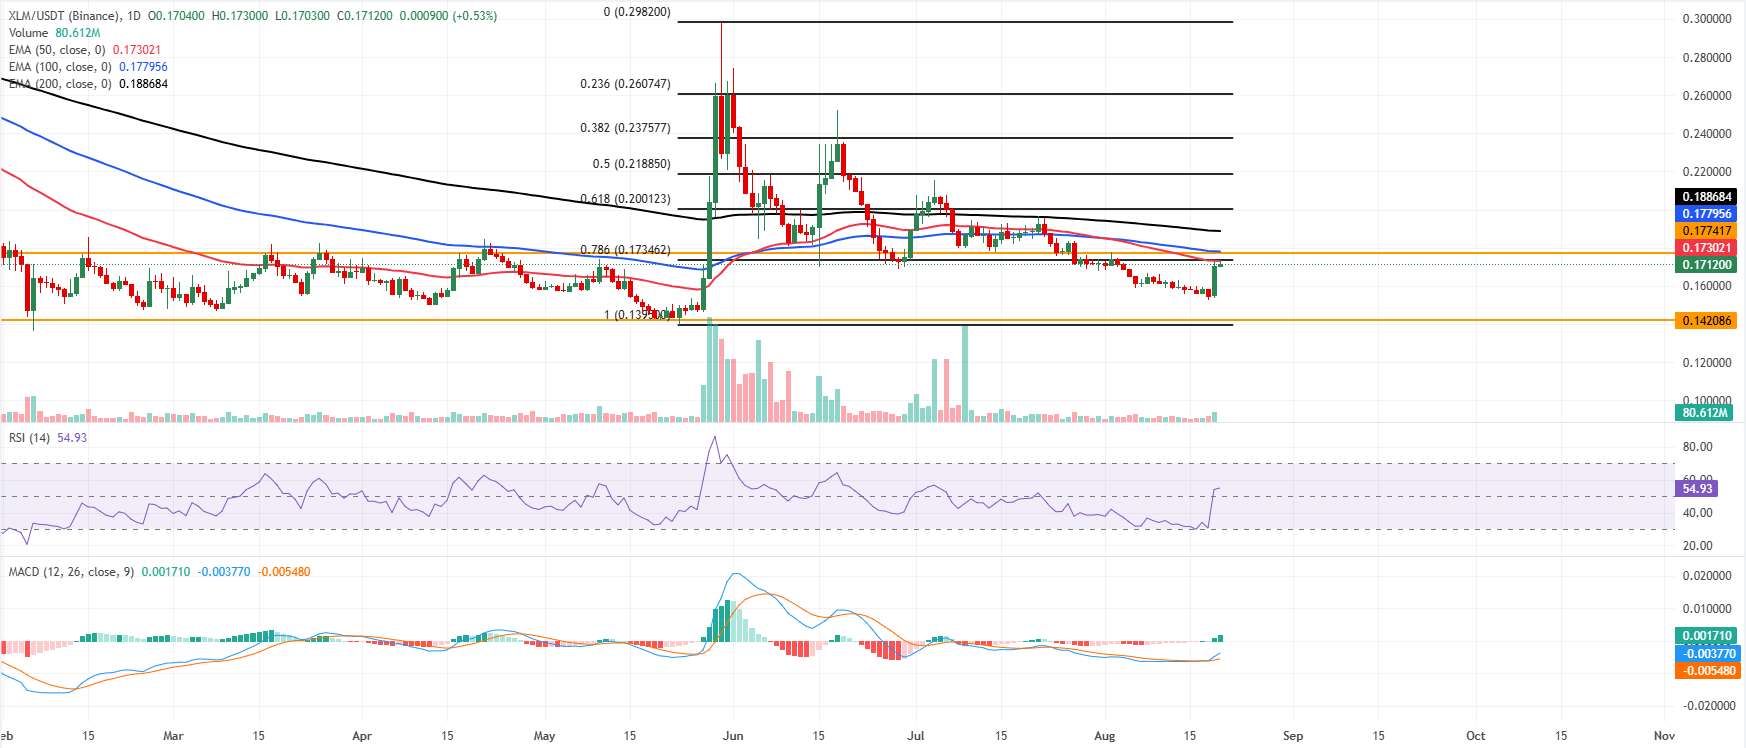
XLM price trades at $0.171 on Thursday, holding a capped tone as it remains below the short-, medium- and long-term EMAs, with the 50-day EMA at $0.173, the 100-day EMA at $0.177 and the 200-day EMA at $0.188 acting as layered overhead resistance.
Despite this bearish structural backdrop, momentum has improved, with the RSI hovering around 55 and MACD turning positive, hinting that selling pressure is easing but not yet strong enough to reclaim the nearby resistance cluster.
On the topside, initial resistance is clustered around $0.173, where the 50-day EMA converges with the 78.6% Fibonacci retracement, followed by the horizontal barrier at $0.177 and the 100-day EMA at $0.178, which together cap any immediate recovery attempts.
On the downside, the current area around $0.171 acts as a near-term pivot. At the same time, more meaningful support emerges at the horizontal level of $0.142, ahead of the broader structural floor near the cycle low at $0.139, where buyers would be expected to defend the medium-term range.
(The technical analysis of this story was written with the help of an AI tool. Know more.)
Recommended Articles


