


Cardano Price Forecast: Whale buying, derivatives metrics fuel ADA rally
- Cardano trades around $0.187 on Monday after surging over 14% and breaking above the ascending trendline last week.
- Santiment data shows that certain whale wallets are accumulating ADA tokens, signaling growing demand.
- Derivatives data also backs the bullish bias, with rising open interest and positive funding rates.
Cardano (ADA) is trading around $0.187 on Monday after surging more than 14% last week and breaking above a key ascending trendline. The price recovery is supported by signs of whale accumulation and strengthening derivatives metrics, suggesting further upside for ADA.
Whale accumulation lifts ADA
Santiment’s Supply Distribution data shows that large-wallet holders (whales) are buying ADA during its recent price dips, a move that supports the positive outlook for the token.
The metric indicates that whales holding between 1 million and 10 million ADA tokens (yellow line) and 10 million and 100 million ADA tokens (blue line) have accumulated a total of 250 million ADA tokens since July 29. This buy-the-dip scenario signals continued long-term interest among large-wallet holders and supports the price rally last week.
 [08-1785730227379.39.13, 03 Aug, 2026].png)
Bullish positioning among derivatives traders
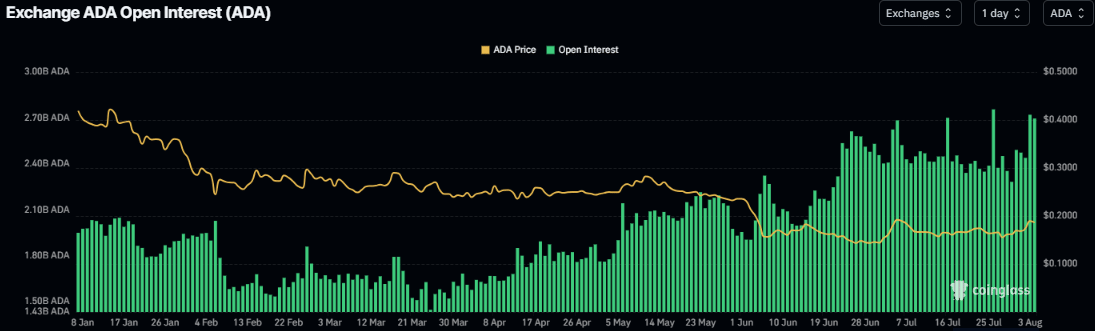
Cardano’s derivatives metrics show strengthening conditions. CoinGlass’ Open Interest (OI) across exchanges chart for ADA has been surging since July 30, with outstanding contracts reaching 2.70 billion ADA coins on Monday. The increase in OI alongside rising prices suggests that new long positions are entering the market, signaling a bullish outlook and raising the potential for further upside in ADA.
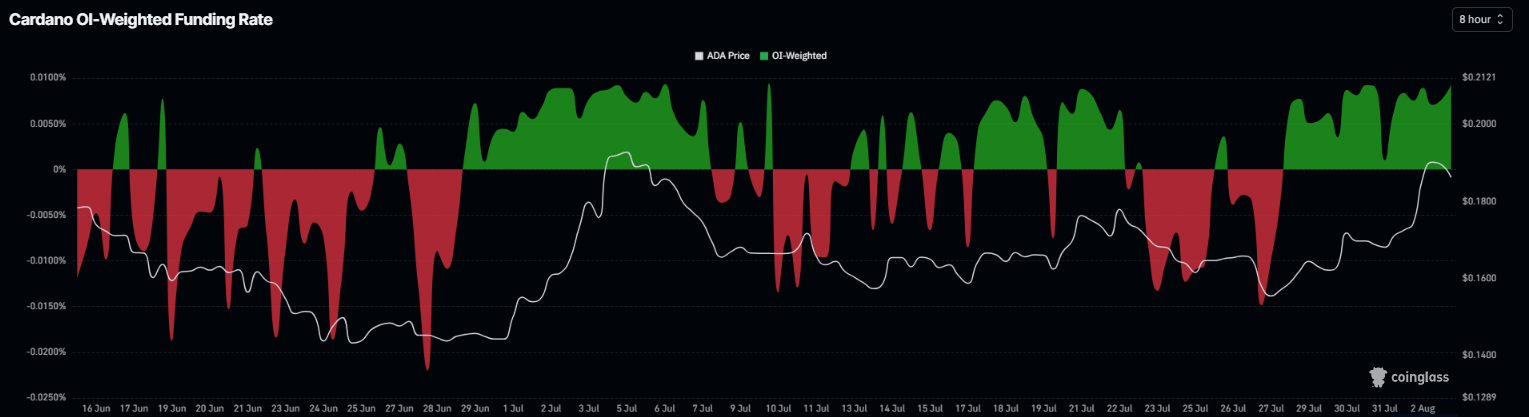
In addition, the funding rates data also shows improving sentiment. CoinGlass’ OI-Weighted Funding Rate data for ADA flipped positive on July 28 and has been rising, reading 0.0093% on Monday. This positive rate indicates that longs are paying shorts and projects a bullish sentiment.
Cardano Price Forecast: Breaks above the ascending trendline
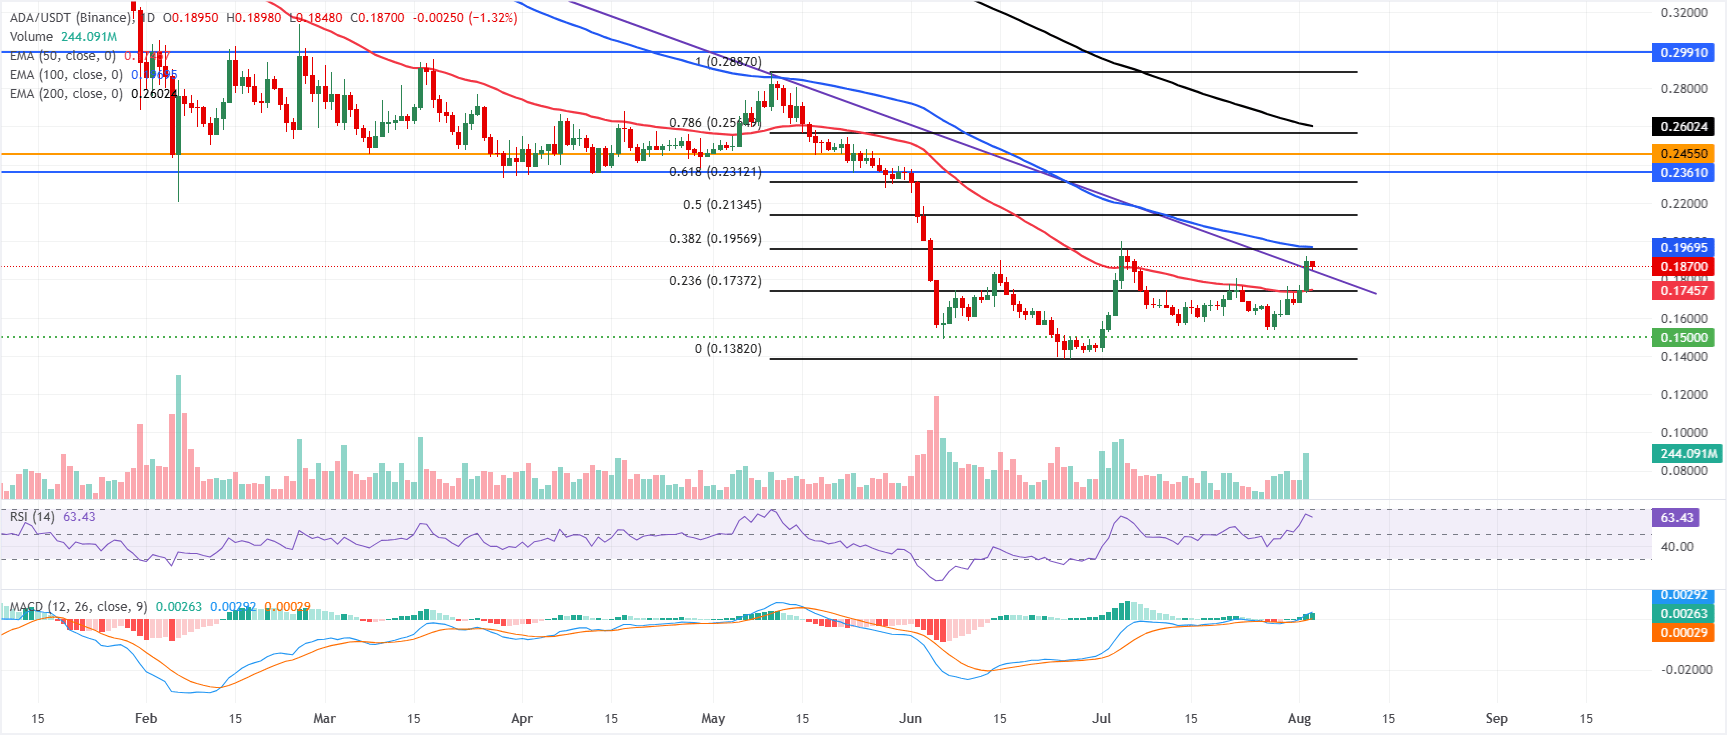
Cardano price trades at $0.187 on Monday, holds above the 50-day EMA at $0.174 and the reclaimed ascending trendline around $0.184, hinting at a tentative base forming just under $0.180. However, ADA remains capped beneath the 100-day and 200-day EMAs at $0.196 and $0.261, respectively.
The Relative Strength Index (RSI) at 63 is bullish-leaning but not overbought. At the same time, the Moving Average Convergence Divergence (MACD) shows a positive reading with a modestly constructive tone, suggesting improving momentum that has yet to overcome the broader overhead structure.
On the topside, initial resistance is seen at the 38.2% Fibonacci retracement at $0.195, closely followed by the 100-day EMA at $0.196, which together form a near-term cap before the next barrier at the 50% retracement at $0.213. Above there, additional resistance aligns at $0.231 (61.8% Fibonacci retracement), the horizontal levels at $0.236 and $0.245.
On the downside, immediate support is located around the prior trendline break at $0.184, followed by the 50-day EMA at $0.174 and the 23.6% Fibonacci retracement at $0.173; a deeper pullback would expose the horizontal floor at $0.150.
(The technical analysis of this story was written with the help of an AI tool. Know more.)
Recommended Articles


