Zcash Price Forecast: ZEC risks over 15% drawdown amid declining shielded supply

Source Fxstreet
  • Zcash is down over 2% on Friday, testing a bearish breakout of a rising support trendline.
  • Zcash adoption continues to weaken, with shielded supply down to a 10-month low of 3.79 million ZEC.
  • Retail interest in Zcash wanes, with Open Interest down over 3% and funding rates easing.

Zcash (ZEC) is trading in the red on Friday, extending a roughly 20% decline over nearly two weeks. The privacy coin is losing adoption and retail demand, with shielded ZEC supply at a 10-month low and ZEC futures Open Interest down over 3% in 24 hours. The technical outlook for ZEC is mildly bearish as bullish momentum declines. 

Declining adoption and retail support weigh on Zcash

The total supply of shielded ZEC tokens reflects the total number of tokens stored in Zcash’s cryptographic pools. Typically, an increase in shielded supply indicates more adoption, and vice versa. Zkp.baby data shows the total ZEC shielded supply is at a 10-month low of 3.79 million ZEC, reaffirming reduced demand for the privacy token. 

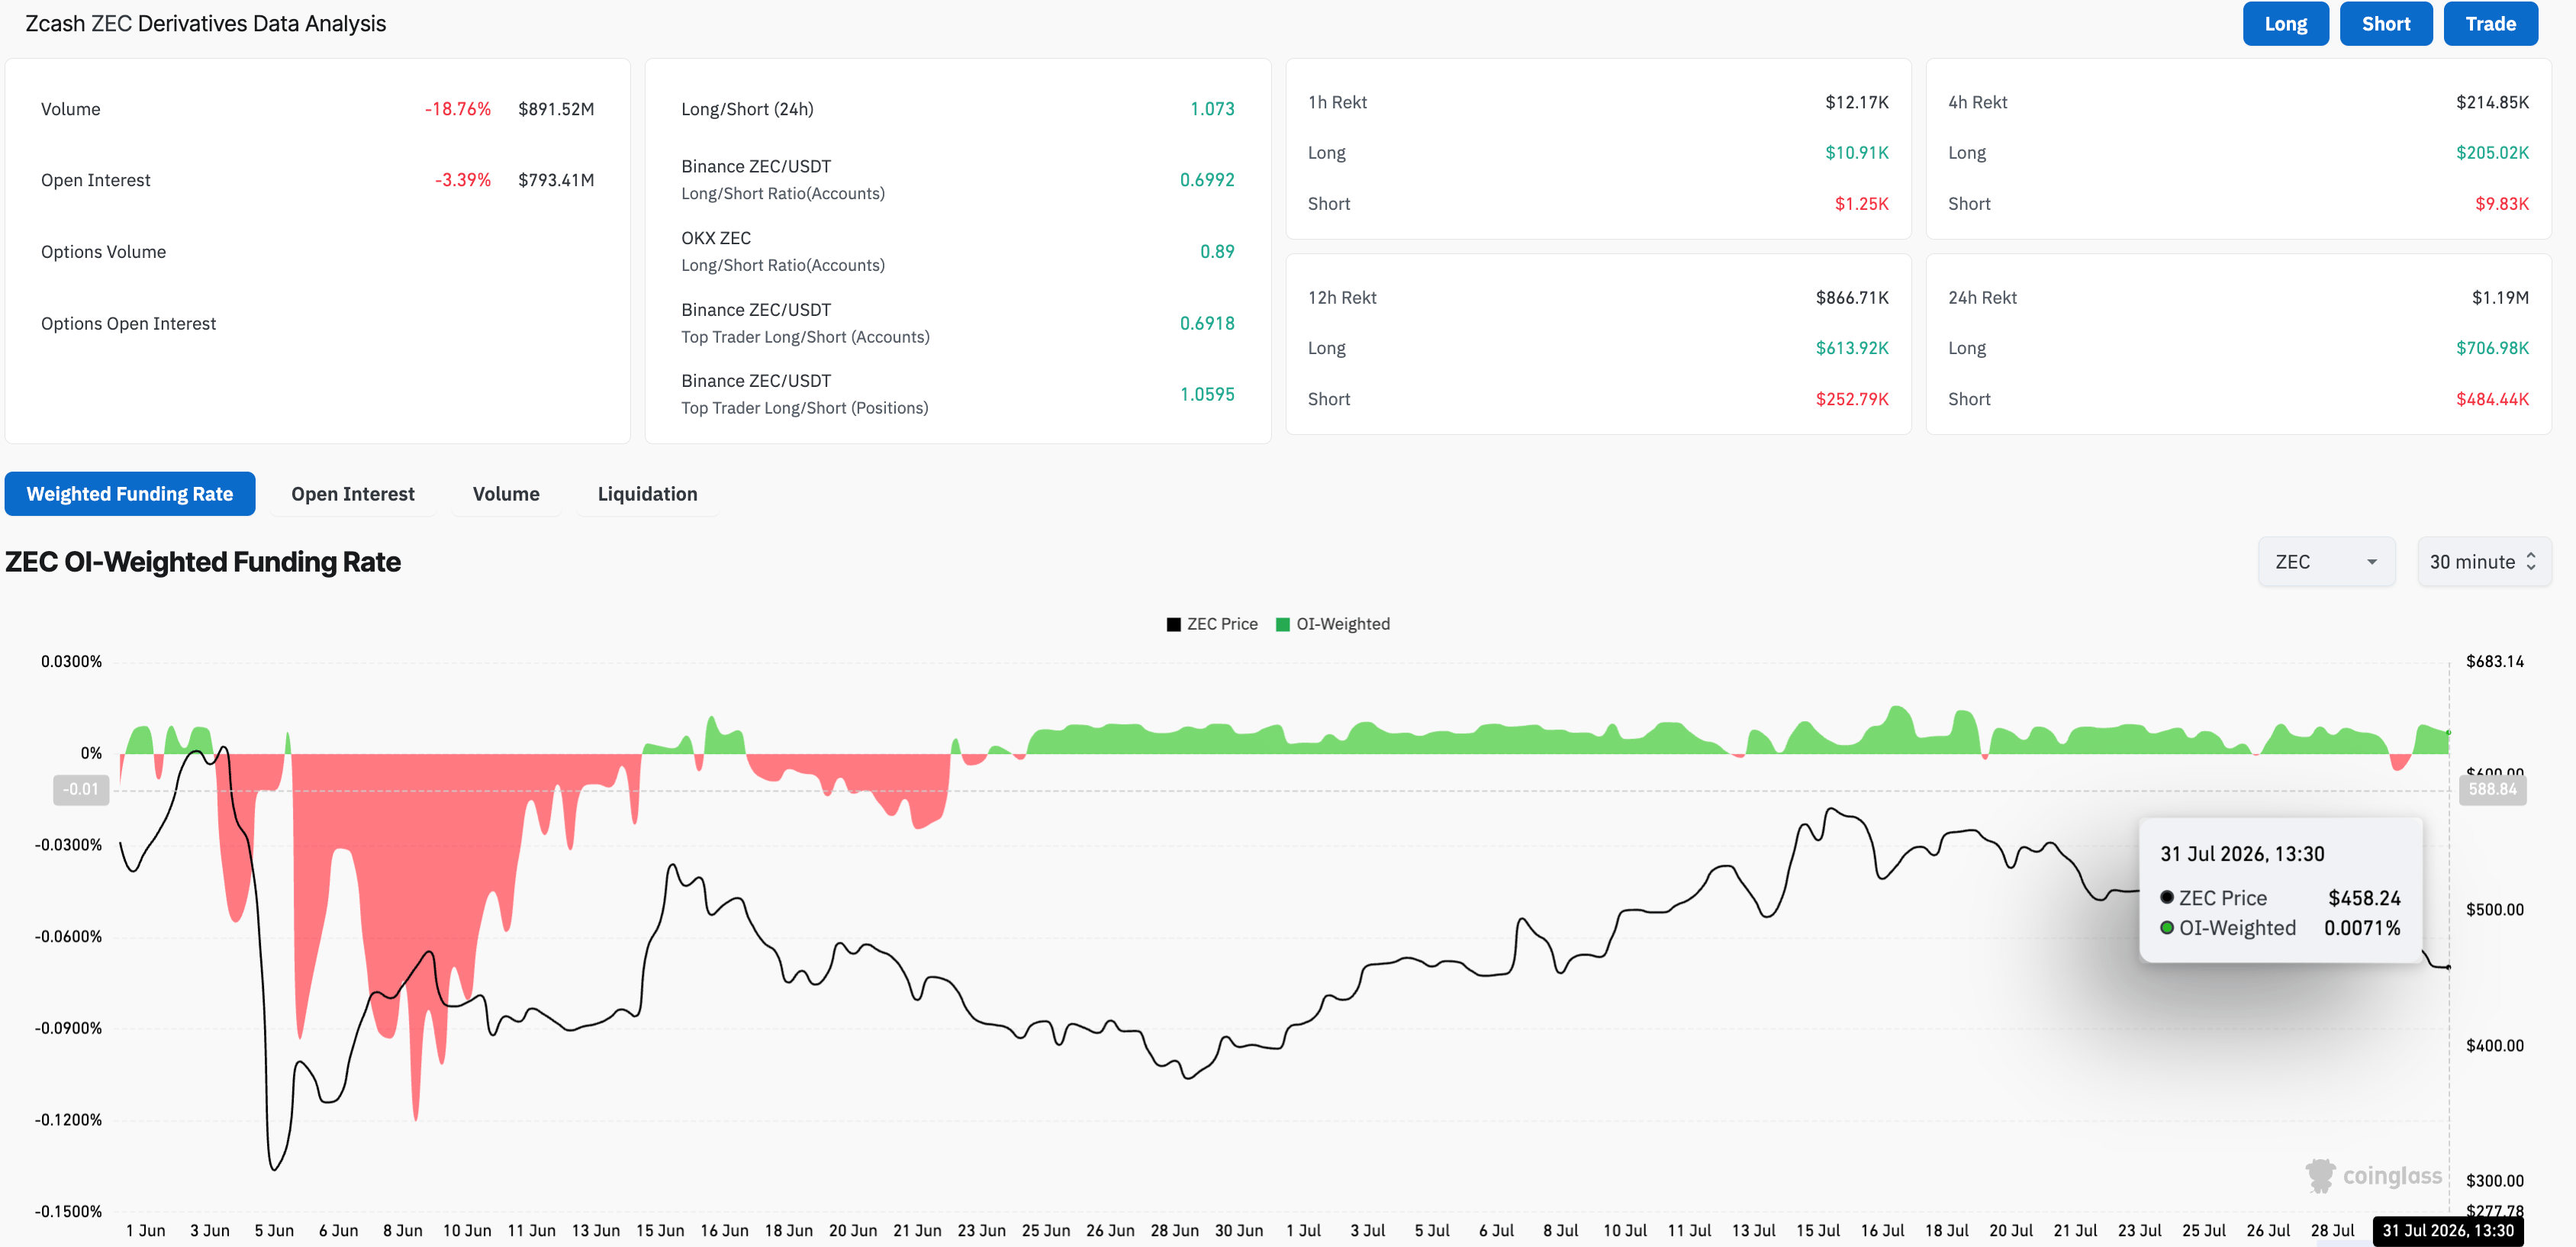
On the retail side, the speculative demand for Zcash is easing. CoinGlass data show that ZEC futures Open Interest (OI) is down over 3% in the last 24 hours to $793.41 million, indicating a minor positional wipeout or a reduction in notional value as the ZEC price declines. Meanwhile, the funding rate has dropped to 0.0071% from 0.0091% the previous day, implying reduced demand for long positions. 
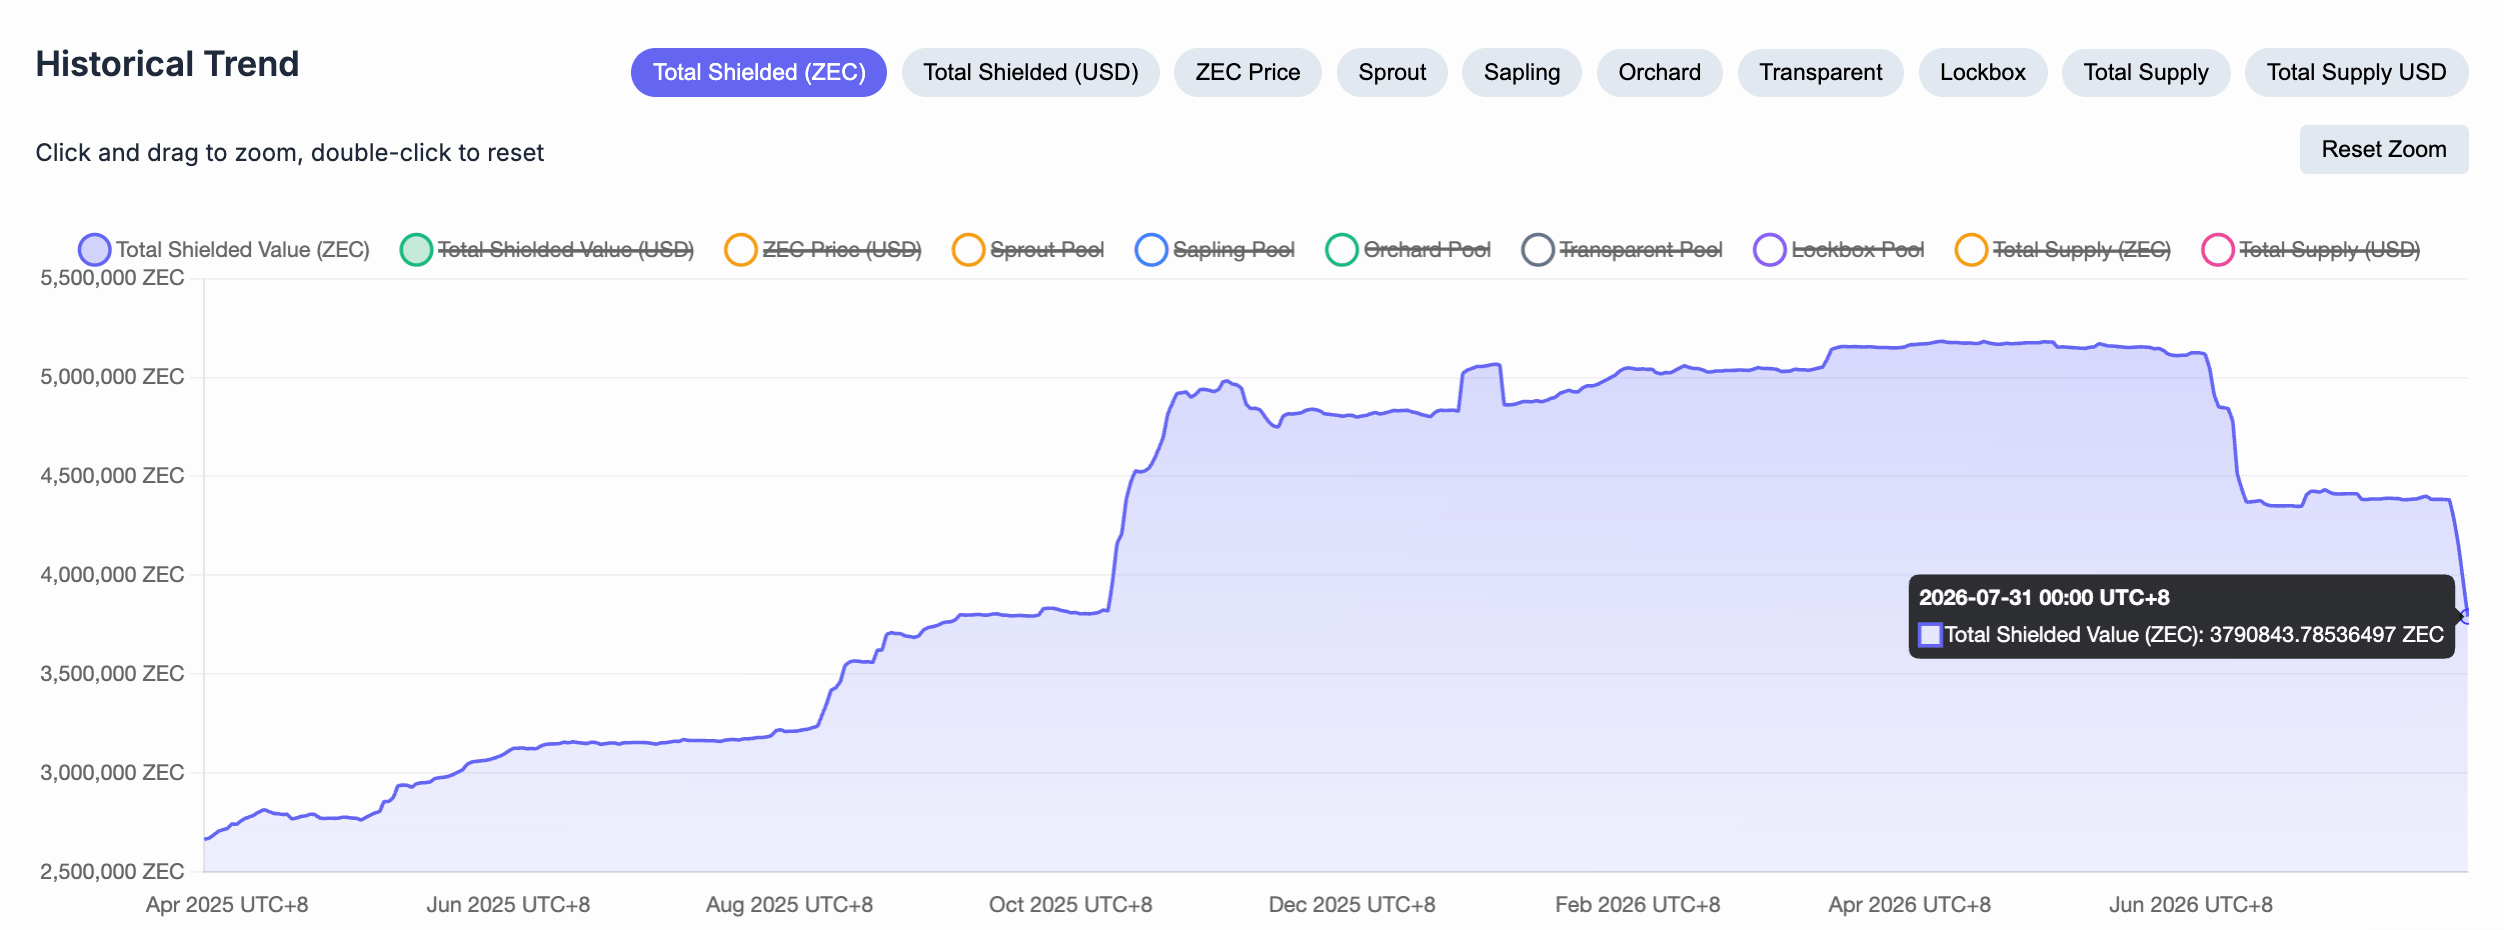
Total ZEC shielded value chart. Source: Zkp.baby
Zcash derivatives data. Source: CoinGlass

Technical outlook: Will Zcash break below its support trendline?

Zcash maintains a near-term bearish tone, trading below the 50-day Exponential Moving Average (EMA) at around $485 and testing a rising support trendline near $458. From a technical perspective, a sustained close below this zone could target the 200-day EMA at $404, followed by the 50% retracement level of the upswing from $207 to 690, at $378.

The Moving Average Convergence Divergence (MACD) descends into negative territory after a bearish crossover with its signal line as selling pressure resurfaces. At the same time, the Relative Strength Index (RSI) is hovering near 42, both suggesting weak momentum and limited buying conviction.

Chart Analysis ZEC/USDT (Binance)
ZEC/USDT daily price chart.

On the topside, initial resistance emerges near the 50-day EMA at $485 and the descending trendline near $561.

(The technical analysis of this story was written with the help of an AI tool. Know more.)

Disclaimer: For information purposes only. Past performance is not indicative of future results.
placeholder
Markets in 2026: Will gold, Bitcoin, and the U.S. dollar make history again? — These are how leading institutions thinkAfter a turbulent 2025, what lies ahead for commodities, forex, and cryptocurrency markets in 2026?
Author  Insights
Dec 25, 2025
After a turbulent 2025, what lies ahead for commodities, forex, and cryptocurrency markets in 2026?
placeholder
My Top 5 Stock Market Predictions for 2026Five 2026 market predictions written in a native, news-style voice: AI’s winners and losers, broader sector leadership, dividend demand, valuation cooling as the Shiller CAPE sits at 39 (Dec. 31, 2025), and quantum-computing bursts—while keeping all original facts and numbers unchanged.
Author  Mitrade
Jan 06, Tue
Five 2026 market predictions written in a native, news-style voice: AI’s winners and losers, broader sector leadership, dividend demand, valuation cooling as the Shiller CAPE sits at 39 (Dec. 31, 2025), and quantum-computing bursts—while keeping all original facts and numbers unchanged.
placeholder
Gold Price Forecast: XAU/USD keeps looking for direction above $4,500Gold (XAU/USD) trades lower for the second consecutive day on Friday, but remains contained within previous ranges, with downside attempts limited above the $4,500 line for now.
Author  FXStreet
May 22, Fri
Gold (XAU/USD) trades lower for the second consecutive day on Friday, but remains contained within previous ranges, with downside attempts limited above the $4,500 line for now.
placeholder
Gold Price Forecast: Can Gold Hold $4,020 as Fed Rate Hike Expectations Rise? As of the Asian session on July 30, gold prices ( XAUUSD) surged and then retraced following the Federal Reserve meeting, once falling to $4,028.62 during the session. From a market persp
Author  TradingKey
Yesterday 08: 48
As of the Asian session on July 30, gold prices ( XAUUSD) surged and then retraced following the Federal Reserve meeting, once falling to $4,028.62 during the session. From a market persp
placeholder
WTI holds losses around $82.50 on renewed US-Iran diplomatic hopesWest Texas Intermediate (WTI) oil price remains in the negative territory for the second successive day, trading around $82.60 per barrel during the Asian hours on Friday. Crude oil prices have lost ground following renewed hopes for a diplomatic solution to the US-Iran conflict.
Author  FXStreet
9 hours ago
West Texas Intermediate (WTI) oil price remains in the negative territory for the second successive day, trading around $82.60 per barrel during the Asian hours on Friday. Crude oil prices have lost ground following renewed hopes for a diplomatic solution to the US-Iran conflict.
goTop
quote