


Bitcoin at $65K vs. October’s $126K All-Time High: Is a 50% Drawdown a Buy Signal in 2026?
TradingKey - Bitcoin investors have had a lot to deal with in 2026. Coming under pressure from the U.S. vs Iran crisis early this year, Bitcoin price suffered its first major crash in 2026. In addition, capital rotation from Bitcoin ETFs into AI stocks put BTC price under even more pressure.
Right now, Bitcoin’s price is trading right around $65,000, around 50% lower than what it exchanged hands at in October 2025, when it hit its all-time high of $126,000. While it’s not normal for other assets to see this rapid drop in a short period, if you’ve been in the crypto space for a while, it won’t be strange.
However, being down 50% from its ATH has led investors to ask the big question. Is this 50% drop a warning to stay away, or is it the ultimate buy signal of 2026? We’ve studied Bitcoin market structure via long-term cycle data, whale holder activity purchases, and more to figure out if the ultimate buy signal is in already. Here’s what we found out.
Why the 50% Drawdown Was Necessary
When Bitcoin price skyrocketed to $126,000 last October, the market was very high on leverage. Every day retail buyers jumped in late and futures traders borrowed heavily to chase the Bitcoin price hype. That kind of growth is never sustainable. It creates a fragile foundation.
After Bitcoin peaked in October last year, it has steadily dropped, briefly reaching lows of $58,000. A 50% correction acts like a violent deleveraging of the Bitcoin market. It forces out weak hands, liquidates over-leveraged accounts, and transfers coins from panicked short-term speculators to patient long-term believers.
Historically, buying Bitcoin during a major mid-cycle correction has been one of the most profitable moves an investor could make. It feels terrifying at the moment, but the macro math usually checks out.
What the Options Market is Telling Us
While the mainstream media focuses entirely on the spot price drop, the smart money is watching the derivatives market. Recent data reveals that behind-the-scenes sentiment is shifting fast.
Bitcoin’s options market is quietly flashing bullish signals despite the sideways price action at $65,700. First, look at implied volatility. Glassnode’s DVOL index, which measures how much traders expect prices to swing, has dropped from 48 down to 40 over the last few weeks.
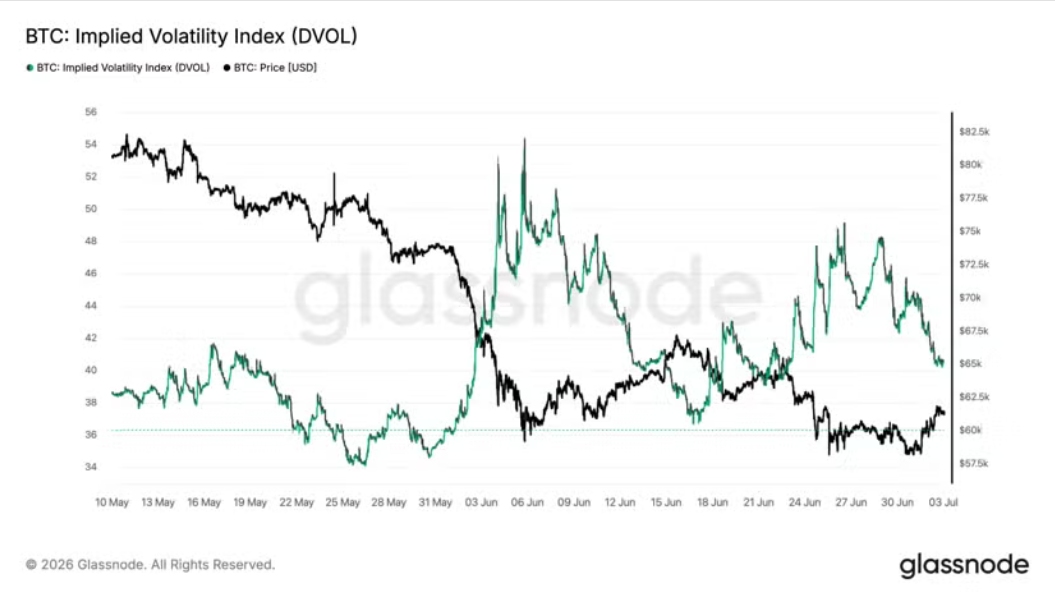
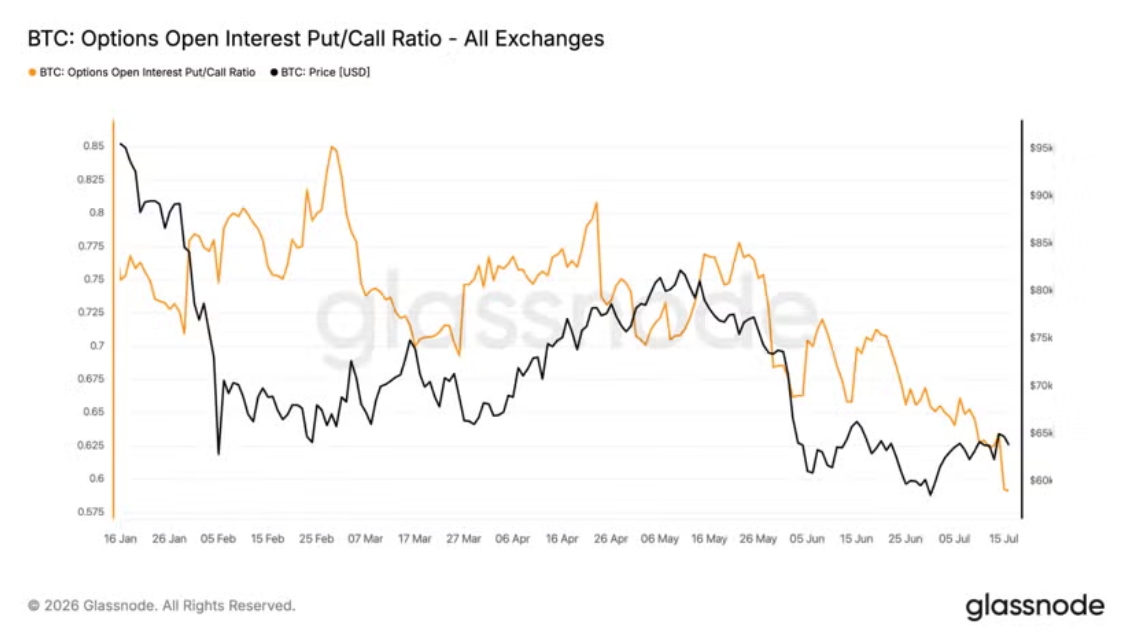
This drop tells us that the raw panic we saw in June is unwinding. Traders are no longer expecting chaotic, erratic crashes. They are calming down. Even more telling is the put/call ratio. This metric compares the number of traders betting on a price drop (puts) against those betting on a rally (calls).
Right now, the put/call ratio has plunged to its lowest level in six months, per Glassnode data. In plain English, big traders are taking off their hedges. They have stopped buying insurance against a market crash. They are getting comfortable.
What Historical Data is Telling Us
The story from Bitcoin’s history is not very much different from what the options market is saying. Analysts like Danny have pointed out that Bitcoin repeats a predictable cycle of 1,064 days up days followed by 365 days down days.
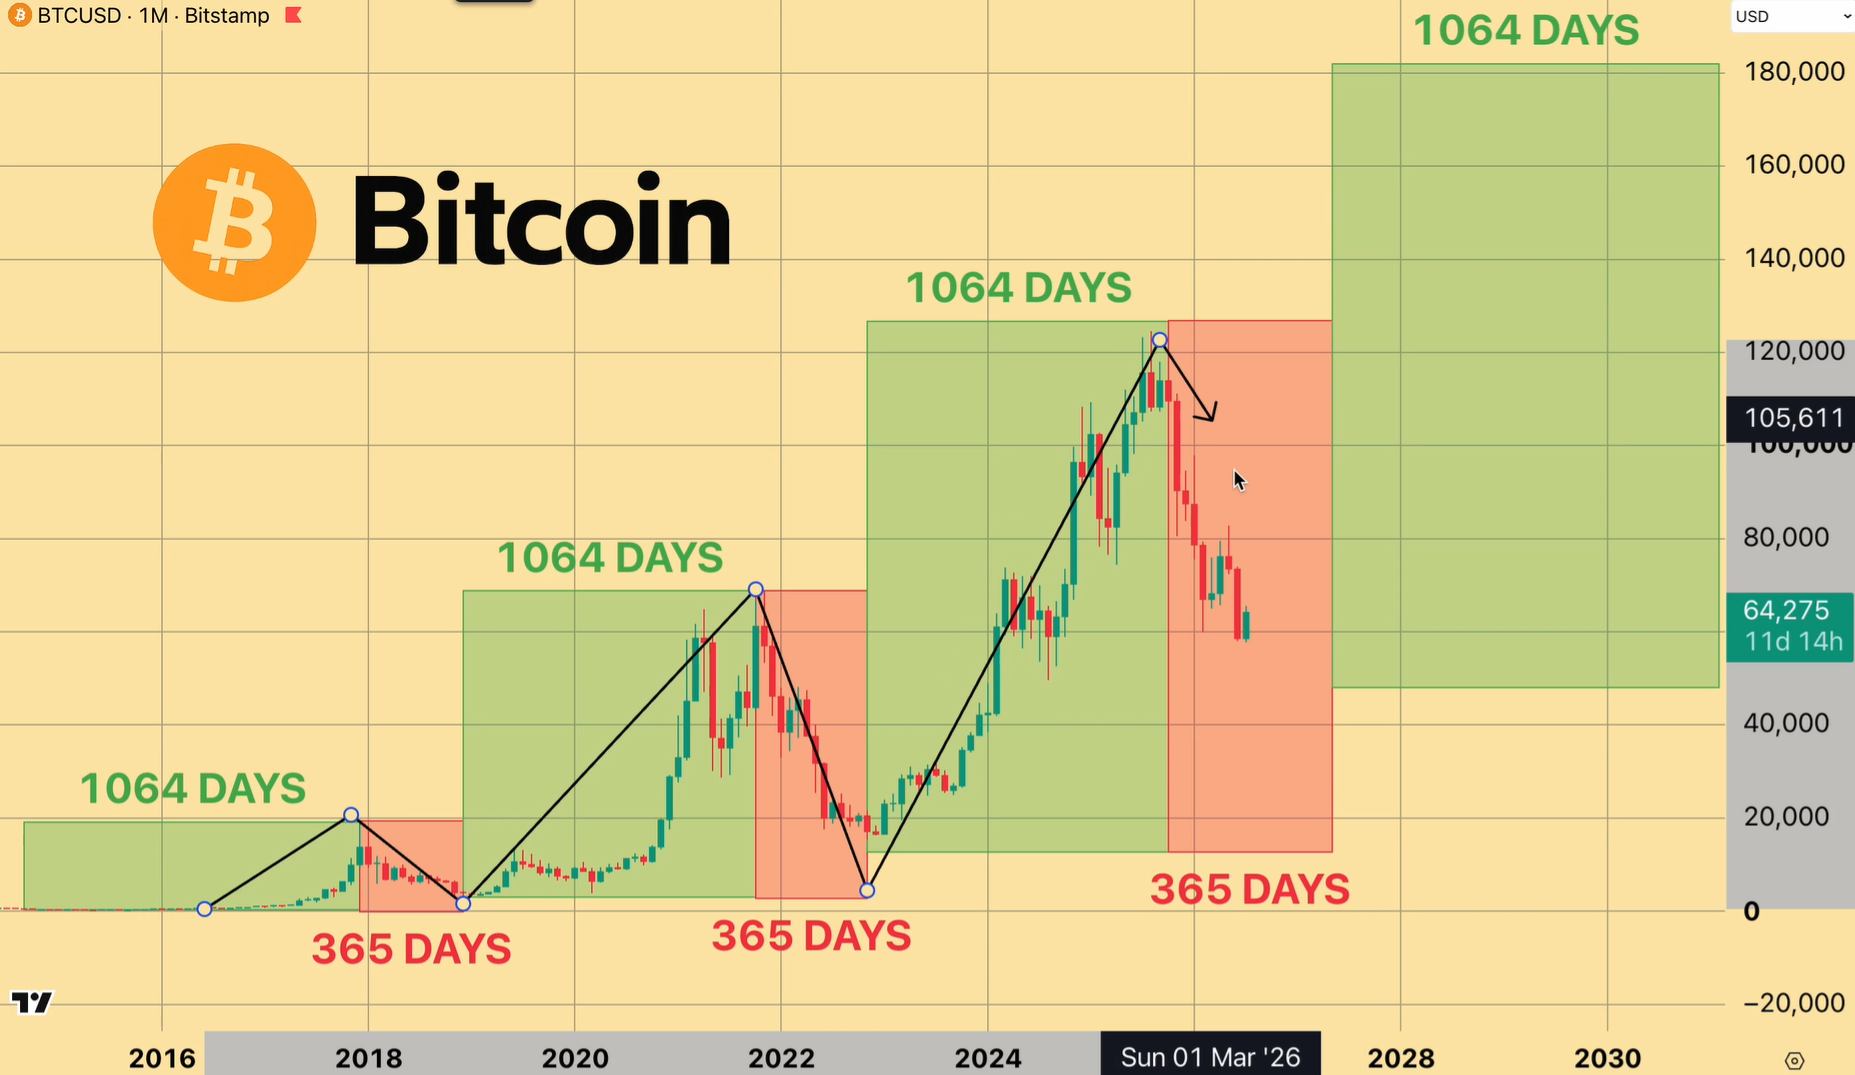
While there are variations in the number of bull/bear days, all the analysts point to Bitcoin price following a similar cycle. Crypto Rover shares an alternative version where Bitcoin always drops into the 0.618–0.786 Fib zone before finding a major bottom for the next bull run.
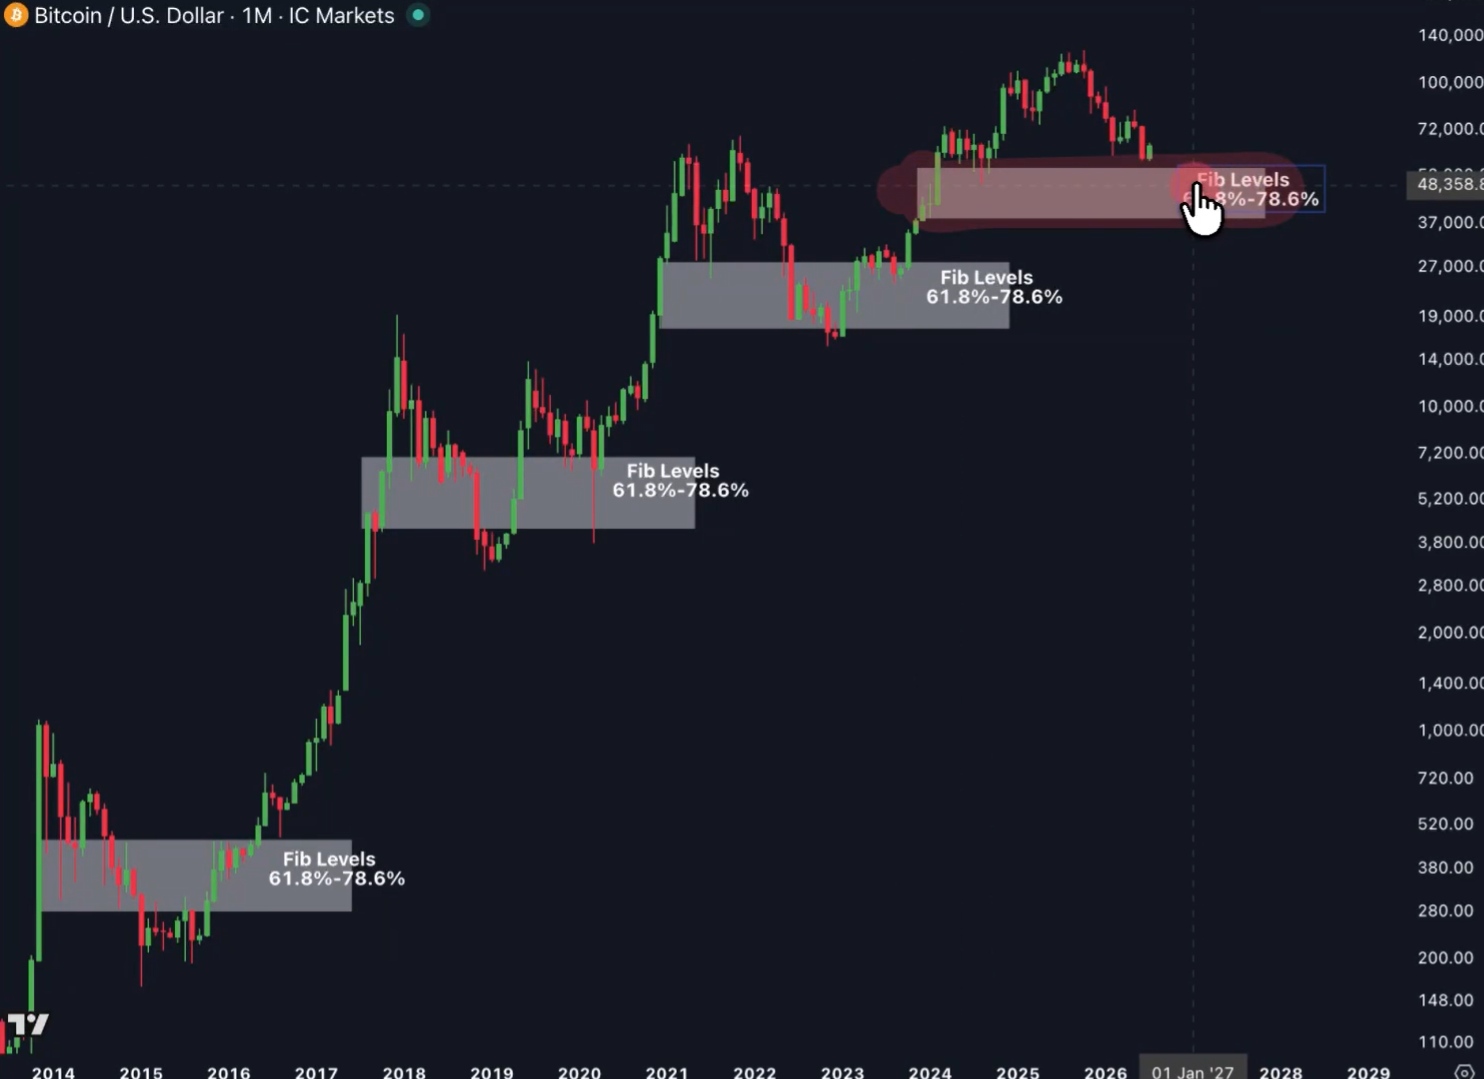
Based on these historical patterns Bitcoin has followed for more than a decade, we can tell that the bottom is yet to come in. Bitcoin price is sitting just above the 0.618–0.786 Fib level and has roughly 100 days left in this bear market. What this means is that we could see the BTC price retrace more and consolidate as we draw close to the end of the bear market.
The Verdict: Buy Signal or Trap?
So, is a 50% drawdown a buy signal in 2026? Nothing in crypto is a guaranteed bet, but the risk-to-reward ratio right now leans heavily in favor of buyers. However, historical market performances show that there are still around three months before the current bear market is over.
So, while Bitcoin investors have suffered a 50% drop in their investments, they’ll need to wait for another period of pain as BTC price look to complete the bear market. However, when the bottom is finally confirmed, historical trends suggest that Bitcoin price could surge to a new all-time high above $180,000.
Recommended Articles


