

Polkadot price prediction 2026-2032: Will DOT recapture $20 soon?
Key takeaways
- In 2026, Polkadot might reach a maximum price value of $2.01 and an average value of $1.73.
- In 2029, the DOT price is expected to range from a maximum of $6.32 to a minimum of $5.16.
- The price of Polkadot is predicted to reach a maximum value of $18.44 in 2032.
Polkadot (DOT) is a next-generation blockchain network designed to connect and secure multiple blockchains, enabling them to share data and operate together seamlessly.
Created by Ethereum co-founder Gavin Wood, Polkadot aims to solve key issues such as scalability, interoperability, and security through its unique multi-chain architecture.
The network’s central relay chain coordinates specialized blockchains known as parachains, allowing transactions to be processed in parallel for greater efficiency.
DOT, the native token, is used for network governance, staking to secure the ecosystem, and bonding to add new parachains, making it a core component of Polkadot’s growing Web3 infrastructure.
Will DOT reach new heights soon? Let’s get into the Polkadot price prediction for 2026-2032.
Overview
| Cryptocurrency | Polkadot |
| Token | DOT |
| Price | $1.31 |
| Market Cap | $2.203B |
| Trading Volume | $181.53M |
| Circulating Supply | 1.682B DOT |
| All-time High | $55.00 Nov 4, 2021 |
| All-time Low | $1.15 Feb 06, 2026 |
| 24-hour High | $1.33 |
| 24-hour Low | $1.27 |
Polkadot price prediction: Technical analysis
| Volatility | 2.98% (Medium) |
| 50-Day SMA | $1.30 |
| 14-Day RSI | 53.85 (Neutral) |
| Market Sentiment | Neutral |
| Fear & Greed Index | 46 (Fear) |
| Green Days | 13/30 (43%) |
| 200-Day SMA | $1.87 |
Polkadot price analysis
- DOT broke above the key $1.25 resistance and rallied toward $1.31–$1.33.
- The 4-hour chart shows strong bullish momentum with higher highs and higher lows.
- A breakout above $1.33 could push DOT toward $1.36–$1.40.
Polkadot daily price chart
As of May 6, Polkadot has shifted bullish after breaking above the key $1.25 resistance zone and pushing toward $1.31–$1.33.
The daily chart shows DOT gaining roughly 10% from the recent local bottom near $1.19, while price action is now trading above the 20-day SMA and approaching the upper Bollinger Band resistance around $1.32.
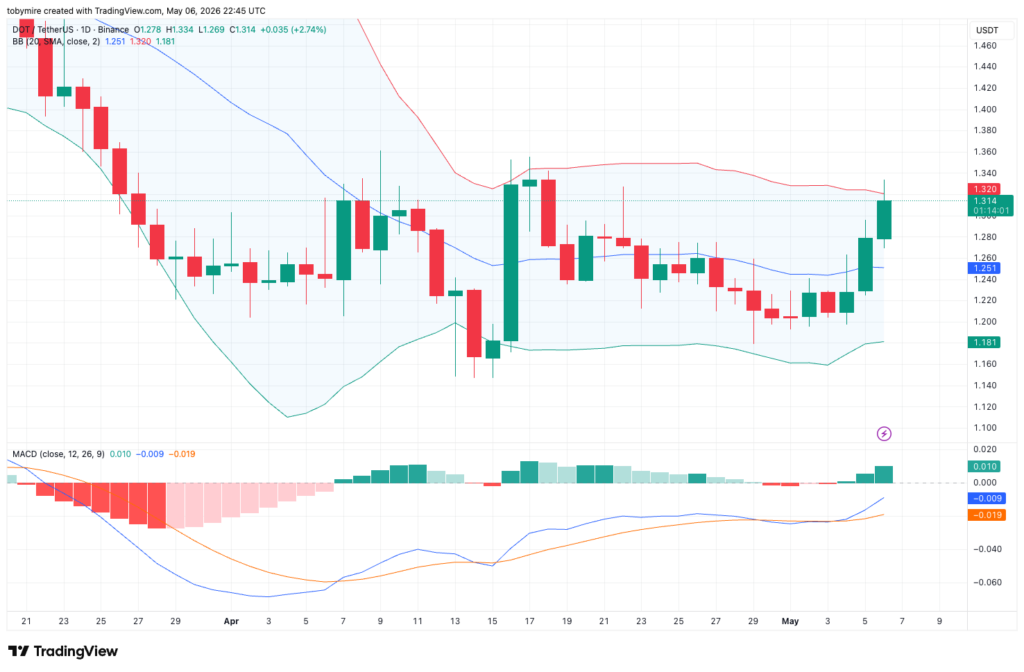
The MACD has crossed bullish again, with histogram bars turning positive, signaling strengthening momentum after weeks of sideways consolidation.
The current structure favors continuation as long as DOT holds above $1.28. A successful breakout above $1.33 could pave the way for $1.38–$1.40 in the short term. However, rejection near the upper Bollinger Band may trigger a temporary cooldown toward the $1.25 support area before another move higher.
Polkadot 4-hour price chart
The 4-hour chart confirms aggressive bullish momentum, with DOT forming consecutive higher highs and higher lows while trading above all major Alligator moving averages. DOT recently rallied from around $1.20 to above $1.31, representing a gain of nearly 9% in a short period.
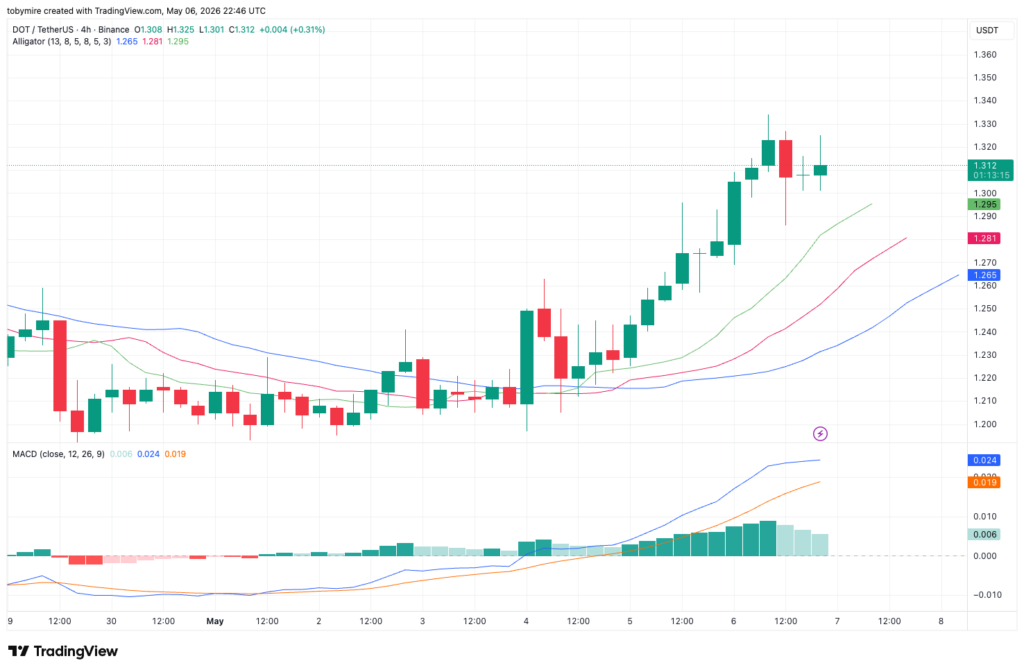
MACD remains strongly positive, although histogram momentum is beginning to slow slightly after the latest surge, suggesting a possible short-term consolidation.
As long as DOT remains above $1.29–$1.30, buyers still control the trend. A breakout above $1.33 could accelerate upside momentum toward $1.36 next.
On the downside, losing $1.28 would weaken the short-term bullish structure and increase the probability of a retracement toward $1.25.
Polkadot technical indicators: Levels and action
Daily simple moving average (SMA)
| Period | Value | Action |
|---|---|---|
| SMA 3 | $1.24 | BUY |
| SMA 5 | $1.23 | BUY |
| SMA 10 | $1.23 | BUY |
| SMA 21 | $1.25 | BUY |
| SMA 50 | $1.30 | BUY |
| SMA 100 | $1.38 | SELL |
| SMA 200 | $1.87 | SELL |
Daily exponential moving average (EMA)
| Period | Value | Action |
|---|---|---|
| EMA 3 | $1.25 | BUY |
| EMA 5 | $1.24 | BUY |
| EMA 10 | $1.24 | BUY |
| EMA 21 | $1.25 | BUY |
| EMA 50 | $1.30 | BUY |
| EMA 100 | $1.48 | SELL |
| EMA 200 | $1.92 | SELL |
What can you expect next for Polkadot (DOT)?
DOT is showing renewed bullish strength after reclaiming key resistance levels, with both the daily and 4-hour charts favoring continuation higher.
Momentum remains positive, but short-term consolidation may occur before the next breakout attempt.
Is Polkadot a good investment?
Polkadot (DOT) shows cautious short-term price behavior, trading in a tight range between $1.25 and $1.30. For investors, this range-bound movement suggests monitoring price action carefully before committing, as the market is currently indecisive.
Long-term potential depends on Polkadot’s continued network development, adoption, and overall crypto market conditions. Traders seeking short-term gains should wait for a clear breakout above resistance or breakdown below support, while long-term investors may consider DOT’s technology and ecosystem growth as part of their evaluation.
Why is Polkadot Down today?
Polkadot (DOT) is down today, trading at $1.27, largely due to cautious market sentiment and short-term profit-taking. Traders are closely watching the $1.25 support level, and minor selling pressure has contributed to the 1.77% decline.
Broader crypto market volatility and consolidation in major tokens also weigh on DOT’s price. Investors remain hesitant as the market navigates a tight range between $1.25 and $1.30, reflecting uncertainty before a potential breakout or further dip.
Will Polkadot reach $10?
Yes, according to long-term predictions, Polkadot is projected to reach up to $10 by 2031.
Will Polkadot reach $15?
Yes, according to the long-term predictions, Polkadot is projected to reach up to $15 by 2032.
Will Polkadot reach $100?
Reaching $100 for Polkadot (DOT) is highly ambitious and unlikely in the near term.
Does Polkadot have a promising long-term future?
Based on Polkadot’s ongoing buying demand and positive community support, the DOT price is set to make new highs in the coming years. However, you are advised to do your research before investing in the volatile market, especially considering future performance.
Recent news/opinion on Polkadot
- Polkadot has introduced Bulletin Chain, a decentralized data storage model designed to help everyday Web3 apps run without relying on centralized Web2 servers.
Polkadot price prediction May 2026
For May, Polkadot is expected to trade between $1.18 and $ 1.26, with an average around $1.26. On the higher end, DOT could reach up to $1.48.
| Month | Potential Low | Potential Average | Potential High |
| May | $1.18 | $1.26 | $1.48 |
Polkadot price prediction 2026
The DOT price prediction for 2026 anticipates a minimum value of $1.15 and a maximum value of $2.01. The token price and the coin’s average value could be around $1.73.
| Polkadot Price Prediction | Potential Low | Potential Average | Potential High |
| 2026 | $1.15 | $1.73 | $2.01 |
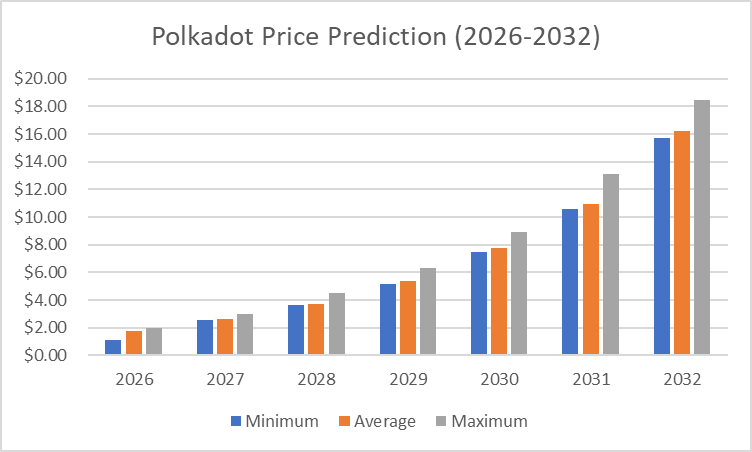
Polkadot Price Predictions 2027-2032
| Year | Minimum Price | Average Price | Maximum Price |
| 2027 | $2.56 | $2.63 | $3.01 |
| 2028 | $3.65 | $3.75 | $4.51 |
| 2029 | $5.16 | $5.35 | $6.32 |
| 2030 | $7.50 | $7.77 | $8.93 |
| 2031 | $10.57 | $10.96 | $13.13 |
| 2032 | $15.69 | $16.24 | $18.44 |
Polkadot price prediction 2027
According to the Polkadot prediction for 2027, DOT could reach a maximum price of $3.01, with the lowest price expected to be $2.56, and an average forecast price of $2.63.
Polkadot price prediction 2028
The price of Polkadot is predicted to reach a minimum value of $3.65 in 2028. Per expert analysis, DOT tokens could reach a maximum value of $4.51 and an average trading price of $3.75.
Polkadot price prediction 2029
In 2029, the Polkadot coin could reach a minimum price level of $5.16, a maximum price of $6.32, and an average trading price of $5.35.
Polkadot forecast 2030
The price of Polkadot is predicted to reach a minimum value of $7.50 in 2030. Traders can anticipate a maximum value of $8.93 while monitoring key support levels and an average trading price of $7.77.
Polkadot price prediction 2031
According to the Polkadot price prediction for 2031, DOT could reach a maximum price of $13.13, a minimum price of $10.57, and an average forecast price of $10.96.
Polkadot price prediction 2032
In 2032, Polkadot’s price is predicted to reach a minimum level of $15.69. Should positive market sentiment persist, DOT can attain a maximum cost of $18.44 and an average trading price of $16.24.
Polkadot market price prediction: Analysts’ DOT price forecast
| Firm | 2026 | 2027 |
| DigitalCoinPrice | $1.55 | $0.77 |
| Coincodex | $1.32 | $1.34 |
Cryptopolitan’s Polkadot (DOT) Price Prediction
For 2026, Polkadot is expected to trade between $1.15 and $2.01, with an average price near $1.73. Continued network growth and adoption could support gradual gains. By 2032, DOT could reach up to $18.44.
Polkadot historic price sentiment
- After spending most of late 2020 around $4–$5, Polkadot broke above its previous $7 high on December 29 and quickly reached $10.
- Polkadot saw rapid growth in 2021, rising from around $3 in January to an all-time high near $57.50 in May before dropping to about $10 in July and later recovering above $40 in November.
- In 2022, DOT entered a steep decline, falling from around $30 at the start of the year to below $10 by mid-year and stabilizing near $5 by year-end.
- Through 2023 and early 2024, DOT mostly consolidated between $5 and $7, before briefly recovering toward $10.40 in December 2024.
- In 2025, DOT weakened again, falling from a January high of $7.98 to around $4.30 in March, then drifting below $4 through April and May. By June, it dropped toward $3.30, briefly stabilized near $4.00–$4.30 from August to October, then fell to around $2.10 by late November and early December.
- In 2026, DOT remained under pressure, trading between $1.66 and $2.33 in January, $1.15 and $1.74 in February, $1.23 and $1.65 in March, and $1.22 to $1.27 in April. As of May 2026, DOT is trading around an average price of approximately $1.31.
Recommended Articles


