

A 13% Bounce Is All BMNR Stock Got Last Time: Can This Bullish Attempt Do Better?
BMNR stock price trades at $22.34, up 4% on the day. A bullish RSI divergence has flashed for the second time in a week and options positioning has shifted toward calls.
Yet Bitmine’s institutional interest remains pinned near zero. Institutional capital is not following the momentum. The last time this divergence appeared, it delivered just a 13% bounce before fading. A head-and-shoulders pattern on the daily chart adds a 23% downside risk if the current move fails.
A Bullish Divergence Flashes Again but the Last One Only Gave 13%
BMNR stock price has been declining since peaking in early January. However, the Relative Strength Index (RSI), a momentum indicator that measures the speed and size of recent price moves, is showing signs of a potential reversal.
Between December 31 and April 9, price made a lower low while the RSI made a higher low. That formed a standard bullish divergence, a signal that selling pressure is weakening. However, that divergence only led to a 13% price rise before the rally stalled.
A similar signal has now flashed between December 31 and April 14. Price again made a lower low while the RSI printed a higher low.
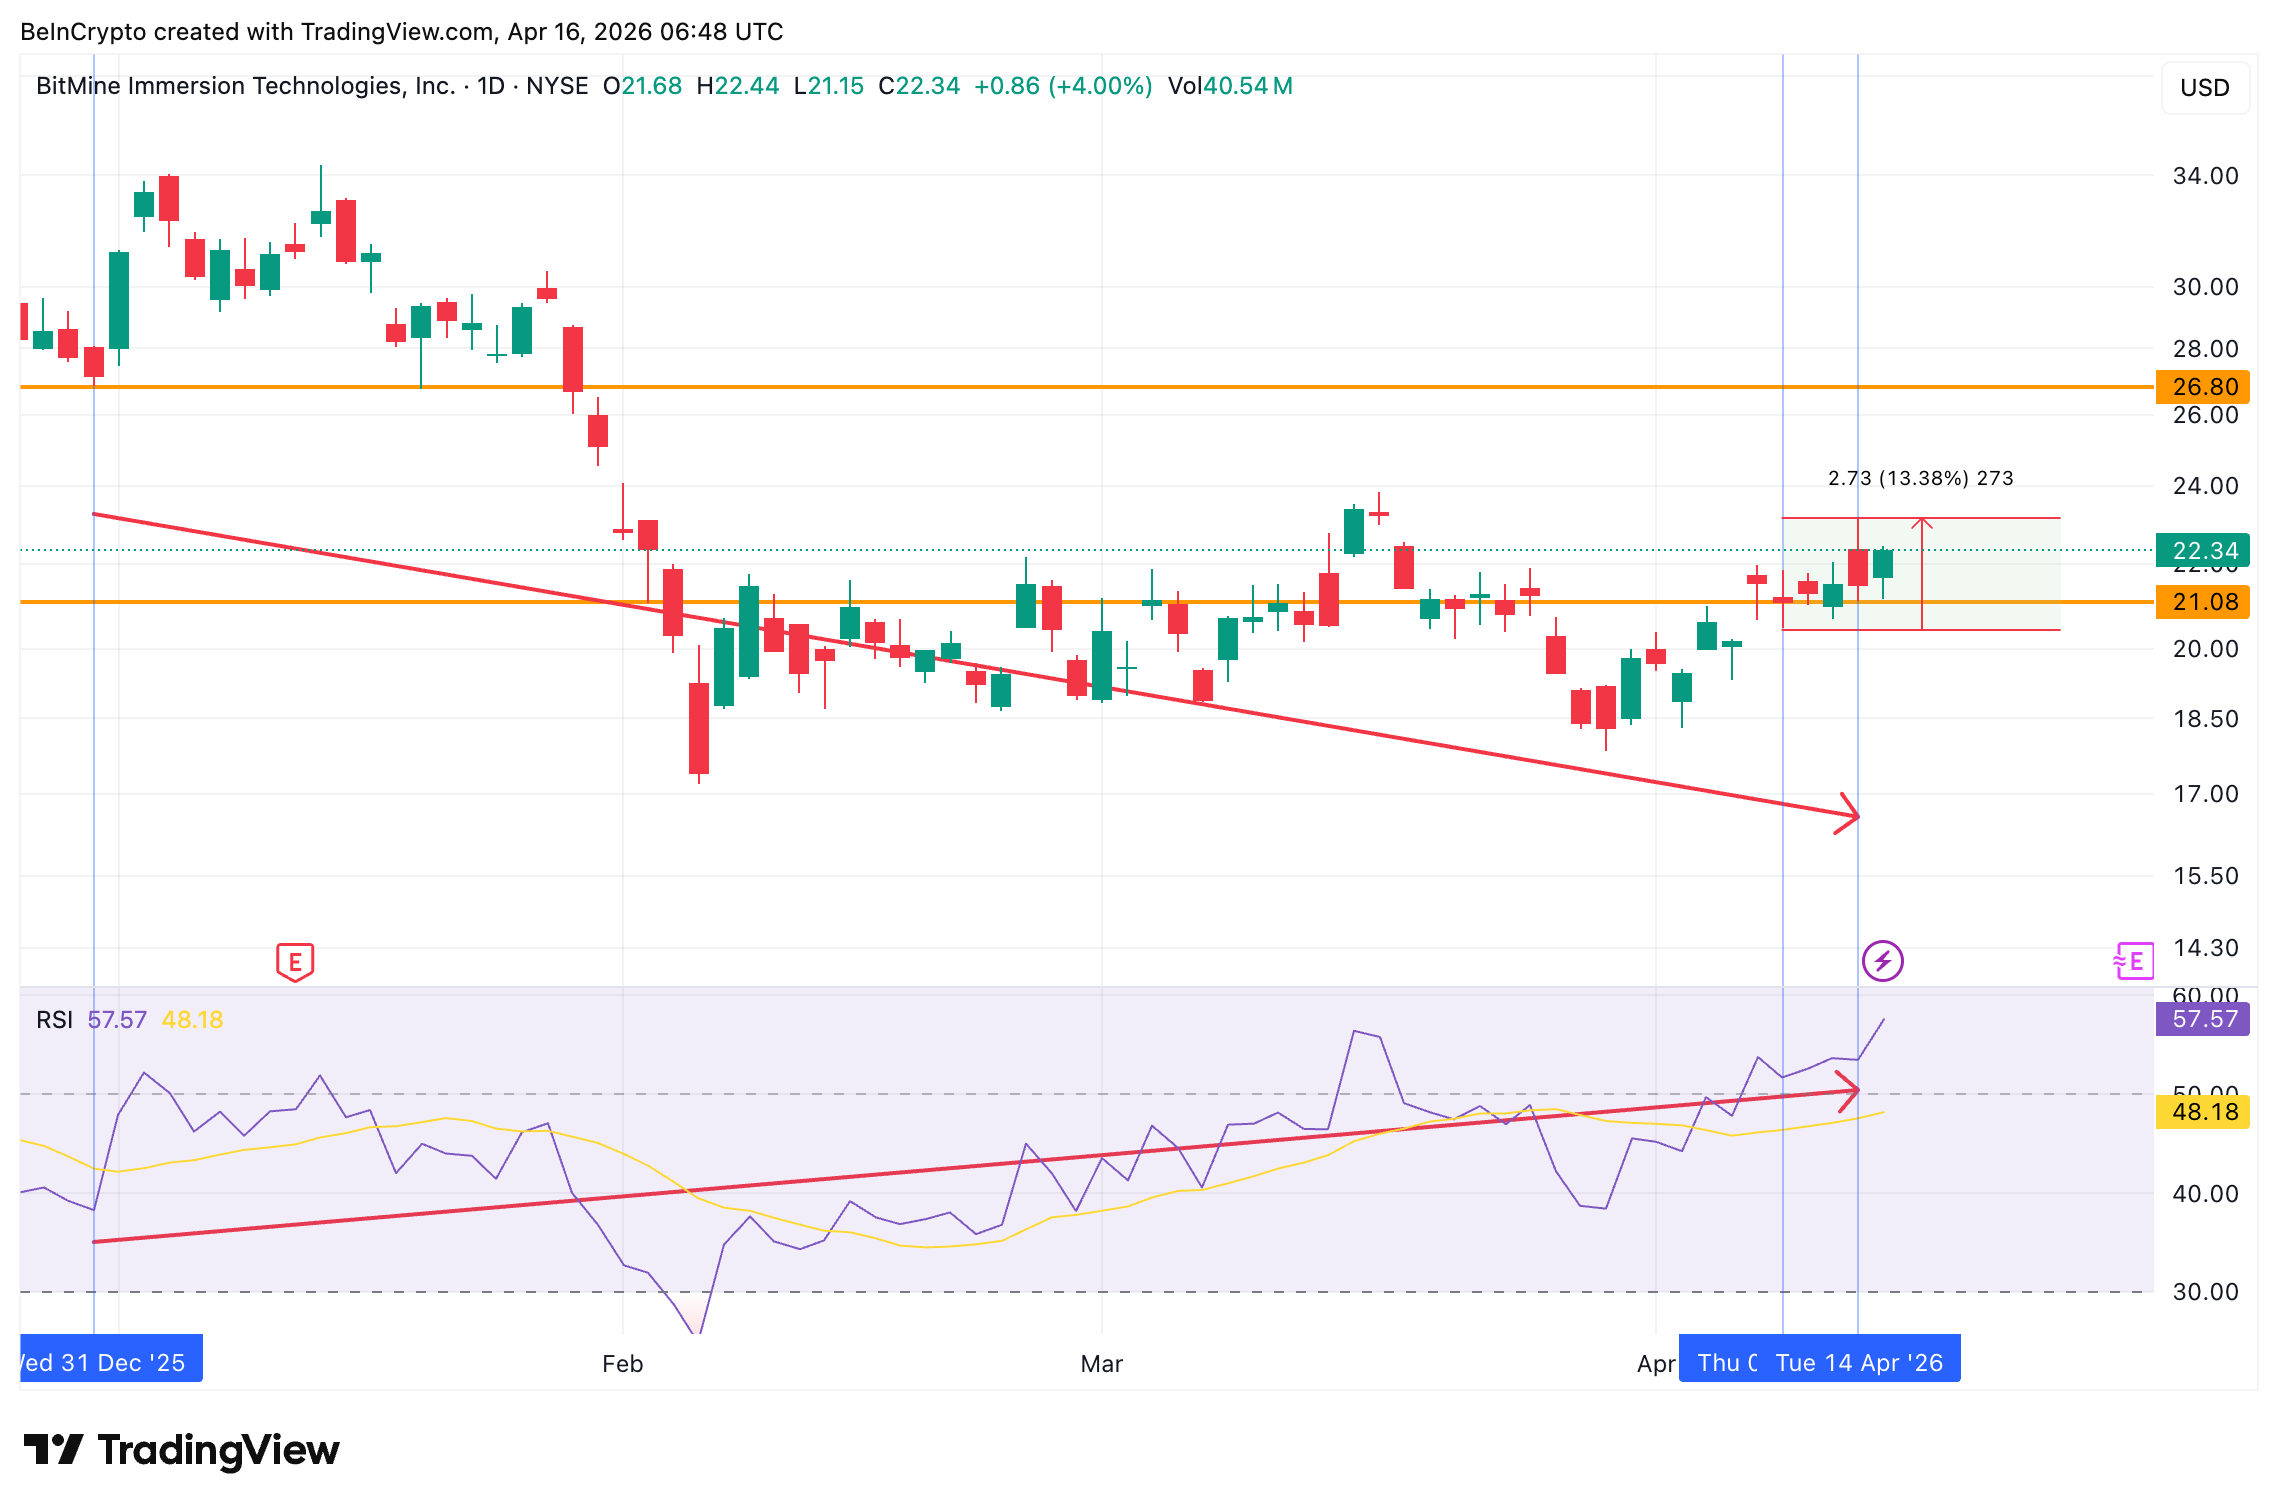 BMNR RSI Bullish Divergence: TradingView
Want more insights like this? Sign up for Editor Harsh Notariya’s Daily Newsletter here.
Options positioning on Bitmine stock supports the near-term shift. In late March, the put-call volume ratio, which compares bearish bets against bullish bets, stood at 1.04. That reflected nearly balanced positioning with a slight bearish tilt. As of April 15, it has dropped to 0.35, heavily favoring calls.
Open interest ratio fell from 0.47 to 0.42. That drop means existing bearish positions are being closed. New activity is favoring calls while old puts are being unwound.
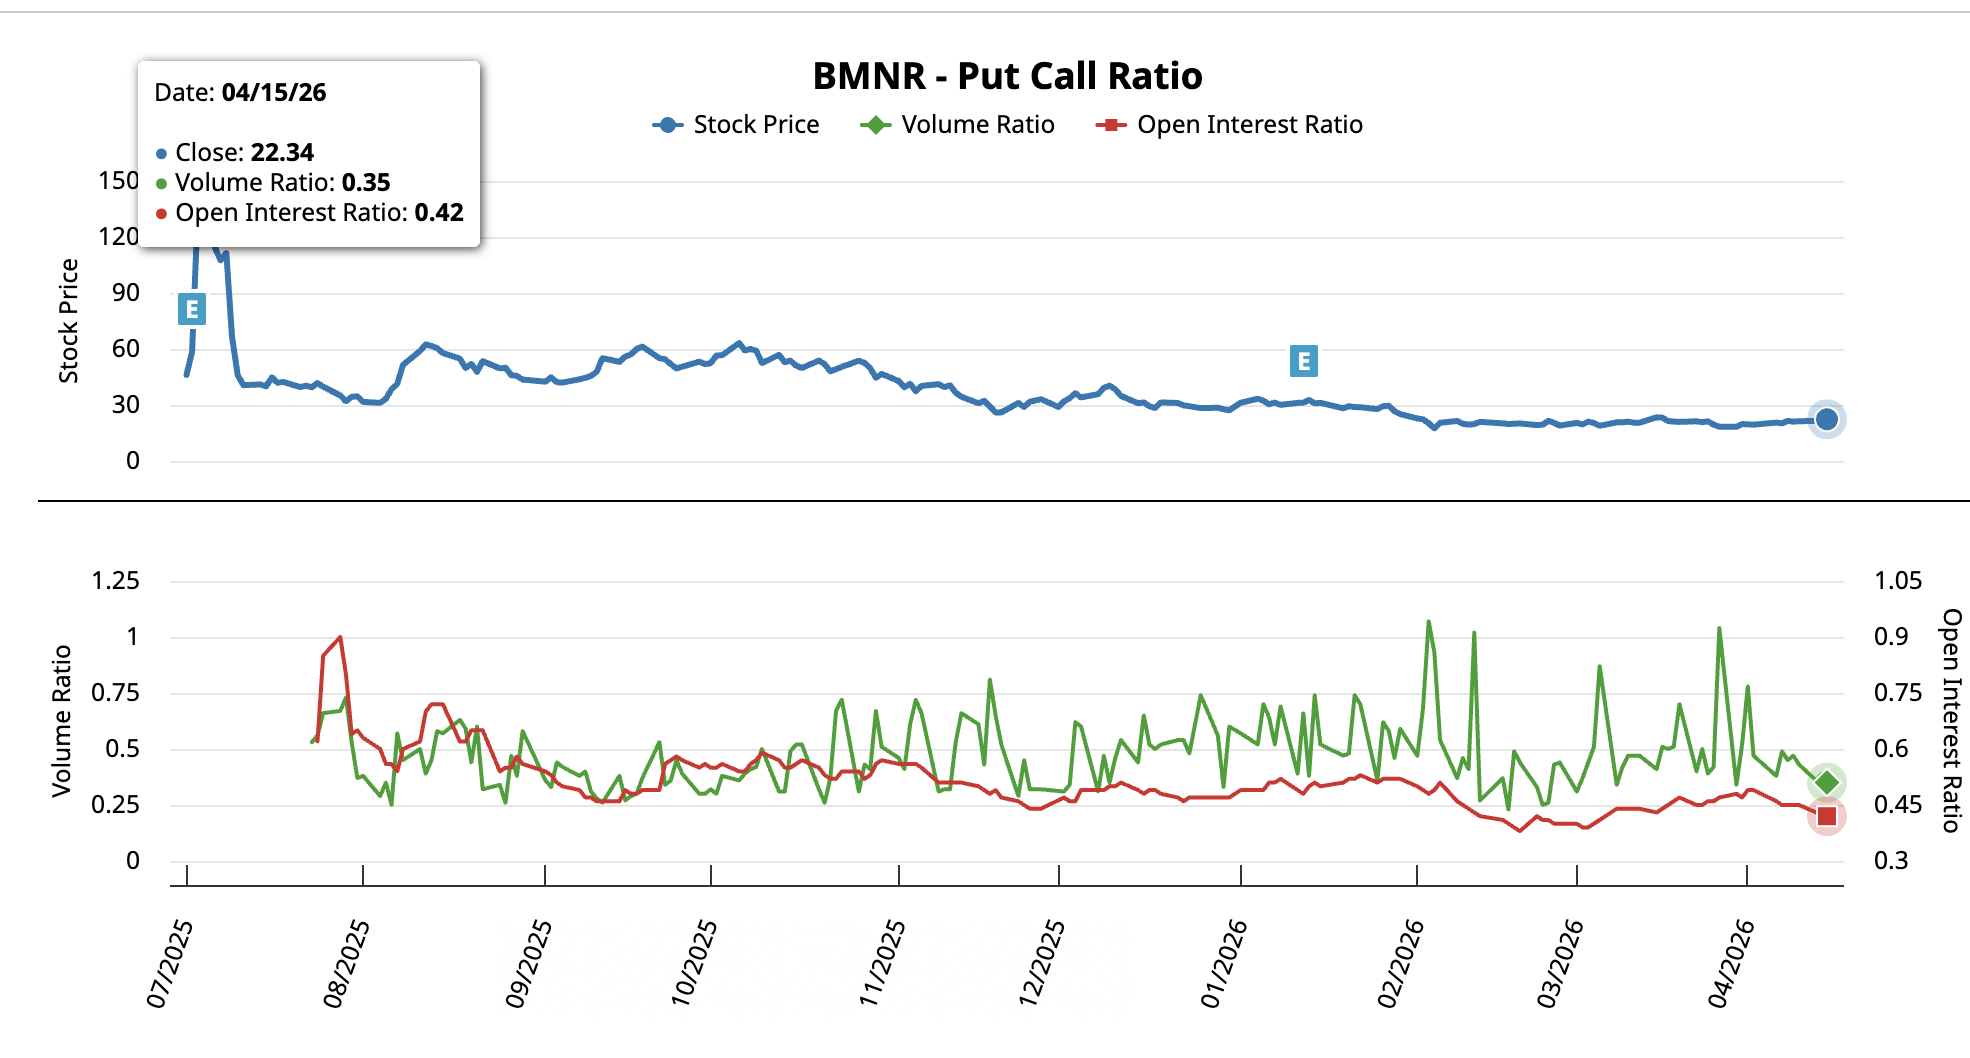 BMNR Put Call Ratio: Barchart
The divergence and options data both point to short-term strength. However, a 13% bounce and a fade is exactly what happened last time. Whether this attempt succeeds depends on one metric that has refused to cooperate.
Institutional Money Flow Hasn’t Crossed the Zero Line
The Chaikin Money Flow (CMF), a proxy for institutional capital sits at 0.00 on the daily chart. It has barely touched the zero line and still leans on the negative side.
Since March, only a few brief instances of CMF crossing above zero have occurred. Each time, the reading quickly fell back below. That pattern means institutional capital has ridden brief bounces but has not committed to accumulating BMNR stock.
The broader structure explains why. The daily chart shows a head-and-shoulders pattern forming, a bearish formation. If the pattern completes, the measured breakdown projects a roughly 23% decline from the neckline.
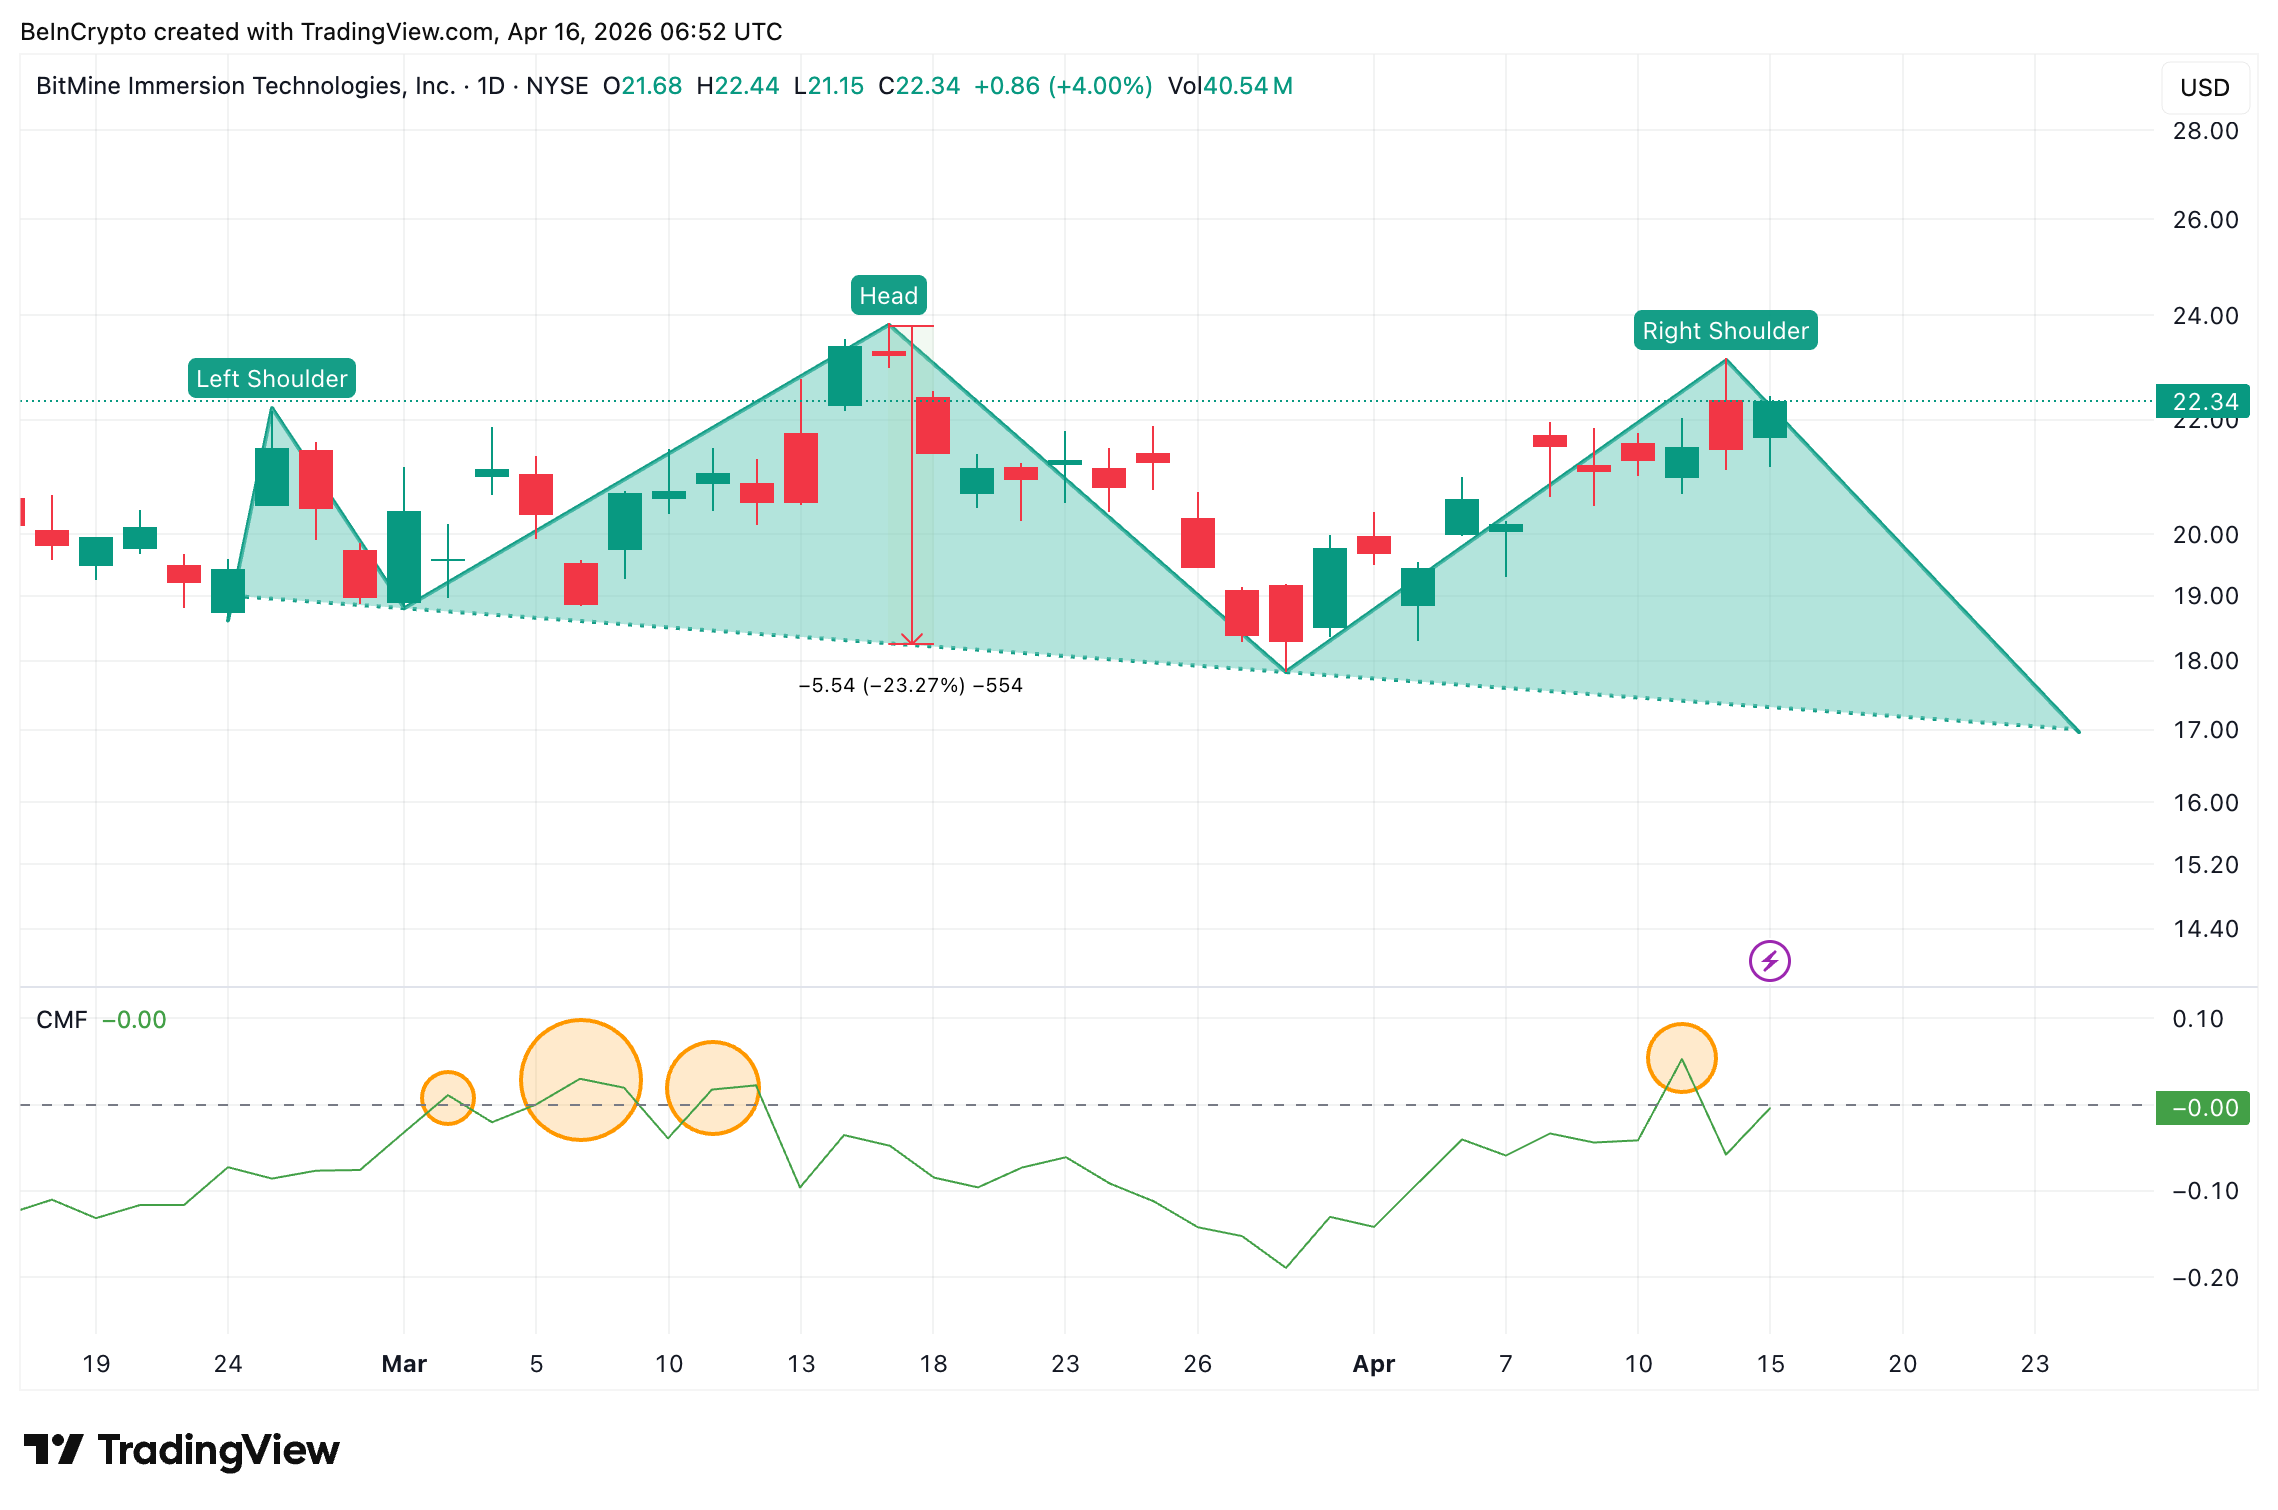 Head Shoulders And CMF: TradingView
The divergence says bounce. The CMF says institutions are not behind it. The head and shoulders says the larger structure remains bearish. That conflict is what makes the price levels ahead critical.
BMNR Stock Price Levels That Decide Between Bounce and Breakdown
The BitMine price chart maps where stock price either validates the divergence or confirms the bearish pattern.
A drop below $21.08 would invalidate the divergence. That was the swing low where the latest signal formed. Below that, $20.87, the 0.382 Fibonacci level, acts as the next floor. A loss of $19.46, the 0.618 Fibonacci, would suggest the CMF was right. From there, $17.17, the head-and-shoulders neckline, becomes the target. A neckline break projects a BMNR price decline toward $13.14.
Yet a daily close above $23.16 would reclaim the top of the current range. That move would weaken the right shoulder and give the divergence room to run. Beyond that, $23.86 is the head’s peak and the level above which the bearish pattern breaks entirely.
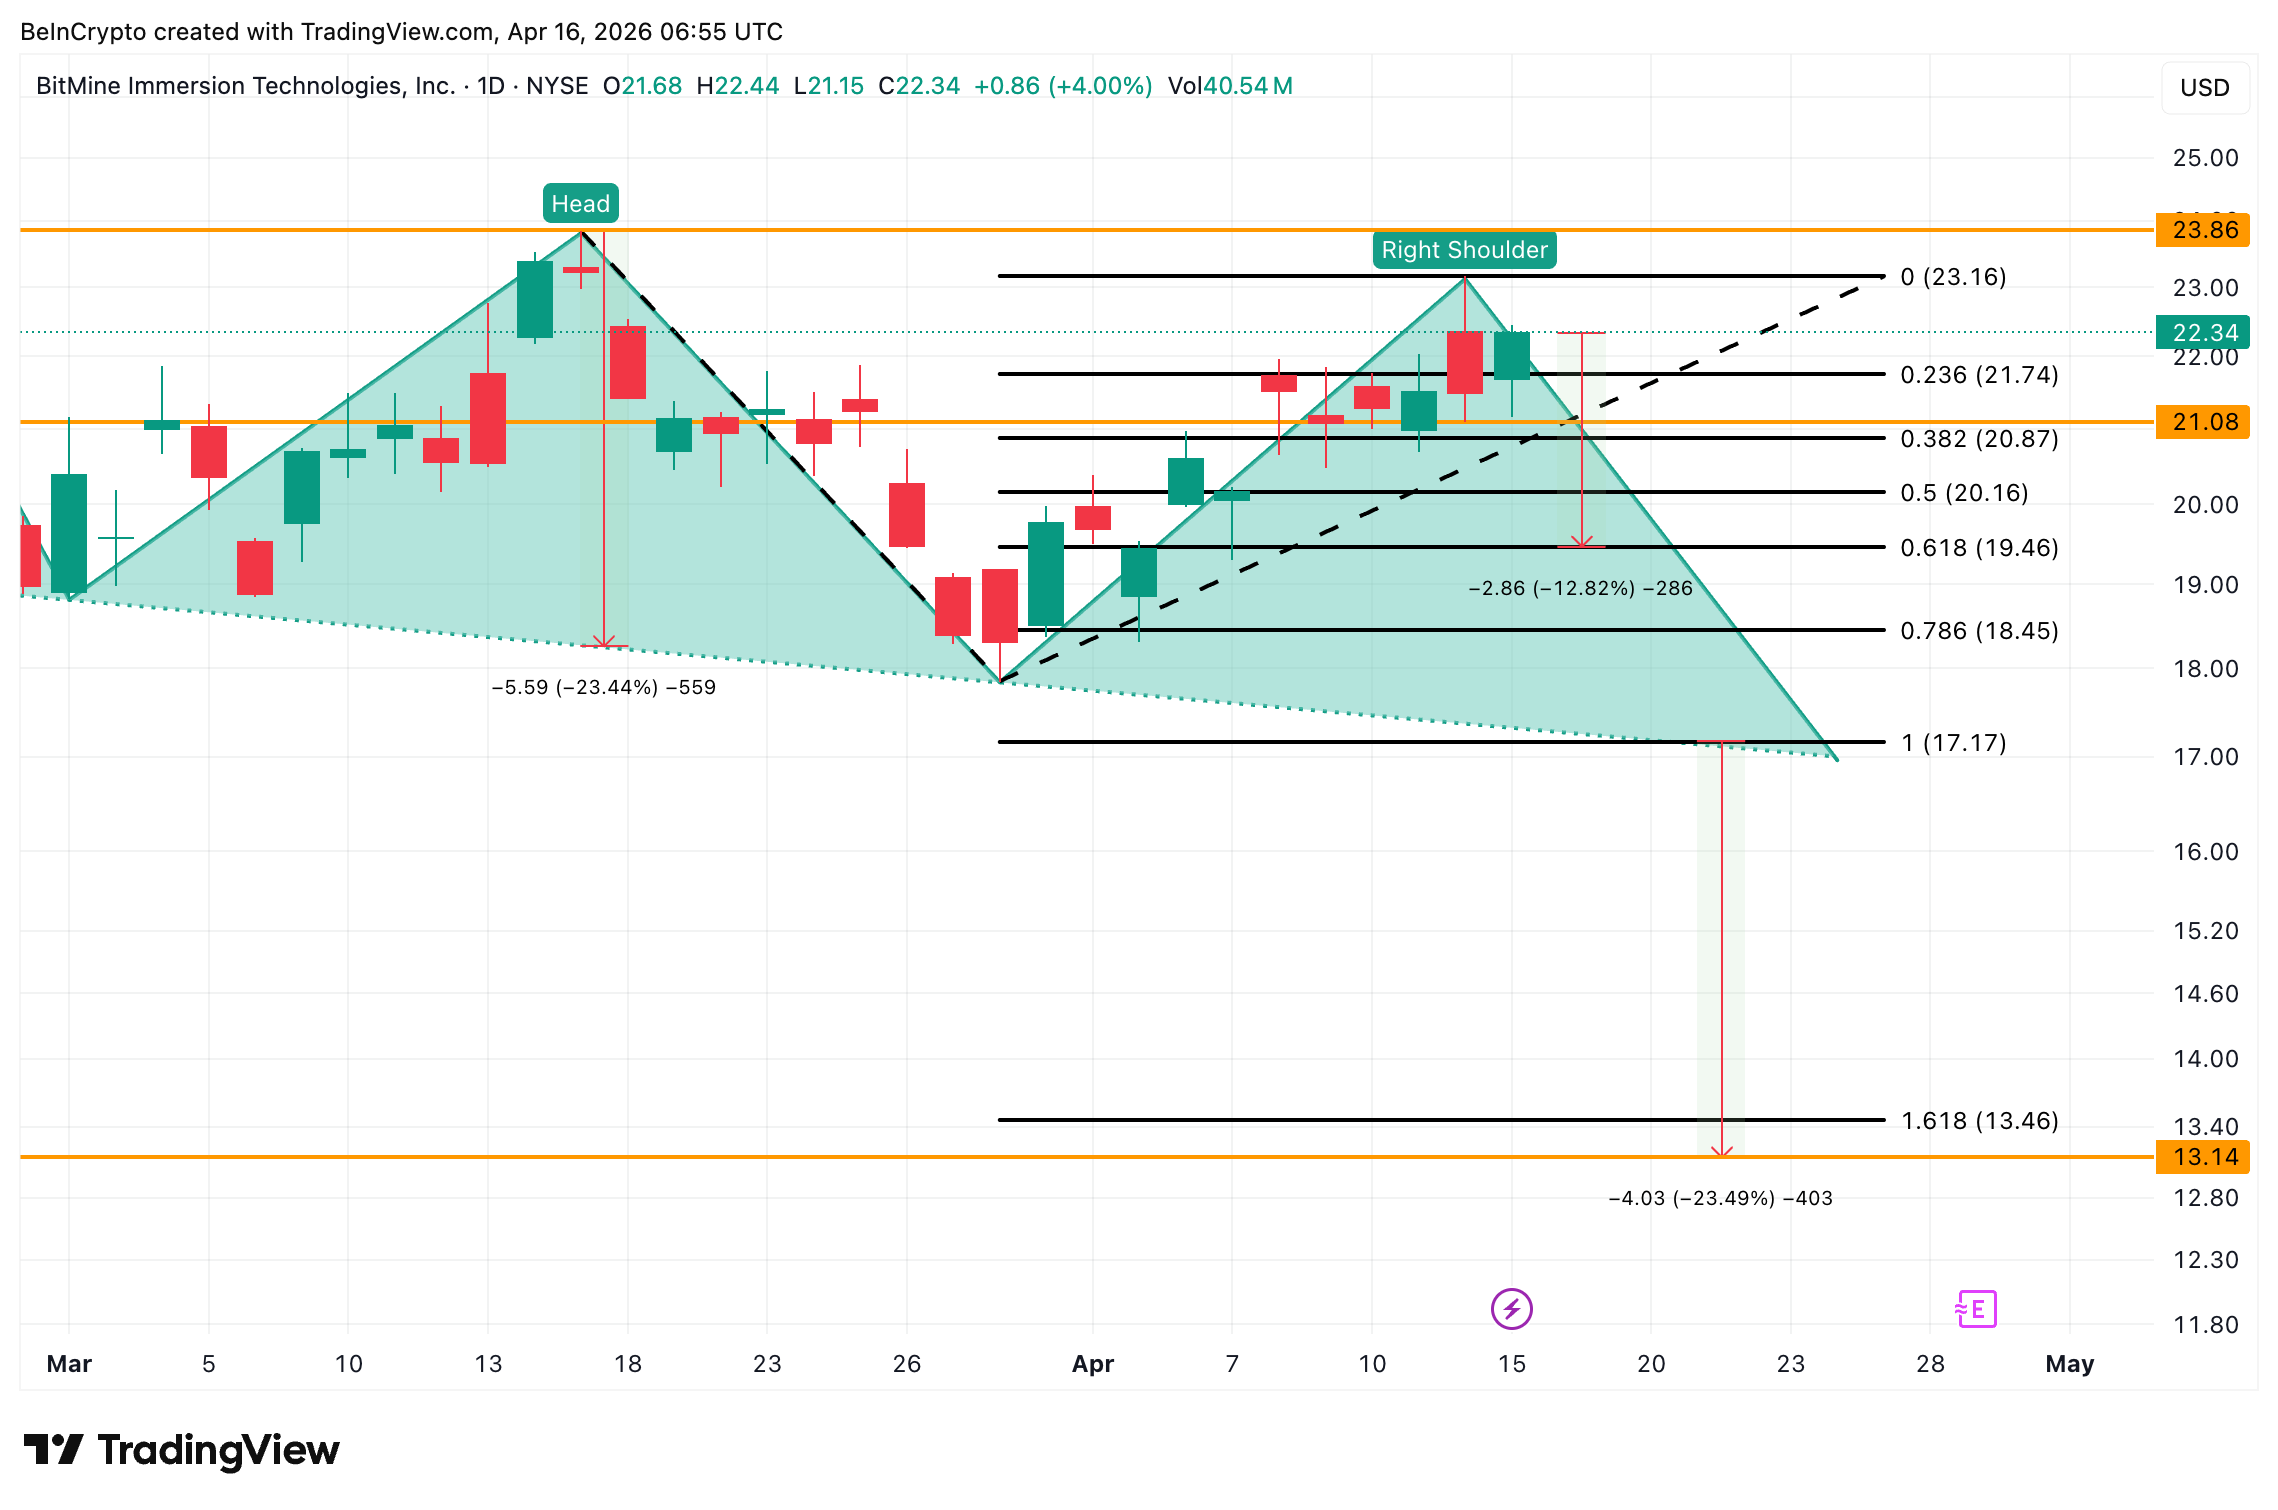 BMNR Price Analysis: TradingView
BMNR stock price at $23.16 separates a successful divergence from a repeat of the 13% fade. A close above it gives institutions a reason to follow. A drop below $21.08 hands the chart back to the head and shoulders.
Recommended Articles


