

A Falling Dollar Handed Silver a 33% Rally, but One Level Now Decides Everything
Silver (XAG/USD) price is up 7.2% over the past week, erasing nearly all of its monthly losses. The metal now trades near $79.50 after rallying 33% from its March 23 low.
The recovery aligns with a falling US Dollar Index (DXY) and improving ceasefire sentiment. However, silver remains trapped inside a bearish channel that has held since January 29. A breakout above that channel would shift the structure from recovery to trend reversal.
A Falling Dollar Fuels Silver’s Rally Inside a Bearish Channel
Silver price has traded inside a falling channel on the daily chart since January 29. The channel formed as the US Dollar Index (DXY) was climbing. DXY measures the dollar against a basket of major currencies.
The bottom of the channel was tested on March 23, when silver touched $60.86. At that point, DXY was peaking near 99.40. The inverse correlation played out clearly. As the dollar strengthened, silver weakened.
Since April 8, however, the relationship has reversed. DXY has been falling, now sitting near 99.20 (down over 2% month-on-month), and silver has climbed 33% from the March low (in over 3 weeks). Oil prices dropping below $100 after the US-Iran ceasefire have eased inflation expectations, reducing dollar demand. That dollar weakness is flowing directly into precious metals.
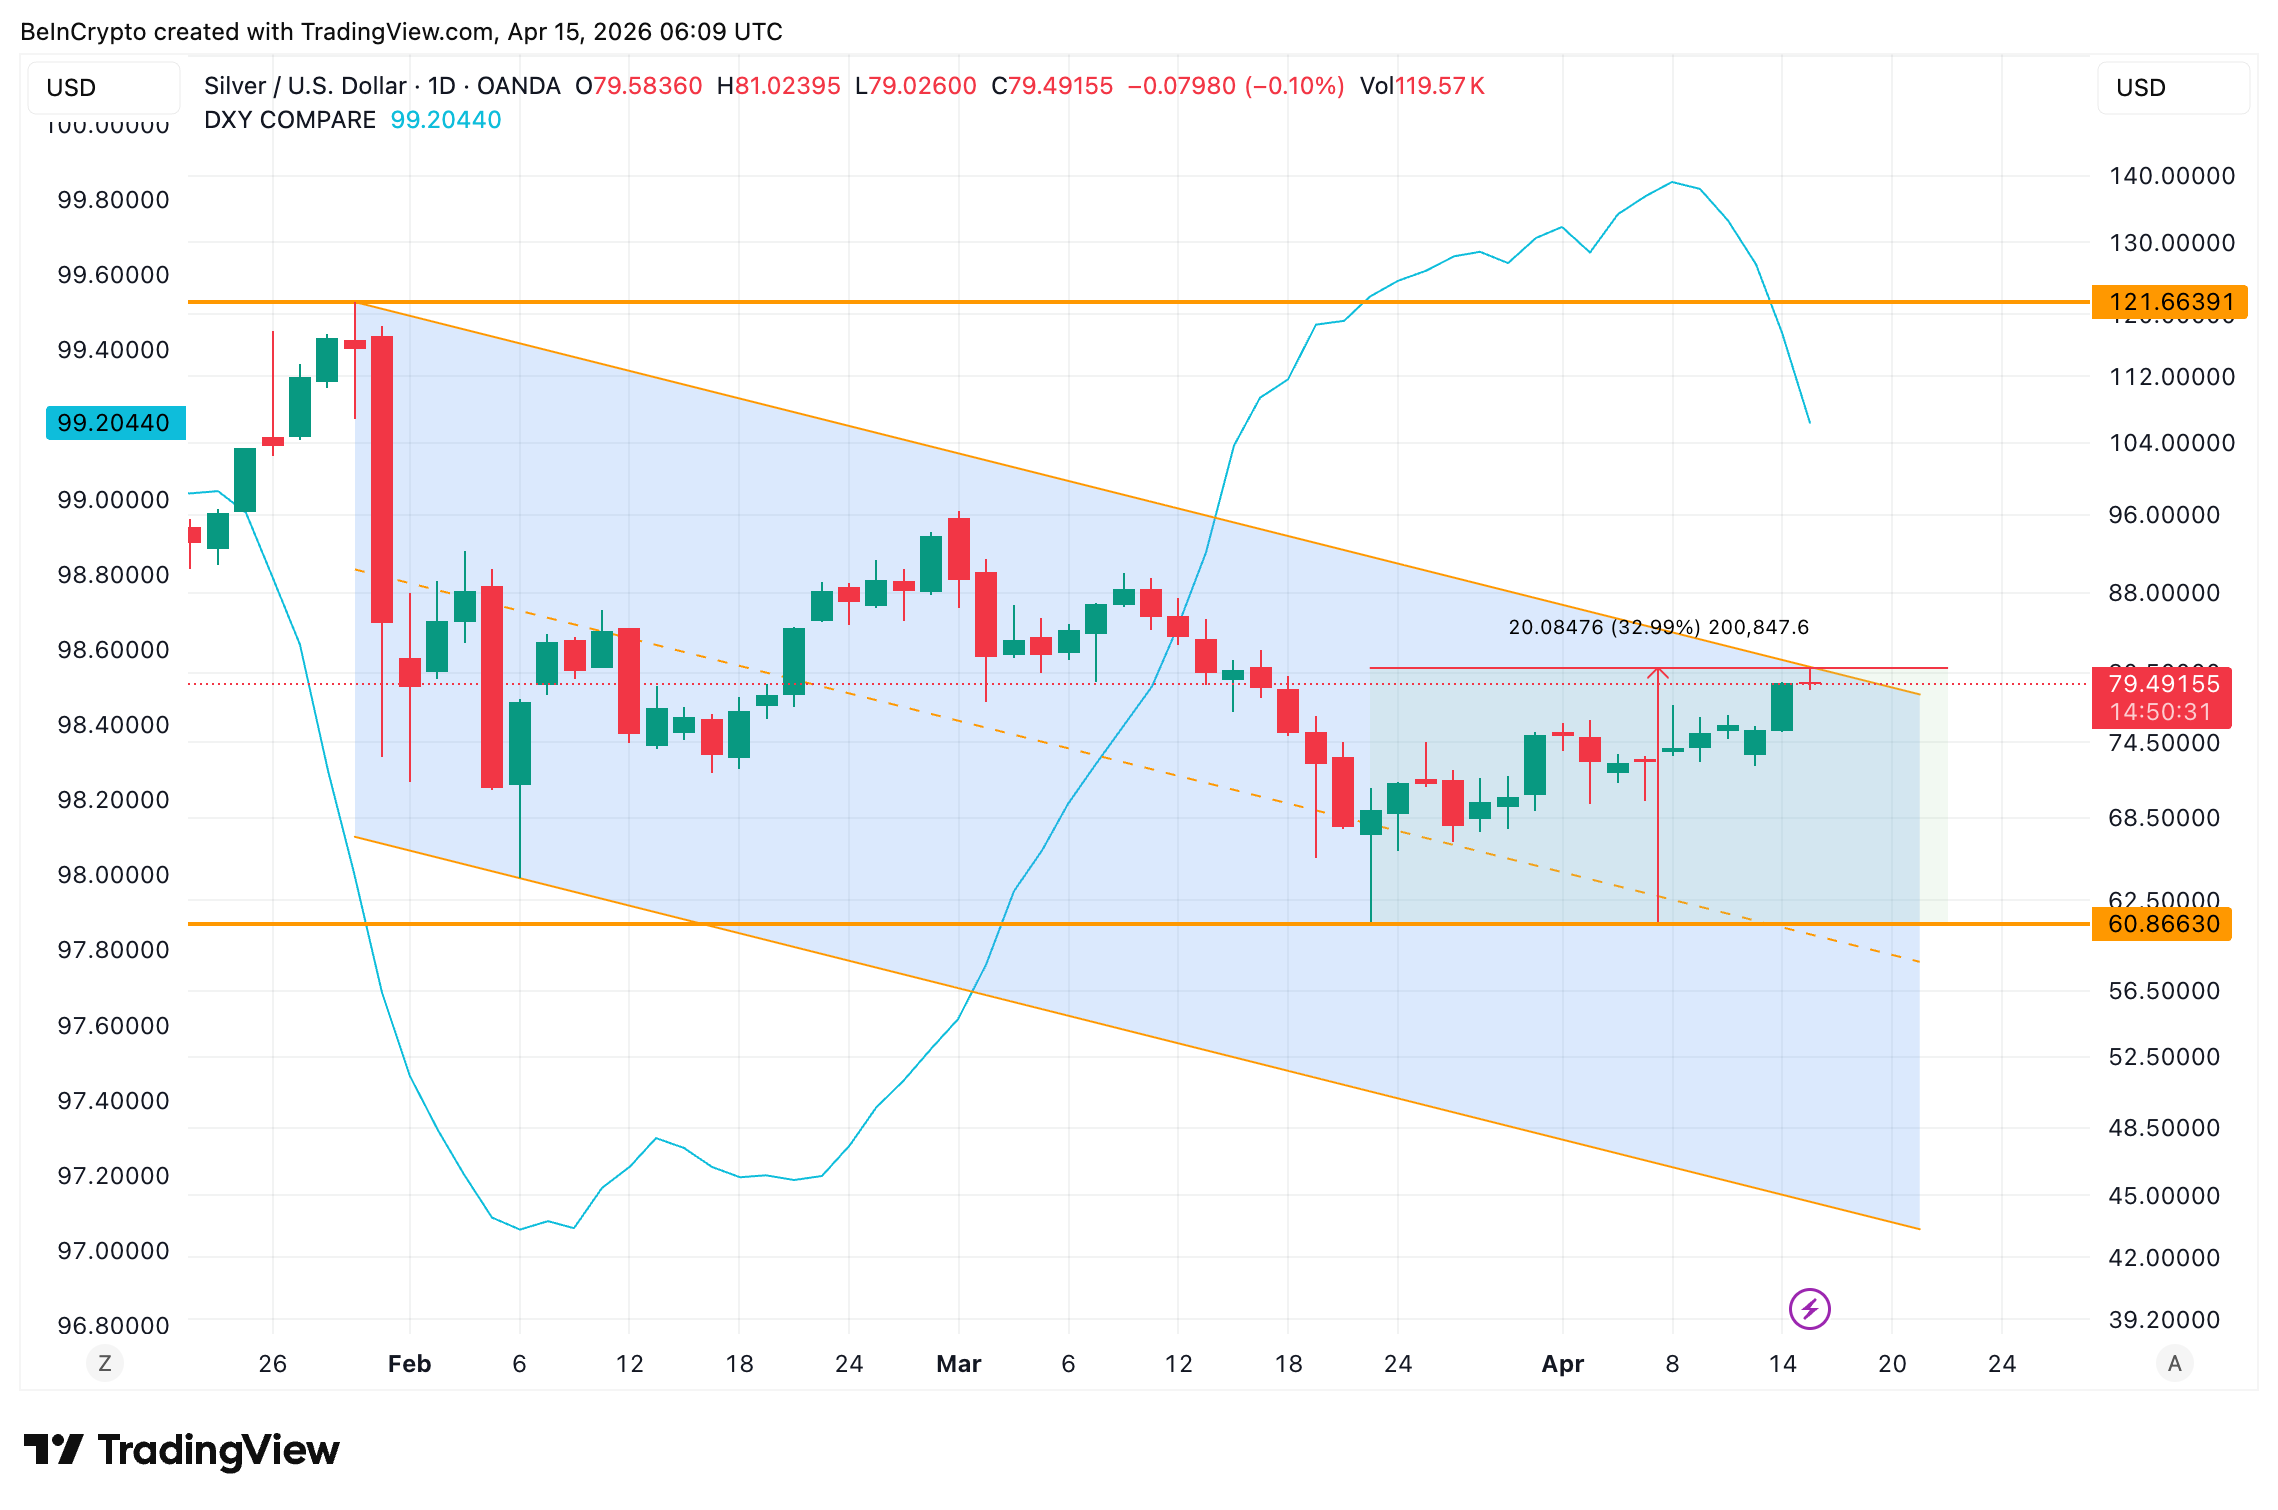 Silver-DXY Inverse Correlation: TradingView
Want more insights like this? Sign up for Editor Harsh Notariya’s Daily Newsletter here.
Despite this, silver remains inside the bearish channel. The upper trendline sits close, and silver needs to break above it to confirm a structural shift. Whether that conviction exists beyond the dollar trade depends on two forward-looking signals.
A Proprietary Model and SLV Options Data Align With the Rally
BeInCrypto’s Silver versus Solar Lag Model is a proprietary indicator. It measures the gap between silver’s price and lagged solar energy demand trends. The model currently reads -0.389, still below the zero line.
However, the direction matters. The model bottomed near negative 1.34 around the same time silver hit $60.86. Since then, it has been climbing steadily. The last time silver made a major peak, the model was reading near positive 2.0. A cross above zero would suggest silver is finally catching up to underlying industrial demand. That crossover has not happened yet, but the trend is moving in the right direction.
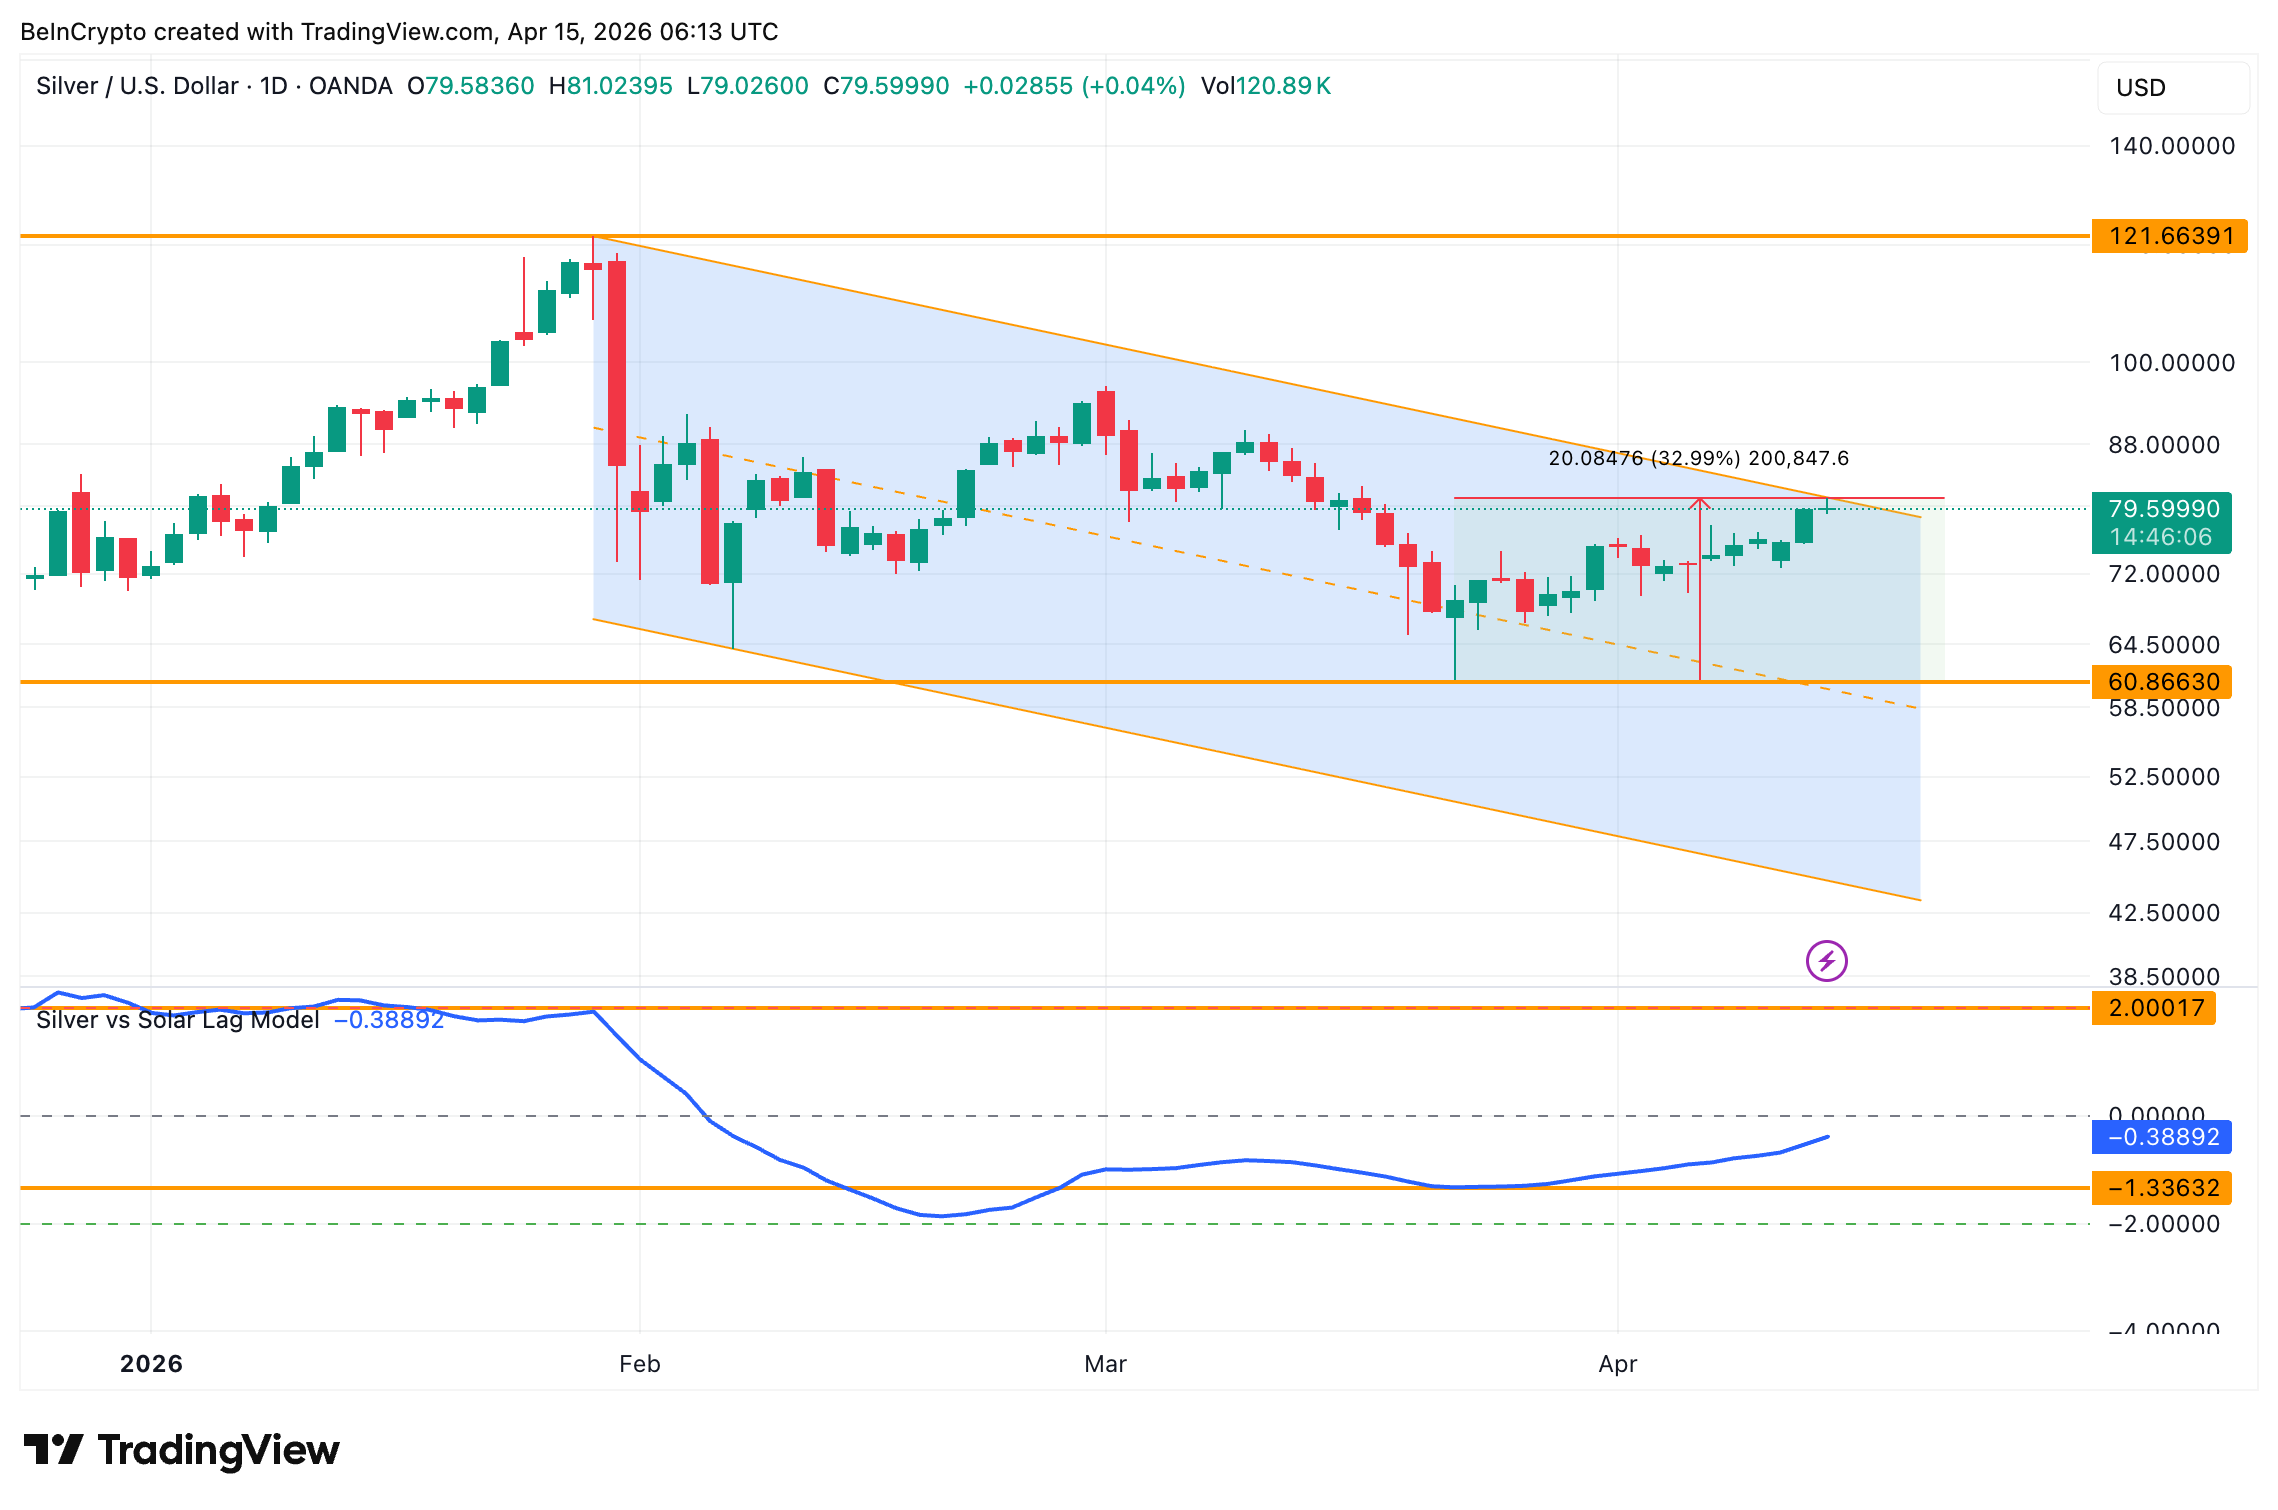 Silver Solar Lag Model: TradingView
Meanwhile, options positioning on the iShares Silver Trust (SLV), the largest silver-backed ETF, confirms a shift in sentiment. On March 20, the SLV put-call open interest ratio stood at 0.63. This ratio compares bearish put bets against bullish call bets. The volume ratio was 0.86, reflecting roughly balanced positioning.
As of April 14, however, the open interest ratio has dropped to 0.59 and the volume ratio fell to 0.45. Both readings show that bearish bets are being unwound. Implied volatility sits at 58.31% with an IV Percentile of 73%. That means current volatility is elevated relative to the past year. Falling put-call ratios paired with high IV typically precede directional moves.
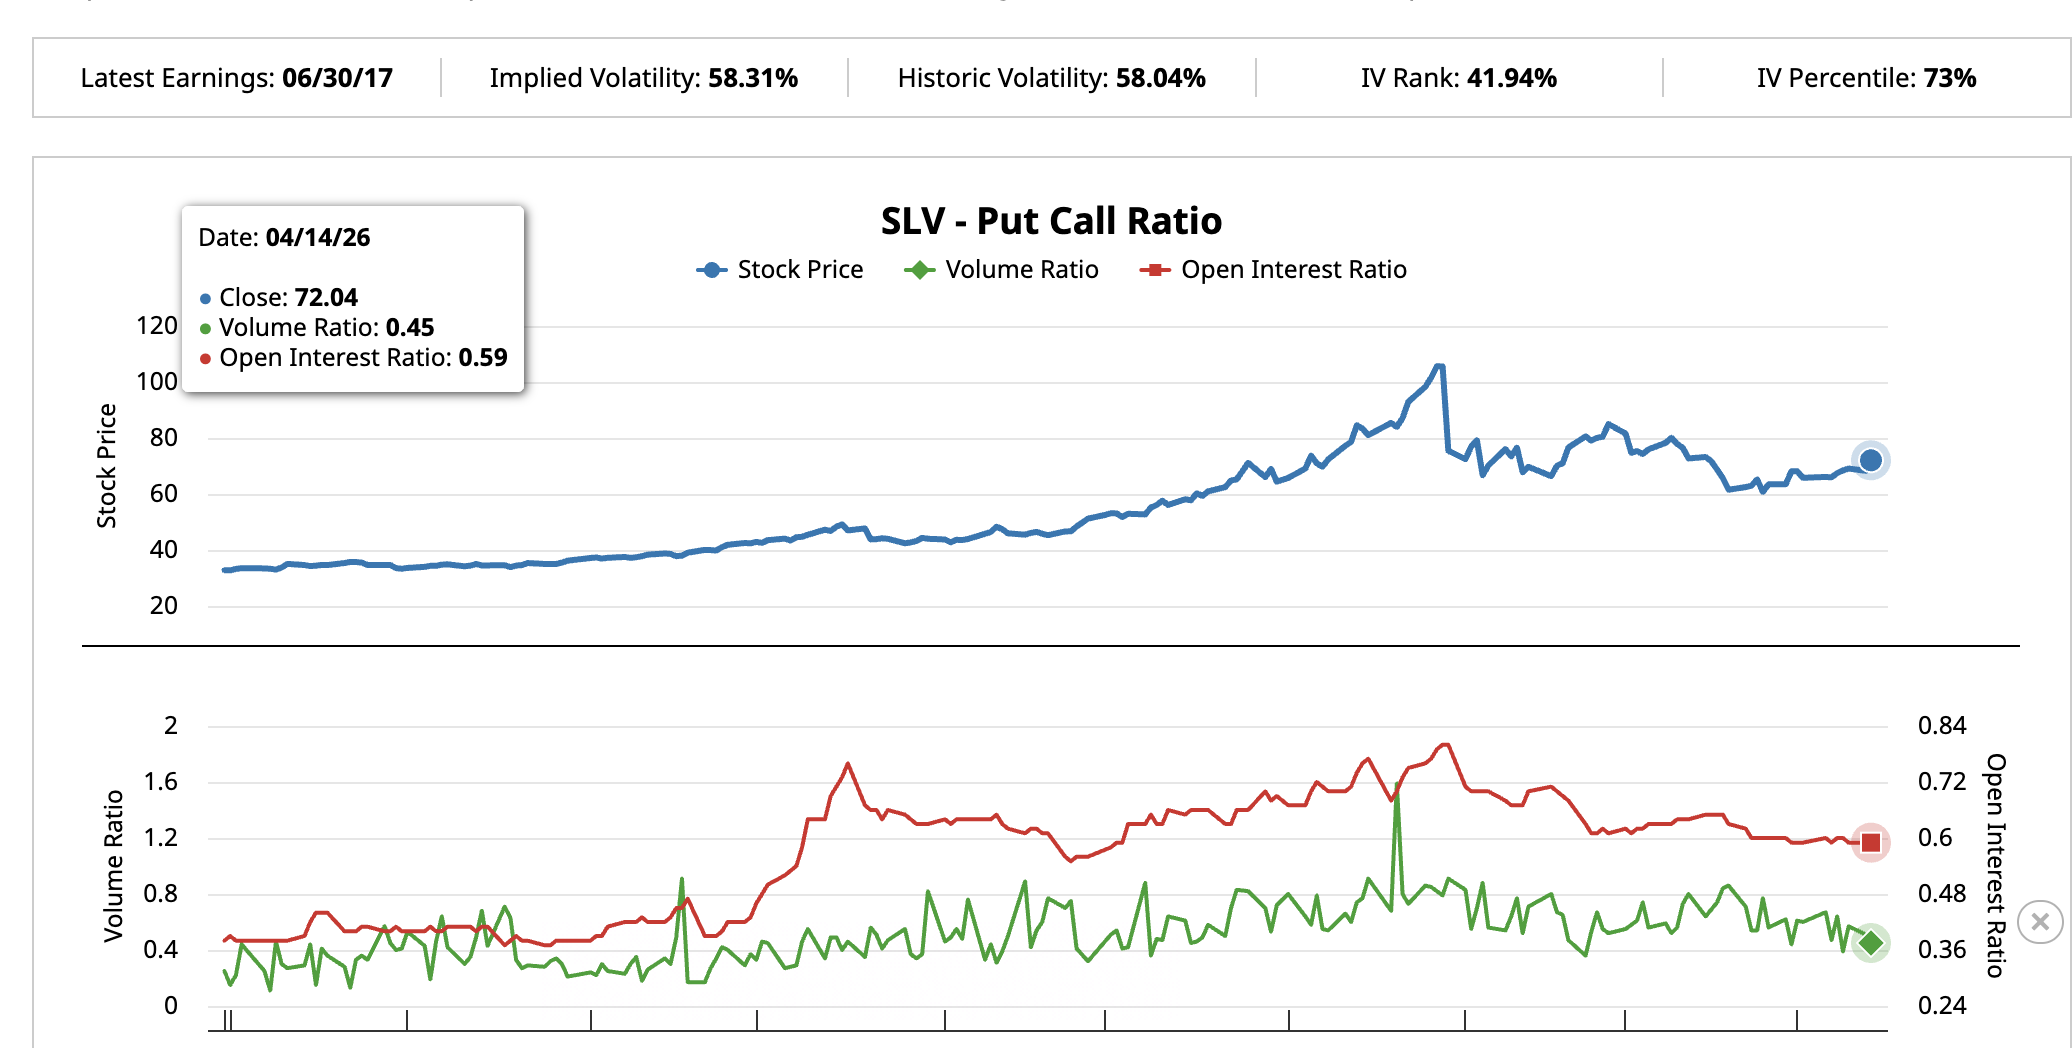 SLV Put Call Ratio: Barchart
The DXY inverse correlation, the Solar Lag Model’s trajectory, and the SLV options shift all point in the same direction, improving bullish sentiment. However, the Silver price chart must confirm.
Silver Price Needs to Cross $84 to Shed Its Bearish Channel
The daily price chart maps the exact levels where silver must deliver. The upper trendline of the falling channel and a key technical level converge near $84.29. That level sits 6.46% above the current price.
A clean break above $84.29 would mean silver has exited the bearish channel for the first time since January 29. If the DXY continues falling and ceasefire talks hold, targets open at $91.46, $98.63, and even $108.67. The January 29 all-time high of $121.84 sits further above.
Yet a failure to break $84 would keep silver range-bound inside the channel. A drop below $75.42, the 0.236 Fibonacci, would meanwhile signal renewed dollar strength or a ceasefire breakdown. That could push silver price back toward $61.08.
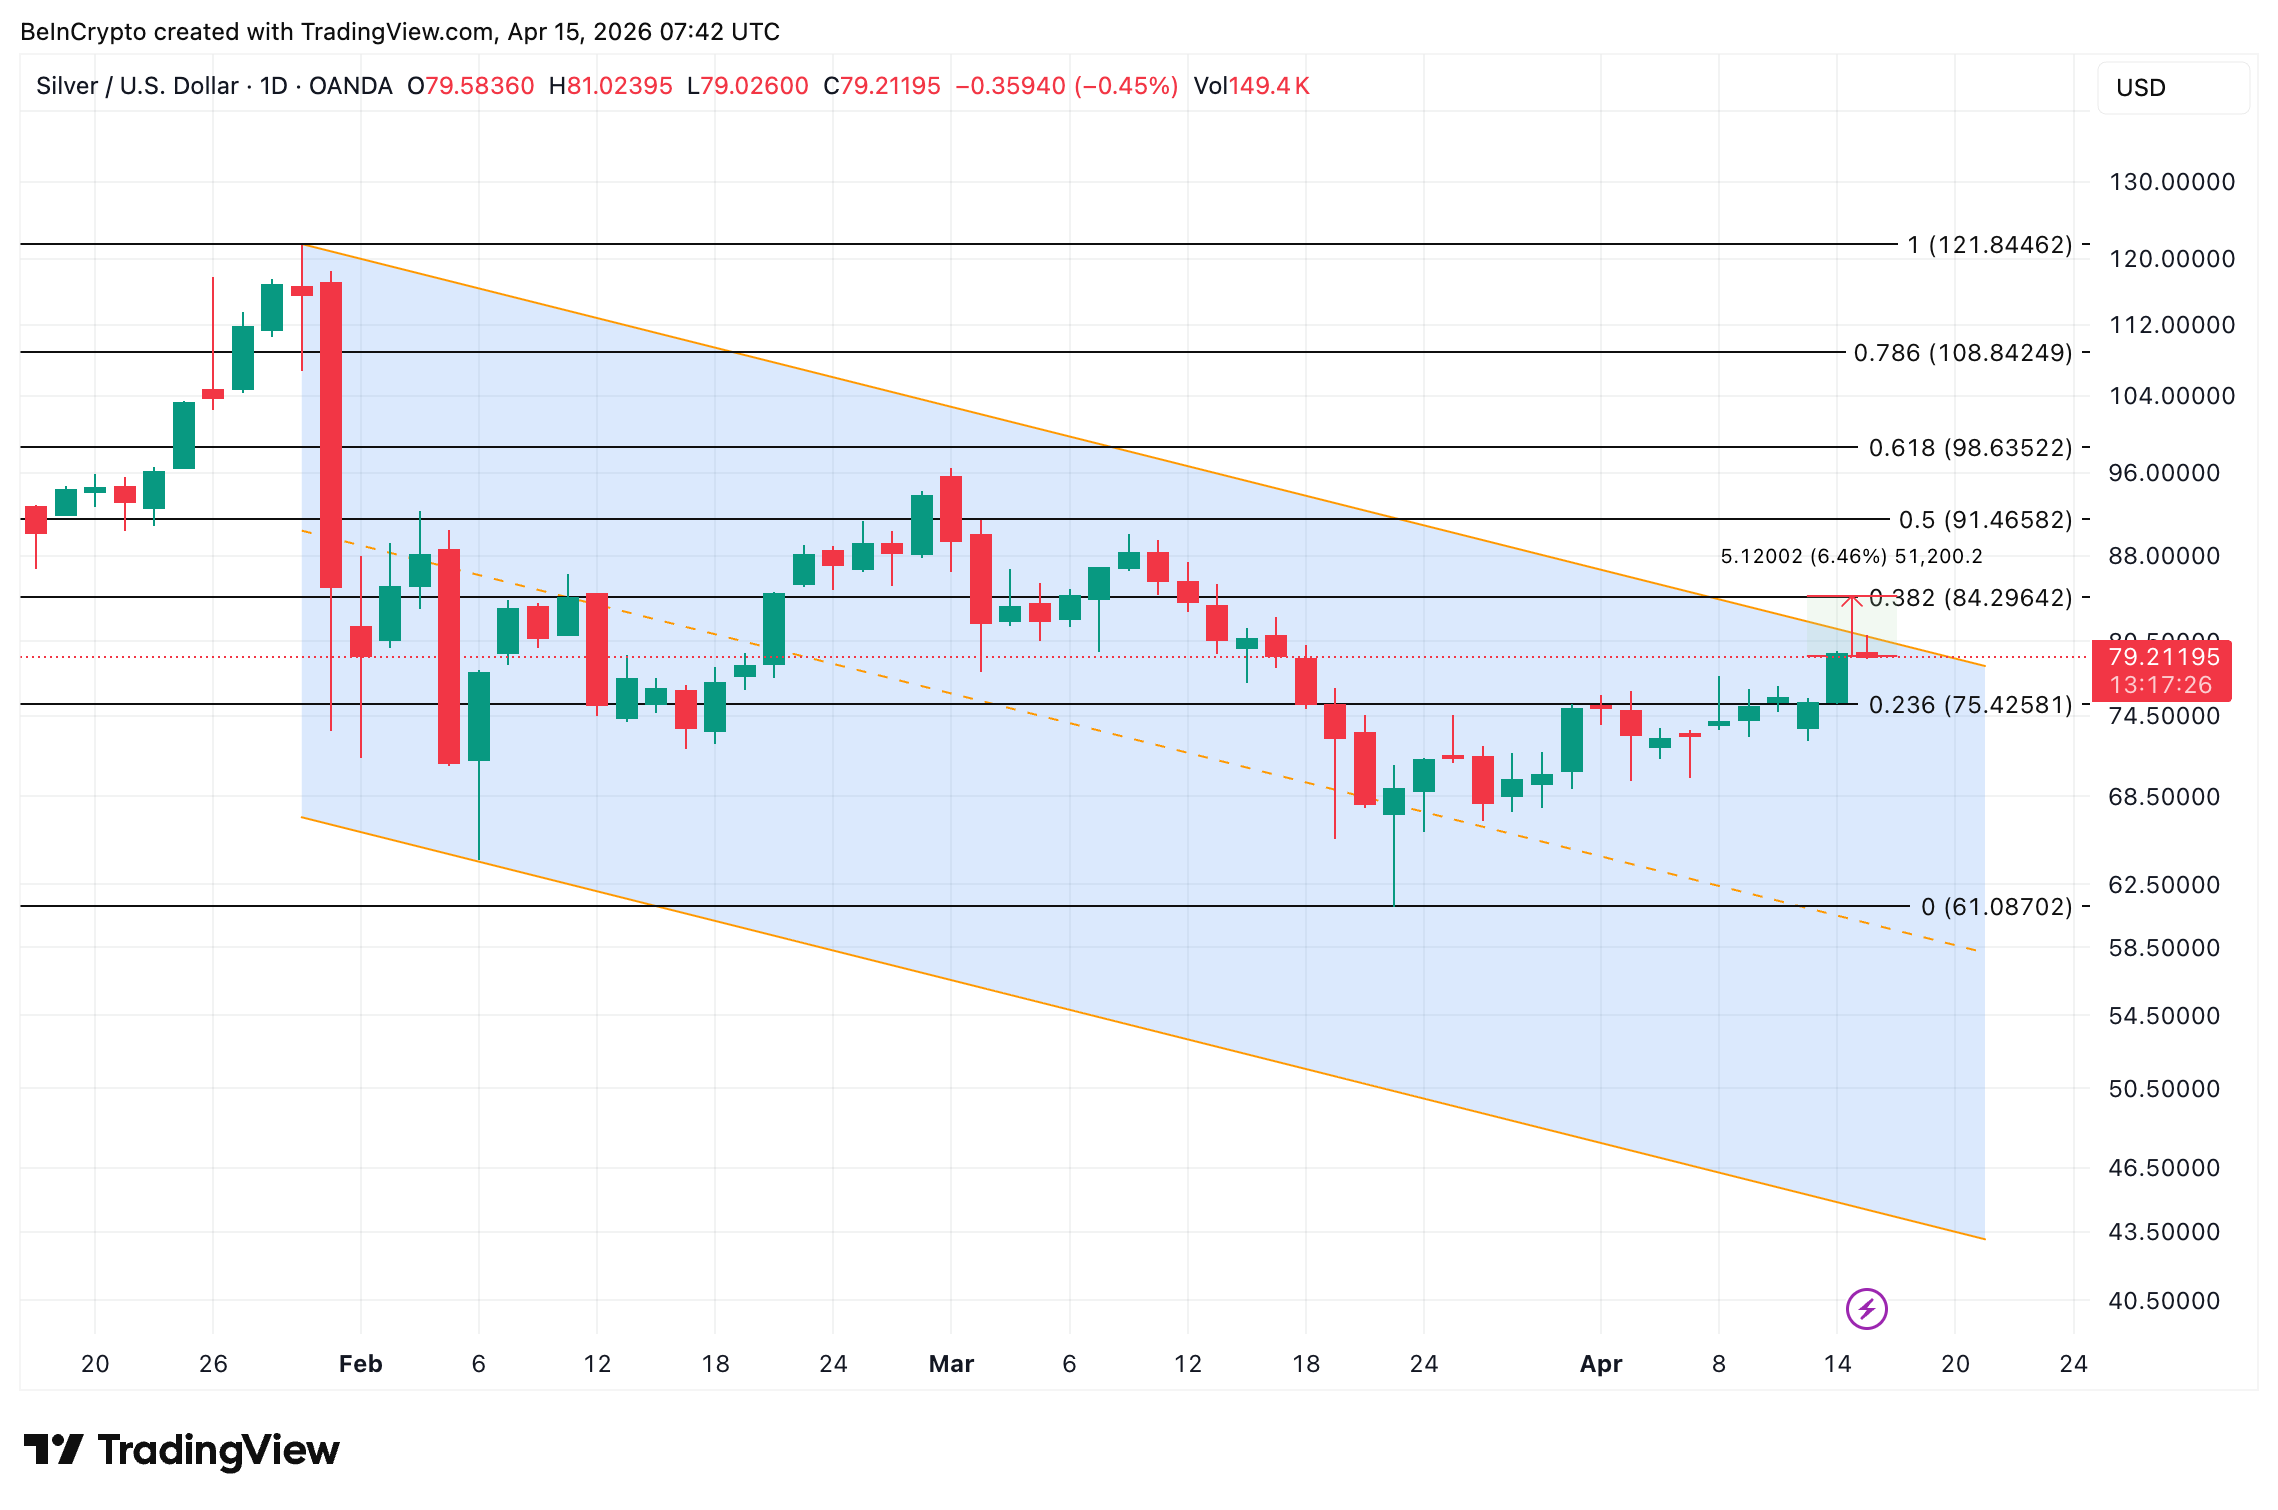 Silver Price Analysis: TradingView
A daily close above $84 breaks the channel and opens a path toward $91 and even $108. A rejection keeps silver trapped and tests whether the 33% rally was a recovery or a dead cat bounce.
Recommended Articles


