

BloFin Research: The $197B Question, How Mega IPOs Reshape Markets & Crypto
The approaching mega-IPO cycle will function as a transient liquidity absorber across risk assets before post-lockup wealth recycling produces a net positive medium-term impulse for both equities and crypto.
- SpaceX, OpenAI, and Anthropic carry a combined valuation of $2.8T to $3T, with SpaceX alone expected to raise $50B – $70B in coming months, which already exceed the entire 2025 U.S. IPO market capital raises $44B in a single transaction.
- Mega-IPOs are a late-cycle sentiment gauge, not a reliable market-top signal, and in 2026, the more precise read is a rotation from AI-disrupted software and over-extended AI names into physical bottleneck sectors, with the overall market holding up.
- The AI mega-IPO cycle creates a near-term liquidity headwind for Bitcoin via ETF flow compression, but reverses into a tailwind post-lockup, as newly liquid employees and insiders with above-average Bitcoin & Crypto appetite.
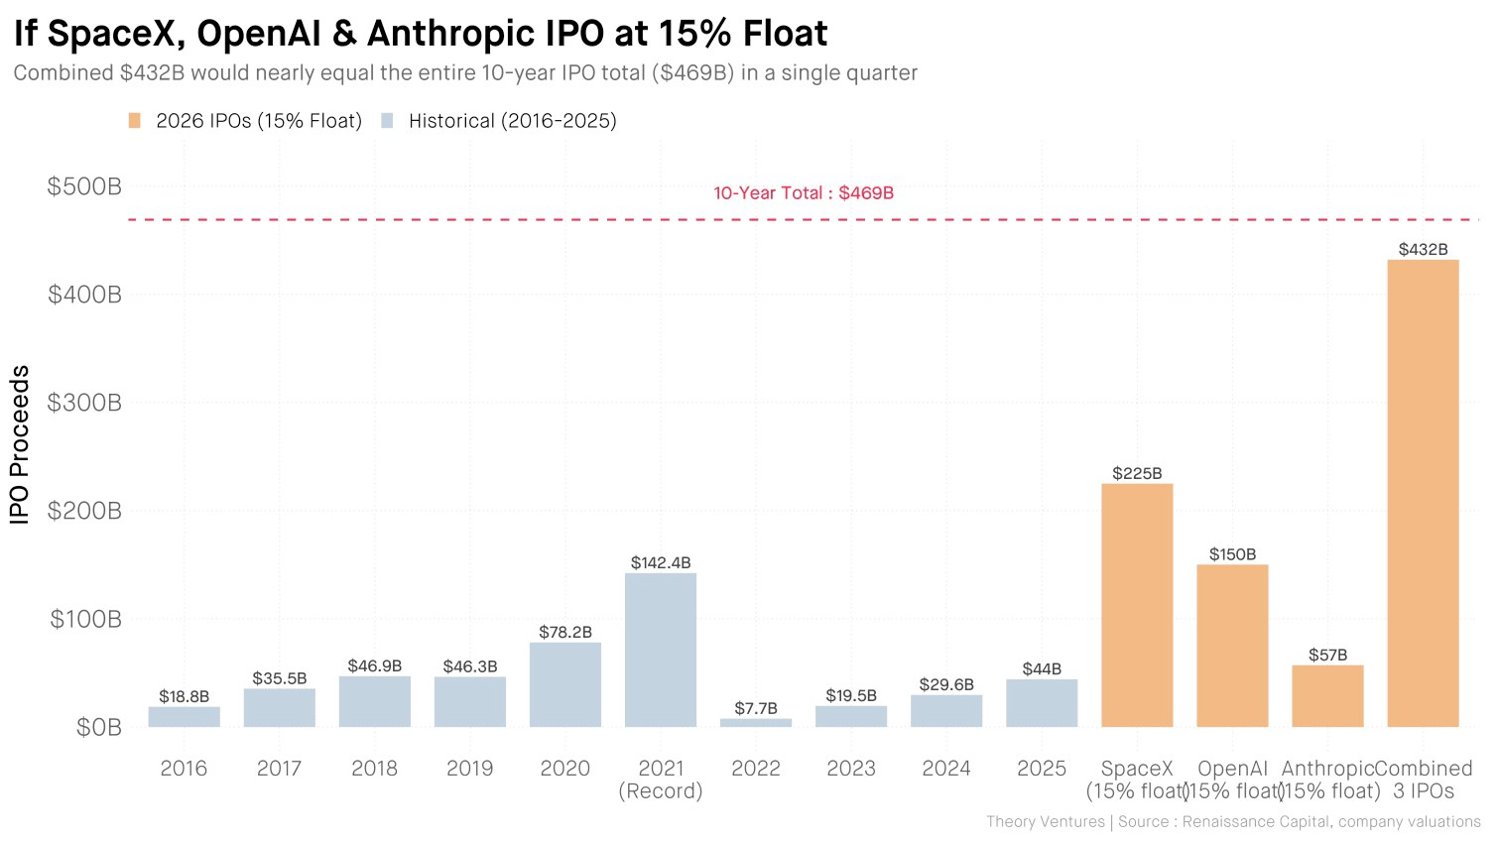
$197 Billion Capital Has to Come From Somewhere
In 2025, the U.S. IPO market generated $44B in total proceeds, and the past 10 year total U.S. IPO captial raise is $469B. SpaceX is currently targeting a valuation of approximately $1.75T, with a expected raise of $50B-$70B. Adding OpenAI and Anthropic, both of which have expressed the intention to go public this year, the aggregate capital demand reaches $104-$197B. This estimated raising amount is already assuming an initial float of around 5-10%, well below the standard of 15% of typical IPO.
IPO norms typically involve offering 15-25% of shares to public markets, balancing liquidity for price discovery with continued control for founders and early investors. For example, Facebook floated 15% and Google floated 19%. However, the total capital demand for SpaceX, OpenAI, and Anthropic would be over $400B assuming a standard 15% float, an amount almost approaching the entire US IPO market raised amounts from 2016 to 2025 combined. This has made a 15% float just impossible. Initial floats for these companies will likely be significantly smaller, with 5-10% as a realistic baseline.
Source: https://x.com/ttunguz/status/2025982593573994804/photo/1
The first direct impact is the squeeze on smaller offerings this year as the market capacity is limited and selective. Karken has already paused its IPO plans until conditions improve, an early indicator of the crowing-out effect.
Capital directed toward mega-IPO allocations compresses valuations for smaller-cap growth equities, Bitcoin, and crypto broadly, as investors need to fund subscriptions. In addition to capital, culturally prominent listings also absorb financial media coverage and social trading activity for retail, suppressing performance in assets competing for the same marginal buyers.
Do Mega-IPOs Signal a Market Top?
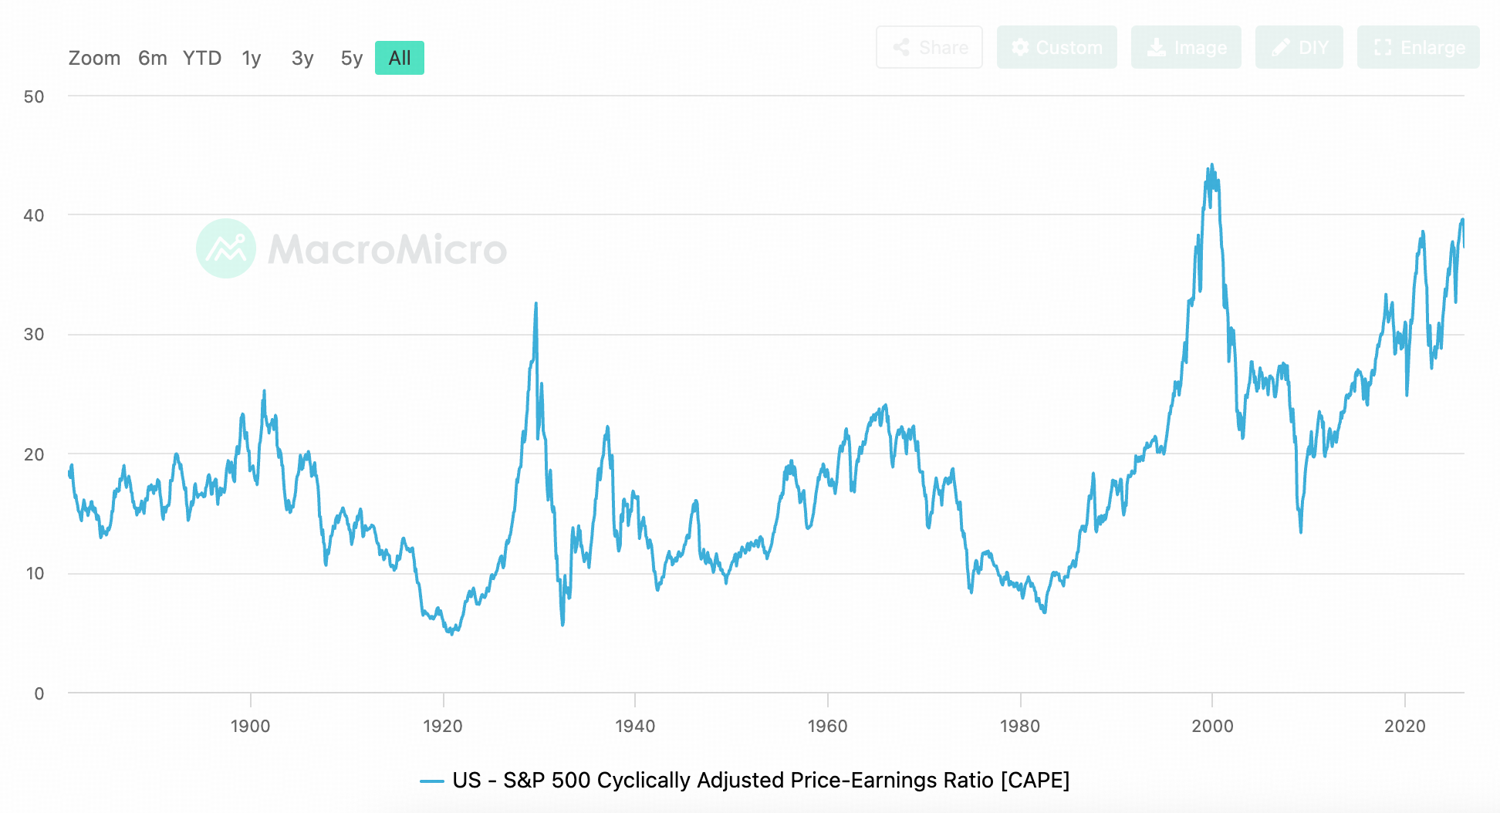
A common view holds that massive public listings signal peak euphoria, as companies and their venture investors rush to go public when sentiment is elevated and valuations are stretched. This argument has some merit: U.S. equity markets remain richly valued even after the recent adjustment related to the Iran war.
The S&P 500 Cyclically Adjusted Price-to-Earnings (CAPE) ratio remains at historically high levels. This metric offers a more comprehensive view of valuation, as it adjusts for inflation and smooth earnings over a 10-year period.
Source: MacroMicro https://en.macromicro.me/series/1632/us-shiller-cape
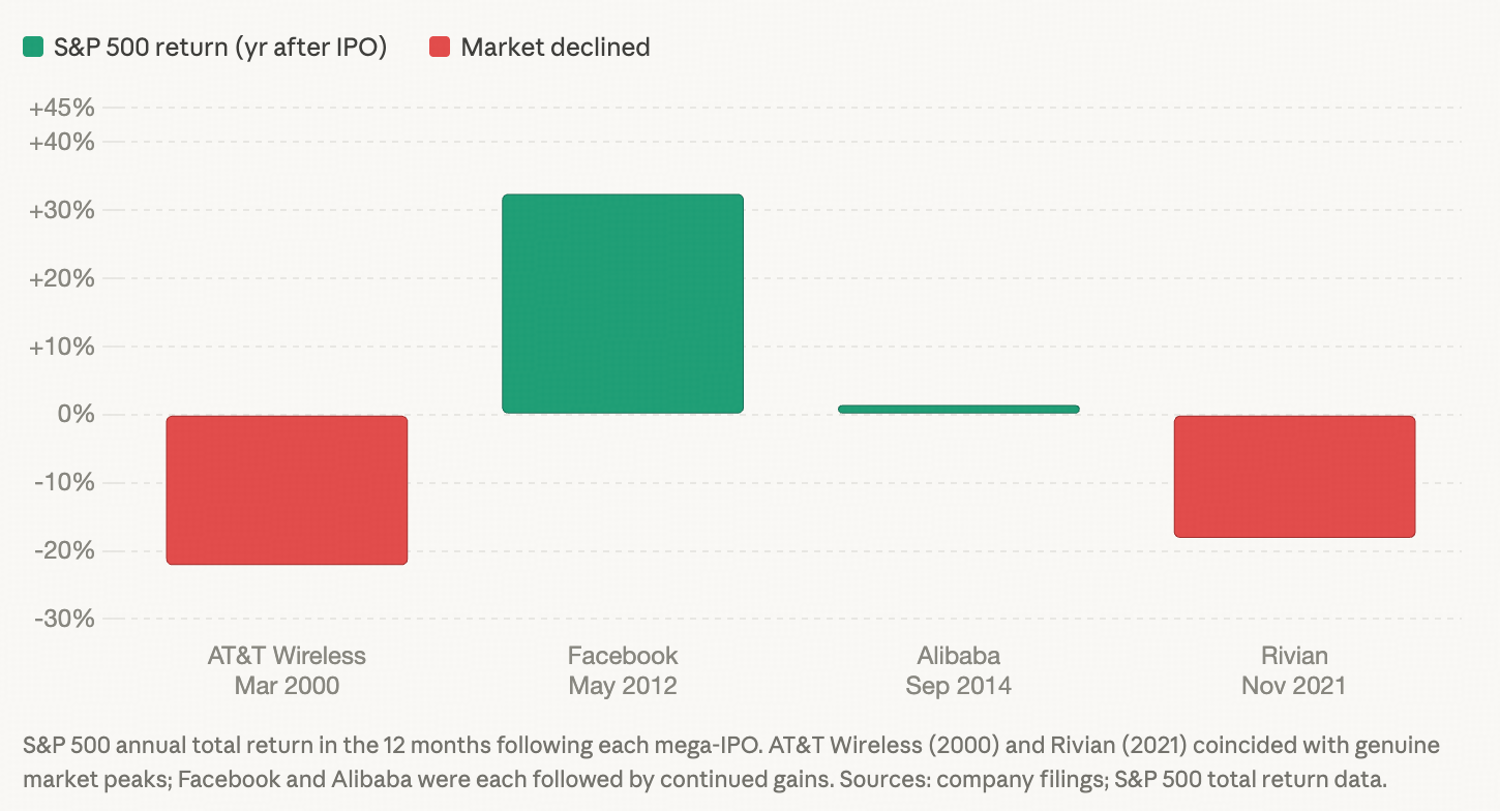
The historical record for whether mega-IPO signal market top is, however, mixed. AT&T in 2000 and Rivian in 2021 each landed near genuine market peaks, the two clearest “yes” cases. But Facebook and Alibaba were each followed by continued market gains. The pattern is that mega-IPO is a symptom of high valuation in the market, a late-cycle sentiment gauge, but not a precise bell marking the market top.
Source: BloFin Research (with help of Claude)
This year’s mega-IPO wave has an additional complicating factor: the current market environment is one of the rotation, not euphoria. In euphoria, all assets rise together, P/E multiples expand everywhere, and risk-on conditions are uniform across equities and crypto.
The current situation is clearly different. Some assets are making new highs while others are already in bear markets, multiple compress in crowded trades, and selectively replaces indiscriminate buying.
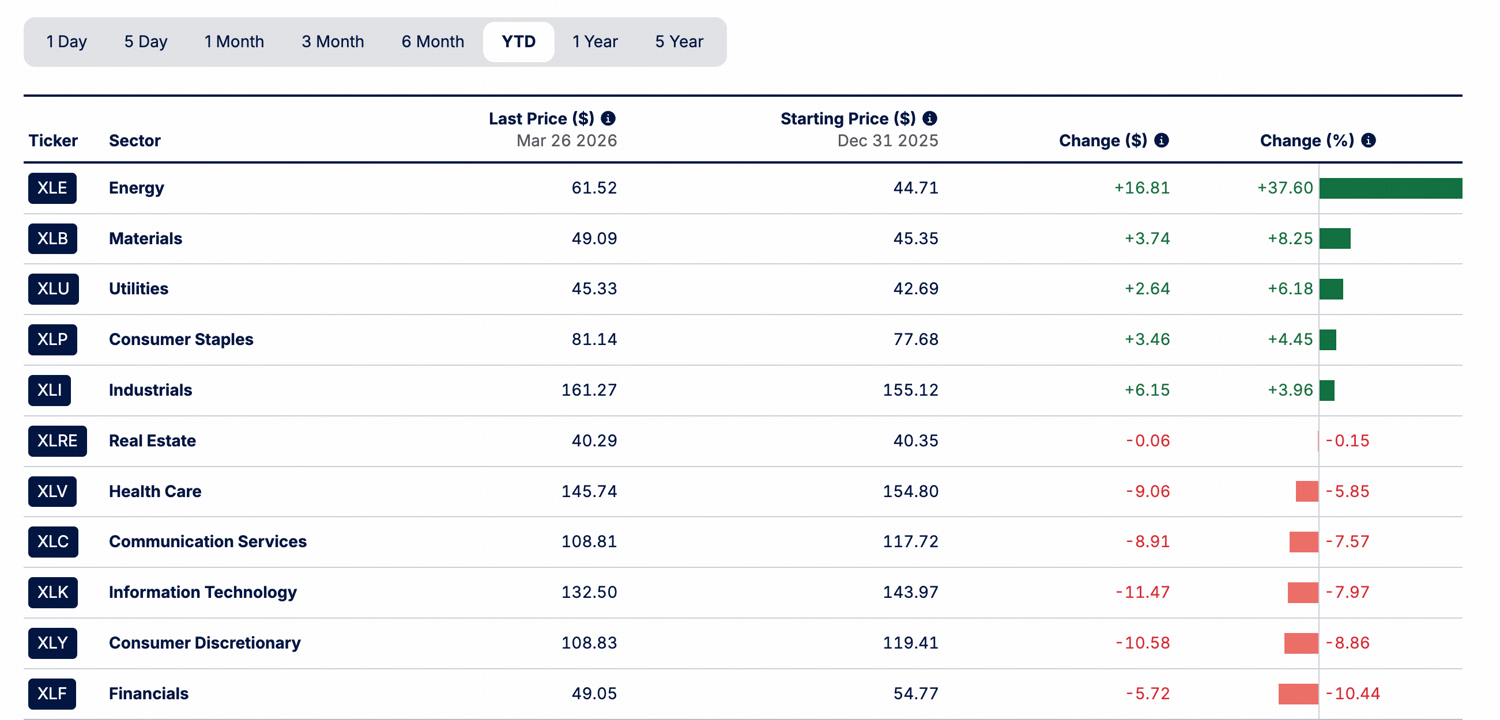
The rotation has direction. Capital is moving out of two categories: assets disrupted by AI, high-valuation software where AI is compressing margins and displacing incumbents, and AI-adjacent names that accumulated large gains over 2023–2025 and now require earnings to justify their multiples. It is moving into assets with physical bottlenecks, where demand is structural and supply is constrained.
Energy is the clearest beneficiary. The current Iran conflict has added a geopolitical risk premium to oil. Beyond energy, basic materials, utilities, and industrials are each benefiting from a convergence of supporting factors that have been absent for most of the past decade. Geopolitically, the U.S. is actively rebuilding its industrial base, reshoring and defense spending are directing capital toward domestic manufacturing capacity. AI development requires physical inputs at scale: copper, steel, electrical transformers, grid infrastructure. These sectors have structurally underperformed technology for years; the conditions that drove that underperformance are now reversing.
Source: Statestreet
The right frame for the overall market is therefore not a broad top but a regime change within equities. Sectors disrupted by AI continue to suffer, IGV is down 23.5% year-to-date. Prior AI listings need to digest their 2023–2025 runs before the next leg. Sectors exposed to physical bottlenecks, energy, materials, utilities, industrials, are in the early stages of a multi-year re-rating. The overall market holds up, but the distribution of returns shifts significantly beneath the surface.
What Does This Mean for Bitcoin?
The impact of these mega-IPOs on Bitcoin is a liquidity story.
Since the spot ETF approvals in January 2024, Bitcoin ETFs have become a significant channel for institutional capital inflows into BTC. Because these ETFs trade within the U.S. equity market, they draw from the same capital pool as mega-IPO allocations. ETF flow data is therefore the most direct indicator of liquidity pressure on Bitcoin during the issuance window.
With the three companies targeting up to $197B in combined capital raises, available market liquidity will face measurable compression. During peak IPO windows, the base case for Bitcoin is trading range-bound, with net ETF flows as the key indicator to watch.
Post-Lockup Recycling Flow
The impact on Bitcoin can reverse materially once lockup periods expire. No S-1 filings have been made by any of the three companies as of late March 2026, so no lockup terms have been formally disclosed. Standard U.S. tech IPO practice is a 180-day lockup from the IPO date. Assuming listings occur in mid-to-late 2026, employee and VC liquidity would begin unlocking in early-to-mid 2027.
That capital historically recycles into venture, angel investing, and speculative assets at above-average rates. The crypto allocation within that recycling is likely higher than in prior tech liquidity cycles. SpaceX holds Bitcoin on its balance sheet, a disclosed treasury position that signals institutional comfort with BTC at the company level. Sam Altman’s World Network (formerly Worldcoin) creates a separate but related crypto linkage from the OpenAI ecosystem.
Disclaimer: The information provided herein does not constitute investment advice, financial advice, trading advice, or any other sort of advice, and should not be treated as such. All content set out below is for informational purposes only.
Recommended Articles


