

XRP Price Eyes Range Break, Bulls Prepare for Upside Move

Source Newsbtc

XRP price started a decent increase above $1.3650. The price is now consolidating gains and might aim for more gains above the $1.3880 zone.

  • XRP price started a steady upward move above the $1.3620 zone.
  • The price is now trading above $1.3650 and the 100-hourly Simple Moving Average.
  • There was a break above a rising channel with resistance at $1.3400 on the hourly chart of the XRP/USD pair (data source from Kraken).
  • The pair could continue to move up if it settles above $1.3880.

XRP Price Aims Key Upside Break

XRP price started a fresh upward move above $1.350 and $1.3550, like Bitcoin and Ethereum. The price gained pace for a clear move above the $1.3620 resistance.

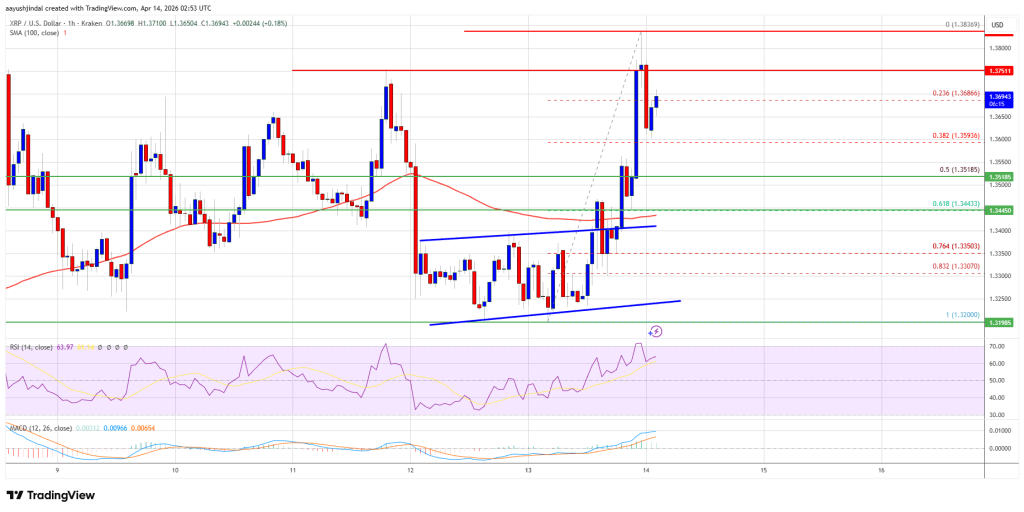
Earlier, there was a break above a rising channel with resistance at $1.3400 on the hourly chart of the XRP/USD pair. The bulls even pumped the price toward the $1.3850 zone. A high was formed at $1.3836, and the price started a minor pullback. There was a drop below the 23.6% Fib retracement level of the upward move from the $1.320 swing low to the $1.3836 high.

The price is now trading above $1.3650 and the 100-hourly Simple Moving Average. If there is a fresh upward move, the price might face resistance near the $1.3750 level.
XRP Price

The first major resistance is near the $1.3850 level, above which the price could rise and test $1.3880. A clear move above the $1.3880 resistance might send the price toward the $1.4120 resistance. Any more gains might send the price toward the $1.4250 resistance. The next major hurdle for the bulls might be near $1.450.

Downside Correction?

If XRP fails to clear the $1.3850 resistance zone, it could start a fresh decline. Initial support on the downside is near the $1.360 level. The next major support is near the $1.3520 level or the 50% Fib retracement level of the upward move from the $1.320 swing low to the $1.3836 high.

If there is a downside break and a close below the $1.3520 level, the price might continue to decline toward $1.3440. The next major support sits near the $1.3320 zone, below which the price could continue lower toward $1.3250. The main support could be $1.3120.

Technical Indicators

Hourly MACD – The MACD for XRP/USD is now gaining pace in the bullish zone.

Hourly RSI (Relative Strength Index) – The RSI for XRP/USD is now above the 50 level.

Major Support Levels – $1.3600 and $1.3520.

Major Resistance Levels – $1.3880 and $1.40.

Disclaimer: For information purposes only. Past performance is not indicative of future results.
placeholder
Gold Price Forecast: Oil Price Breaking $100 Fuels Inflation Concerns, Will Gold Prices Fall Further?As of the Asian session on July 24, gold prices ( XAUUSD) fell continuously during intraday trading, briefly approaching the $4,000 mark. Looking at the chart, gold prices rebounded this
Author  TradingKey
Yesterday 09: 14
As of the Asian session on July 24, gold prices ( XAUUSD) fell continuously during intraday trading, briefly approaching the $4,000 mark. Looking at the chart, gold prices rebounded this
placeholder
Crude Oil Price Forecast: Middle East Tensions Push Up Oil Prices, Can They Still Rise After Breaking $100? Affected by the continuous escalation of geopolitical tensions in the Middle East, Brent crude ( UKOIL) broke back above the psychological $100-per-barrel threshold after two months, as m
Author  TradingKey
Yesterday 09: 14
Affected by the continuous escalation of geopolitical tensions in the Middle East, Brent crude ( UKOIL) broke back above the psychological $100-per-barrel threshold after two months, as m
placeholder
Today’s Market Recap: Oil Breaks $100, Fueling Inflation Fears, as AI Capex Faces Scrutiny and Tesla’s 14% Plunge Drags Down Tech SectorTracking the Market TrendTradingKey - The market was hit by a double whammy of soaring oil prices and doubts about the return on AI investments sparked by increased capital expenditures at Google(GOOG
Author  TradingKey
Yesterday 01: 25
Tracking the Market TrendTradingKey - The market was hit by a double whammy of soaring oil prices and doubts about the return on AI investments sparked by increased capital expenditures at Google(GOOG
placeholder
WTI Crude Breaks $90, Brent Crude Approaches $100, Middle East Shipping Risks Drive Continuous Rise in Oil Prices On July 23, international oil prices continued to rise sharply. WTI crude oil ( USOIL) prices broke through the $90 mark intraday, rising over 4%, while Brent crude oil ( UKOIL) rose to a
Author  TradingKey
Jul 23, Thu
On July 23, international oil prices continued to rise sharply. WTI crude oil ( USOIL) prices broke through the $90 mark intraday, rising over 4%, while Brent crude oil ( UKOIL) rose to a
placeholder
WTI climbs above $87.00 as Middle East conflict threatens key choke pointsWest Texas Intermediate (WTI) oil price extends gains for the fifth consecutive day, trading around $87.30 per barrel during the Asian hours on Thursday. Crude oil prices surged as escalating Middle East tensions stoked fears of widespread supply disruptions.
Author  FXStreet
Jul 23, Thu
West Texas Intermediate (WTI) oil price extends gains for the fifth consecutive day, trading around $87.30 per barrel during the Asian hours on Thursday. Crude oil prices surged as escalating Middle East tensions stoked fears of widespread supply disruptions.
goTop
quote