


Bitcoin Has Hit The Last Bull Trap, But The Accumulation Level Lies Much Lower
A crypto analyst has announced that Bitcoin (BTC) has hit its last bull trap, signaling that the price of the flagship cryptocurrency could fall much further before a potential reversal begins. The analyst has shared a chart highlighting key accumulation areas at levels below $60,000, the lowest price BTC has reached since its all-time high in 2025.
Bitcoin Reaches Final Bull Trap
Following Bitcoin’s rebound over the weekend, a pseudonymous whale and crypto analyst known as NoName shared an update on Bitcoin’s latest price action and what its next moves may be. In a post on X, NoName announced that Bitcoin has recently hit its second and final bull trap since reaching a price peak in 2025.
He shared a video chart showing how the Bitcoin price has moved throughout its ongoing bear market. After a prolonged rally that eventually pushed Bitcoin to an all-time high above $126,700, the market shifted direction and entered a sustained downtrend, marked by multiple corrective waves.
Later during Q1 2026, Bitcoin experienced its first major bull trap. At the time, the price spiked sharply upward, drawing in late buyers and briefly reviving bullish sentiment before quickly reversing and resuming its decline. The move ultimately caught overleveraged traders off guard, leading to significant losses for those who entered near the top.
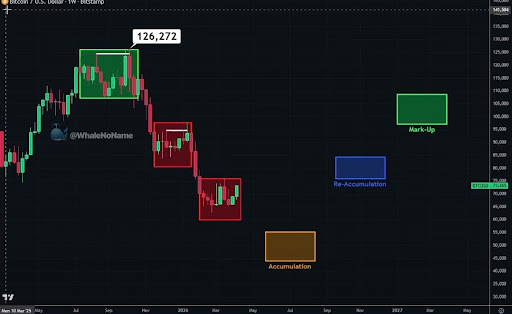
After this initial trap, the price continued to slide and establish lower price levels before forming its latest bull trap this month. Here, BTC surged above $72,000 shortly after the US-Iran ceasefire announcement. The rally held for several days, sustaining optimism slightly, before momentum faded and the price retraced back toward the $70,000 level at the time of writing.
With this last bull trap in place, NoName has stated that Bitcoin’s path has become clearer. The analyst is now anticipating a final downside flush, suggesting that more volatility and pain could lie ahead for BTC. He projects a potential price crash to $50,000, representing a more than 28% drop from its current price and a drawdown of about 60% from BTC’s peak.
Notably, NoName has marked the $50,000 level as a potential accumulation area, and investors and traders could begin entering the market again to prop up their positions.
What’s Next For The BTC Price?
Based on NoName’s analysis, the $50,000 level is likely Bitcoin’s final price bottom before a bullish reversal. Once the cryptocurrency hits this accumulation point, the analyst anticipates an upward move to the next re-accumulation area between $75,000 and $85,000.
After consolidating around this range for a bit, NoName projects that Bitcoin could rise sharply to his “mark-up” target between $95,000 and $110,000, before skyrocketing to a new all-time high above $130,000.
Recommended Articles


