

Ripple Price Forecast: XRP risks extending decline amid extreme fear sentiment, rising uncertainty

Source Fxstreet
  • XRP recovery remains a pipe dream amid dominant risk-averse sentiment.
  • Santiment analysts highlight a possible buy signal as FUD over XRP has reached historically high levels.
  • Retail demand dips further, with futures Open Internet averaging $2.38 billion, significantly below the record $10.94 billion.

Ripple (XRP) is trading sideways around $1.32 at the time of writing on Monday, reflecting a dominant risk-off mood and a technical structure that continues to deteriorate. Retail interest in the remittance token has taken a back seat, with the derivatives market appearing significantly suppressed.

Meanwhile, a higher support level at $1.30 could serve as a basis for another recovery, aligning with Santiment’s analysts’ bullish outlook.

XRP eyes relief rally amid historical FUD levels

XRP is facing historically high fear, uncertainty and doubt (FUD) levels, according to Santiment’s analysts, who believe that “when bullish comments get replaced by this level of bearish ones, the probability of a relief rally climbs significantly higher.”

Investors appear to have retreated to the sidelines, following XRP’s roughly 64% drawdown from its record high of $3.66, reached in July. Persistent bearish sentiment tends to create opportunities for investors to reenter the market at lower price levels, increasing the likelihood of a sustained recovery.
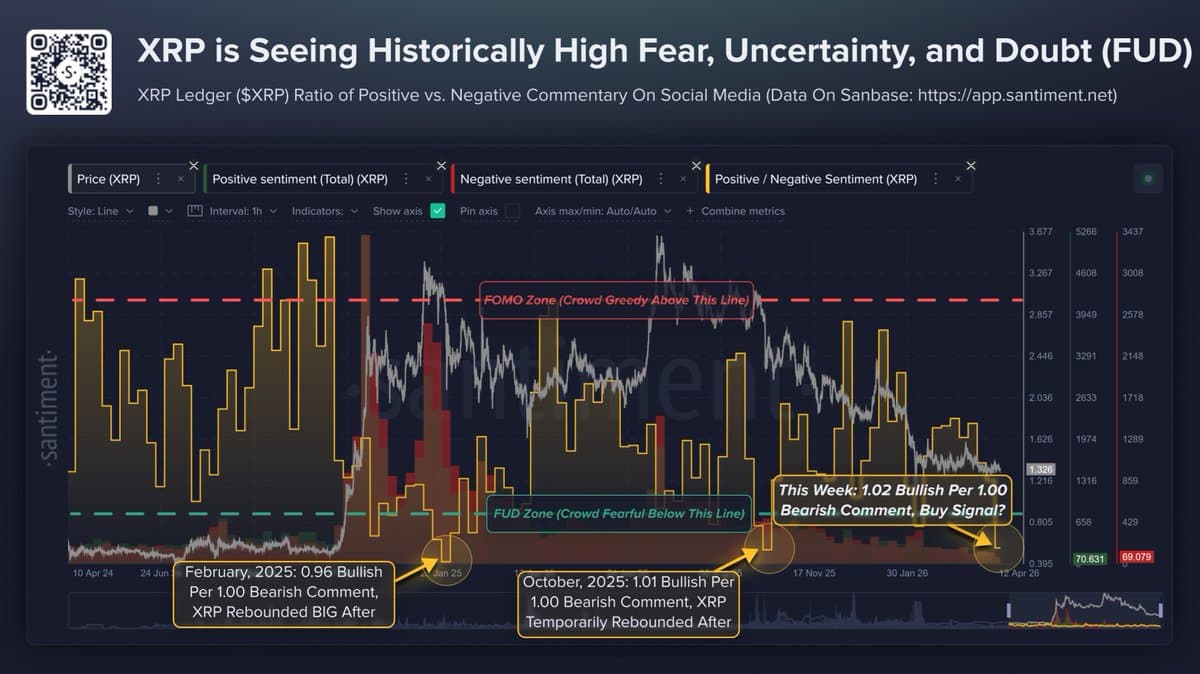
XRP FUD data | Source: Santiment

Meanwhile, retail demand for XRP derivatives continues to fade, as futures OI averages $2.38 billion on Monday, down from to $2.48 billion the previous day. The OI surged to $10.94 billion in July, coinciding with the price rallying to an all-time high of $3.66.

Notably, the persistent decline in the OI suggests that investors are losing conviction in XRP’s ability to sustain recovery and are unwilling to open new positions.
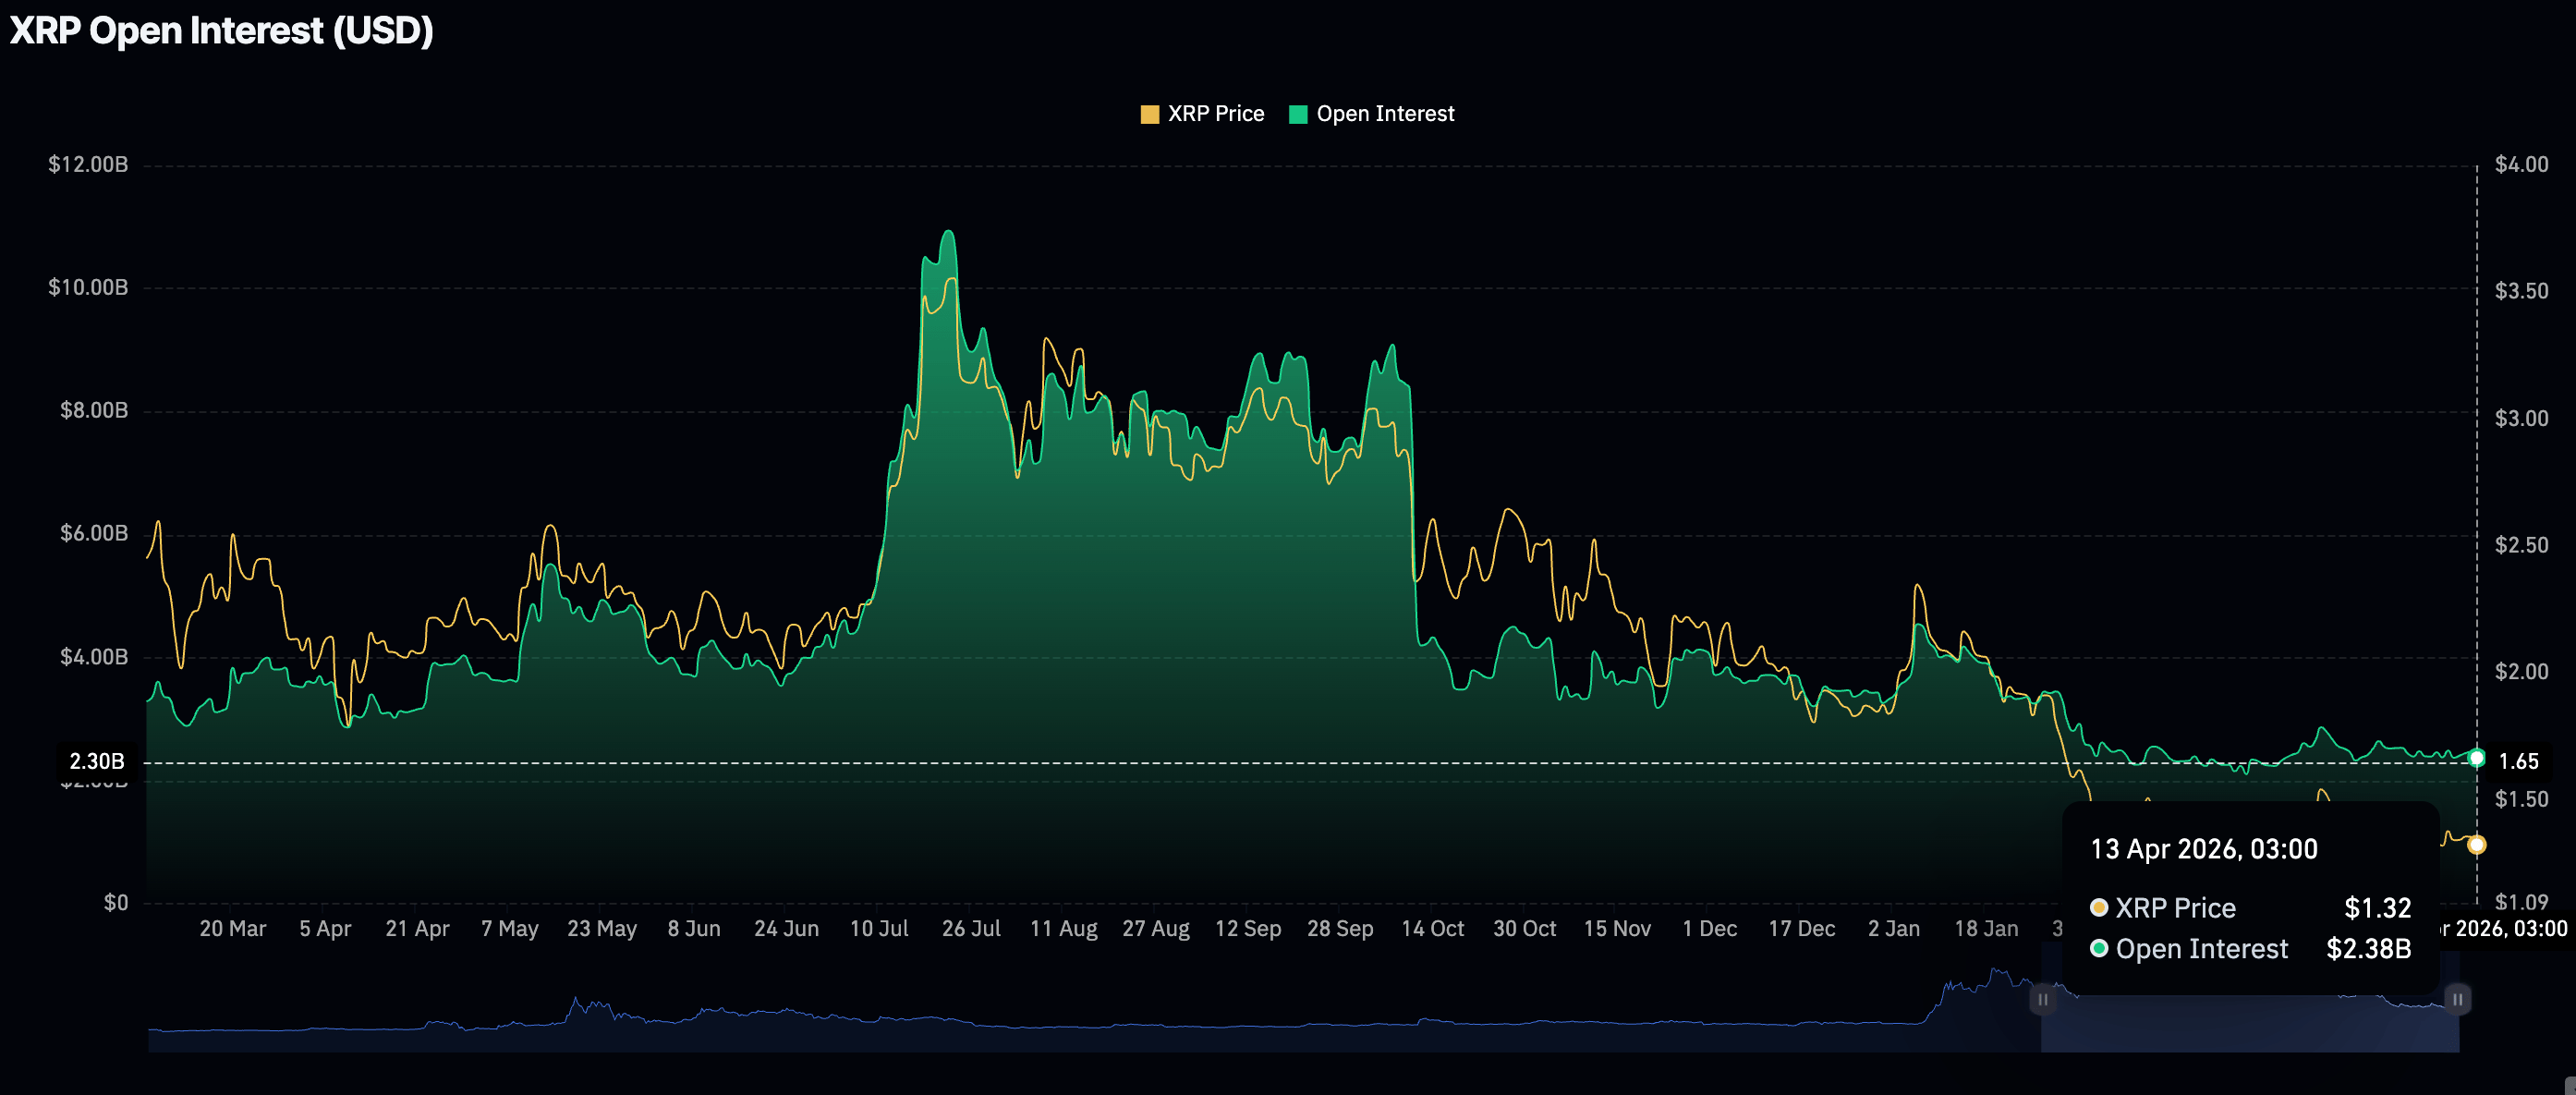
XRP Futures OI | Source: CoinGlass

Technical outlook: XRP holds steady, but gains remain constrained

XRP trades at $1.32, maintaining a bearish near-term bias as price holds beneath the 50-day, 100-day, and 200-day Exponential Moving Averages (EMAs) at roughly $1.41, $1.56, and $1.81, respectively.

The persistent cap from this stacked moving band and the broader descending trendline resistance near $1.74 suggests rallies remain corrective. At the same time, the Relative Strength Index (RSI) is hovering around 43 on the daily chart, suggesting subdued buying interest, while the Moving Average Convergence Divergence (MACD) line and the signal line remain slightly below the neutral level, with a marginally positive histogram.
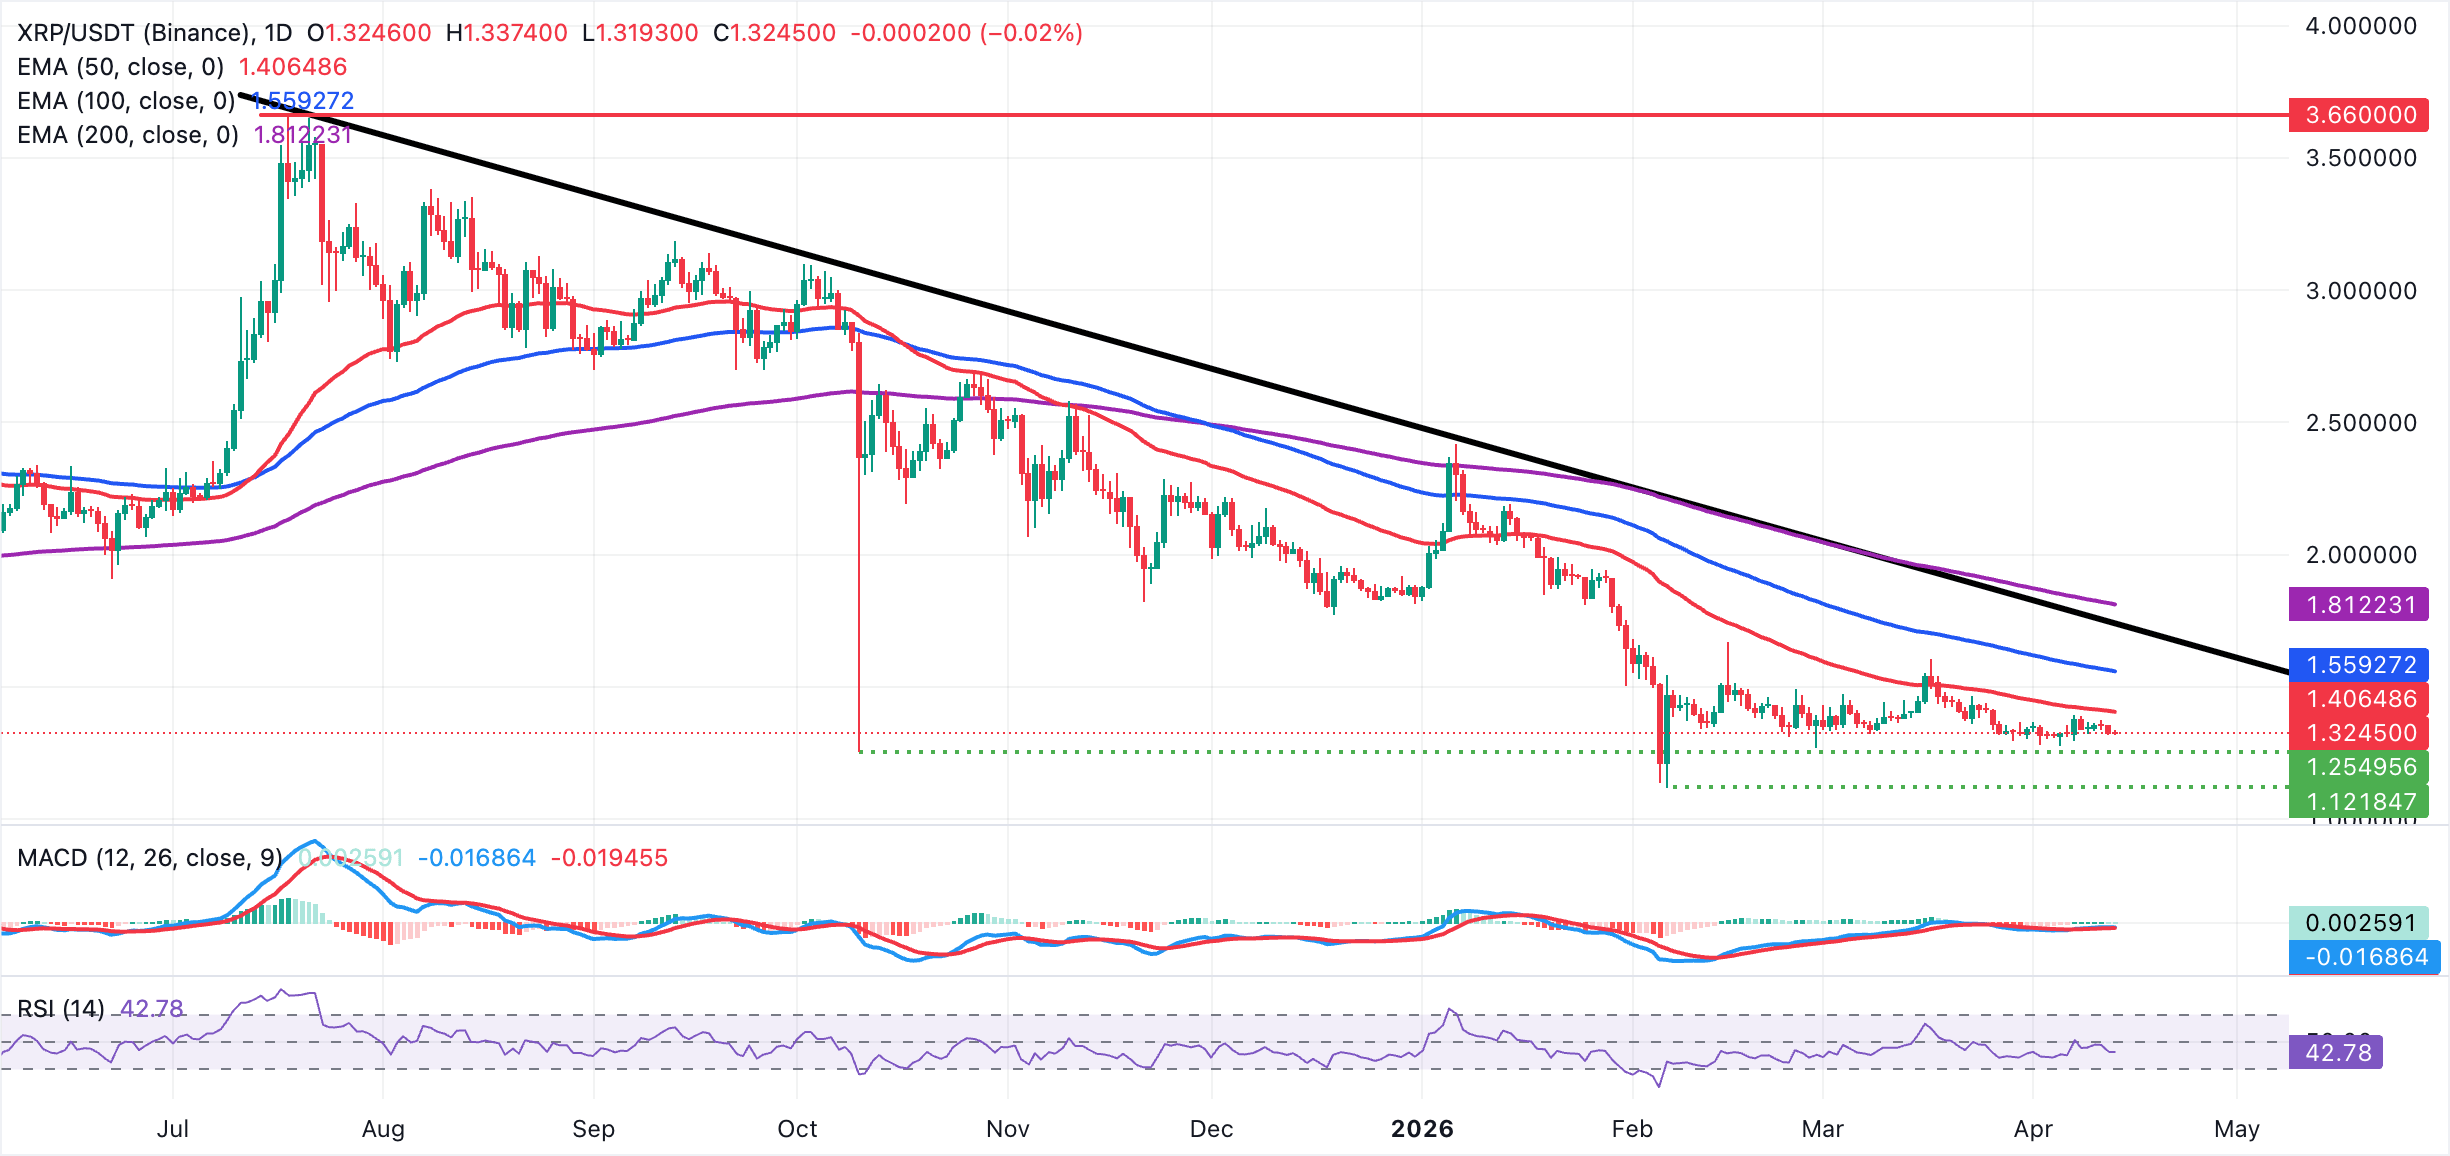
XRP/USDT daily chart

On the topside, XRP's initial resistance is seen at the 50-day EMA at $1.41 with further barriers at the 100-day EMA around $1.56 and the descending trendline near $1.74, before the longer-term 200-day EMA at $1.81 comes into play. With no clearly defined major moving-average or structural supports immediately below the spot in this dataset, any fresh downside extension would leave the remittance vulnerable to discovering new demand levels below the $1.30 threshold unless buyers can quickly reclaim the 50-day EMA and reduce the weight of the prevailing downtrend.

Open Interest, funding rate FAQs

Higher Open Interest is associated with higher liquidity and new capital inflow to the market. This is considered the equivalent of increase in efficiency and the ongoing trend continues. When Open Interest decreases, it is considered a sign of liquidation in the market, investors are leaving and the overall demand for an asset is on a decline, fueling a bearish sentiment among investors.

Funding fees bridge the difference between spot prices and prices of futures contracts of an asset by increasing liquidation risks faced by traders. A consistently high and positive funding rate implies there is a bullish sentiment among market participants and there is an expectation of a price hike. A consistently negative funding rate for an asset implies a bearish sentiment, indicating that traders expect the cryptocurrency’s price to fall and a bearish trend reversal is likely to occur.

(The technical analysis of this story was written with the help of an AI tool.)

Disclaimer: For information purposes only. Past performance is not indicative of future results.
placeholder
Bitcoin squeezes back above $80,000 — 110,000 traders liquidated as the hawkish Fed and CLARITY setback fail to hold it down; is $83,000 next?Bitcoin closed above $80,000 on Friday for the first time since September 7, and pushed to $81,299 over the weekend, triggering about $603 million of liquidations — $523 million of them shorts — across more than 110,000 traders. With the Fed's hike already priced and the SEC and CFTC advancing crypto rules after the CLARITY Act failed, here is what stands between BTC and the $83,000 gate.
Author  Suzie
13 hours ago
Bitcoin closed above $80,000 on Friday for the first time since September 7, and pushed to $81,299 over the weekend, triggering about $603 million of liquidations — $523 million of them shorts — across more than 110,000 traders. With the Fed's hike already priced and the SEC and CFTC advancing crypto rules after the CLARITY Act failed, here is what stands between BTC and the $83,000 gate.
placeholder
Gold ends three-week slide at the $4,400 line — eight straight days of ETF inflows vs a 5% 10-year and a 100 dollarSpot gold closed Friday at $4,378.39, up 0.84% on the day and about 0.8% for the week — its first weekly gain in four weeks — with the intraday high of $4,399.67 leaving it 33 cents shy of the $4,400 line. Gold ETFs have now logged eight straight sessions of inflows, but with the 10-year back above 5% and the dollar index near 100, here is what decides whether this is a reversal or a bounce.
Author  Suzie
13 hours ago
Spot gold closed Friday at $4,378.39, up 0.84% on the day and about 0.8% for the week — its first weekly gain in four weeks — with the intraday high of $4,399.67 leaving it 33 cents shy of the $4,400 line. Gold ETFs have now logged eight straight sessions of inflows, but with the 10-year back above 5% and the dollar index near 100, here is what decides whether this is a reversal or a bounce.
placeholder
Have Fed Rate Hike Headwinds Been Priced In? Gold Rebounds Strongly Toward $4,400, Poised for a New Rally As of the European session on September 18, gold prices (XAUUSD) extended Thursday's rebound, rising strongly in intraday trading to $4,399.75 today, just shy of the $4,400 psychological
Author  TradingKey
Sep 18, Fri
As of the European session on September 18, gold prices (XAUUSD) extended Thursday's rebound, rising strongly in intraday trading to $4,399.75 today, just shy of the $4,400 psychological
placeholder
US to delay new "overcapacity" tariffs on China — what the pause means for trade, inflation and the dollarWashington is expected to hold off announcing new tariffs over Chinese "overcapacity" until after the 24 September summit, according to Bloomberg. The postponed plan would have added 7.5% to Chinese goods, taking second-term US tariffs to around 20%. Here is what is on the table, and what a deal versus no deal would mean for the yuan, Hong Kong equities and the dollar.
Author  Mitrade
Sep 18, Fri
Washington is expected to hold off announcing new tariffs over Chinese "overcapacity" until after the 24 September summit, according to Bloomberg. The postponed plan would have added 7.5% to Chinese goods, taking second-term US tariffs to around 20%. Here is what is on the table, and what a deal versus no deal would mean for the yuan, Hong Kong equities and the dollar.
placeholder
Gold rebounds to near $4,350 on weaker US Dollar, falling oil pricesGold price (XAU/USD) rises to near $4,345 during the early Asian session on Friday. The precious metal rebounds from a six-week low amid falling oil prices and a weaker US Dollar (USD). Traders continue to assess the latest Federal Reserve (Fed) rate hike and policy cues.
Author  FXStreet
Sep 18, Fri
Gold price (XAU/USD) rises to near $4,345 during the early Asian session on Friday. The precious metal rebounds from a six-week low amid falling oil prices and a weaker US Dollar (USD). Traders continue to assess the latest Federal Reserve (Fed) rate hike and policy cues.
Related Instrument
goTop
quote