

Pi Network Price Forecast: PI extends gradual downtrend amid risk-off markets, lack of catalysts

Source Fxstreet
  • Pi Network shows muted consolidation above $0.1600 on Monday as downside risk persists.
  • Investor confidence weakens as CEXs record roughly 2 million PI tokens in inflows over the past 24 hours, suggesting a near-term sell-off.
  • The technical outlook for PI is bearish, pointing a path of least resistance toward $0.1556. 

Pi Network (PI) trades below $0.1700 at press time on Monday, gradually losing ground amid a consolidation phase. Centralized Exchanges (CEXs) recorded roughly 2 million PI tokens in deposits over the last 24 hours, suggesting a sell-off amid a broader risk-off sentiment in the cryptocurrency market. The lack of catalysts for the PI token risks an extended decline toward the immediate support at $0.1556.

Pi Network weakens amid persistent selling 

Pi Network remains under selling pressure amid the broader market risk-off sentiment linked to the US and Iran not reaching a deal to end the war in their direct peace talks in Pakistan. The failed negotiations between the two countries have led to a US-led blockade of all maritime traffic passing through the Strait of Hormuz.

PiScan data shows 1.92 million PI tokens were deposited on CEXs over the last 24 hours, suggesting that the Know-Your-Customer (KYC) verified mainnet users are trimming their holdings.
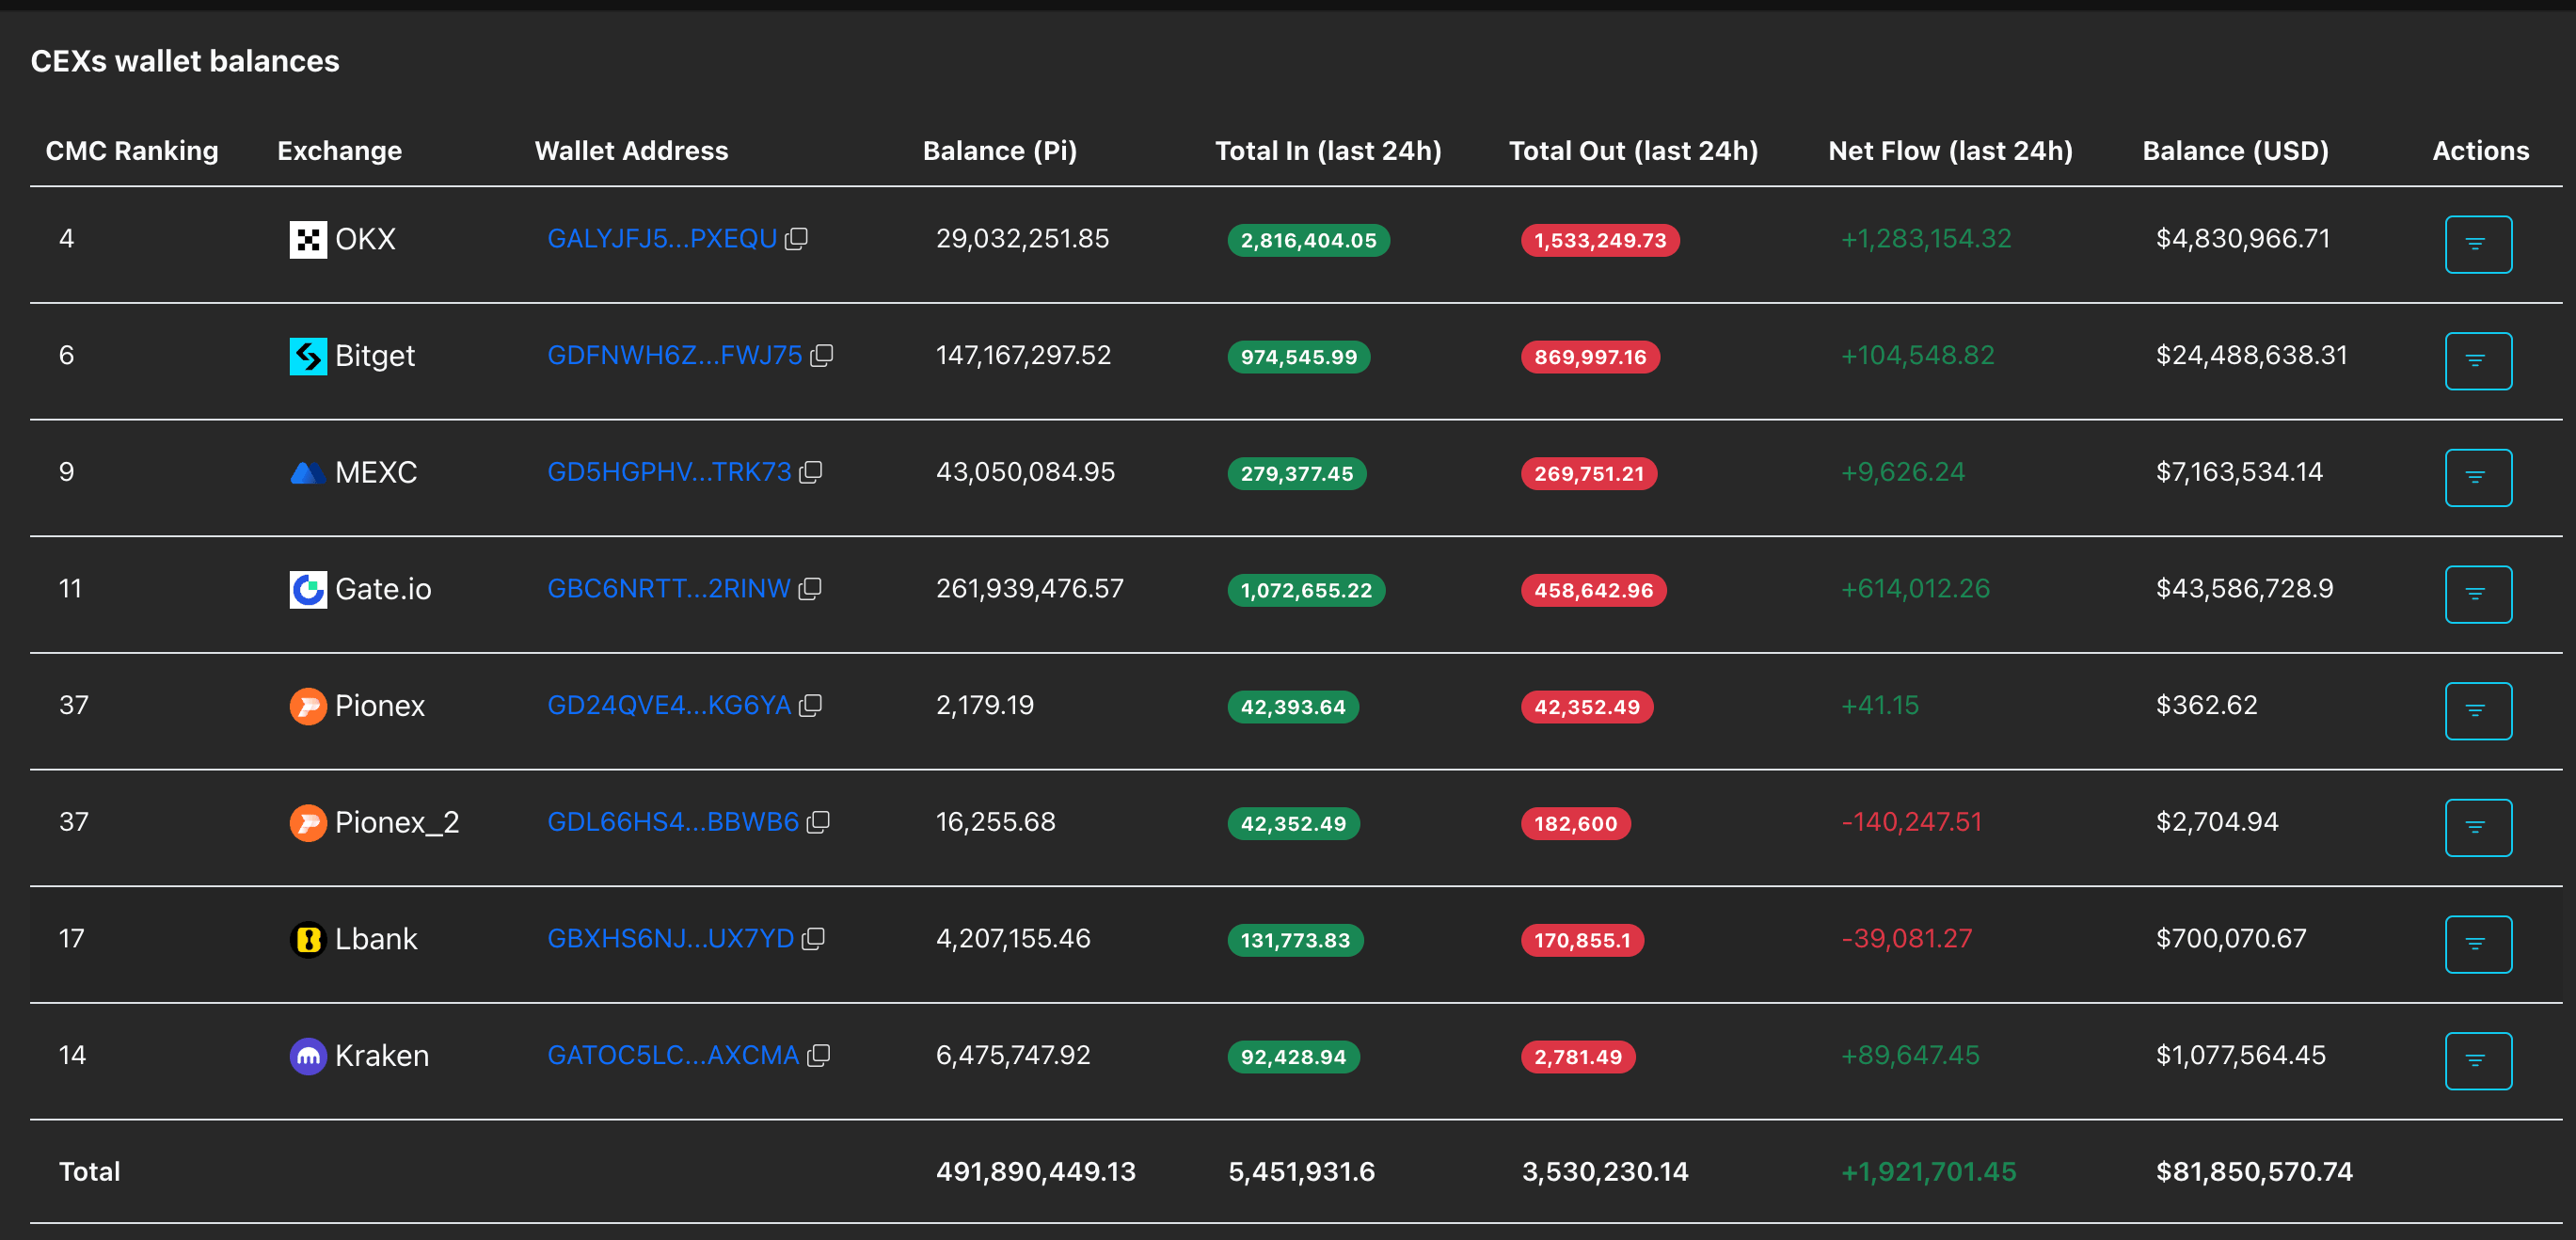
Pi Network CEXs wallet balances. Source: PiScan

The lack of catalysts for the PI token adds to the selling pressure as Pi Network shows significant community support despite the lack of clarity over KYC, tokenomics, and roadmaps. The upcoming Consensus 2026 event by CoinDesk on May 5-7 could provide a boost, as Pi Network Co-founder Chengdiao Fan is scheduled to give a 20-minute talk on May 6 titled “Aligning web3, AI, and blockchain for utility.”

Typically, the spot price follows a “buy the hype, sell the news” pattern ahead of such talks, suggesting a positive rally could occur days before the event, followed by a sell-off.

Is Pi Network doomed for an extended correction?

Pi Network maintains a bearish near-term bias as price consolidates below the 50-day and 100-day Exponential Moving Averages (EMAs) at $0.1800 and $0.1898, respectively.

The Relative Strength Index (RSI) on the daily chart hovers below the midline near 41, suggesting a bearish trend. Meanwhile, the Moving Average Convergence Divergence (MACD) histogram bars on the same chart remain marginally negative, while the MACD and signal line move closer, hinting at persistent but not yet exhausted downside pressure.

On the downside, the closest meaningful support comes at the February 23 low at $0.1556. A failure to bounce back from this level would keep the PI token vulnerable to further declines within the prevailing downbeat setup.

Chart Analysis PI/USD (baha Crypto)
PI/USD daily price chart.

On the topside, initial resistance is seen at the 50-day EMA at $0.1800, with a stronger barrier higher at the 100-day EMA around $0.1898, which would need to be reclaimed to ease the broader bearish tone.

(The technical analysis of this story was written with the help of an AI tool.)

Disclaimer: For information purposes only. Past performance is not indicative of future results.
placeholder
Bitcoin falls below $75,000 as the CLARITY Act fails in the Senate — what the vote means for cryptoThe US Senate blocked the Digital Asset Market CLARITY Act in a 49-50 procedural vote, sending Bitcoin briefly below $75,000 — its biggest one-day drop since June. Ethereum fell more than 8%, Coinbase slid 10% and $75 billion of crypto market value evaporated. Here is what the vote was, why it failed, and the levels that matter now.
Author  Suzie
Sep 16, Wed
The US Senate blocked the Digital Asset Market CLARITY Act in a 49-50 procedural vote, sending Bitcoin briefly below $75,000 — its biggest one-day drop since June. Ethereum fell more than 8%, Coinbase slid 10% and $75 billion of crypto market value evaporated. Here is what the vote was, why it failed, and the levels that matter now.
placeholder
Dollar index tops 100 for the first time since July as the Fed's hawkish dot plot sinks inThe U.S. dollar index broke back above 100 for the first time since 31 July after the Fed delivered its first rate hike since 2023, with the dot plot showing 16 of 18 officials expect at least one more increase this year. Here are the levels that matter for DXY, the currencies feeling it most, and what to watch next.
Author  Irene Q.
Sep 17, Thu
The U.S. dollar index broke back above 100 for the first time since 31 July after the Fed delivered its first rate hike since 2023, with the dot plot showing 16 of 18 officials expect at least one more increase this year. Here are the levels that matter for DXY, the currencies feeling it most, and what to watch next.
placeholder
Gold rebounds to near $4,350 on weaker US Dollar, falling oil pricesGold price (XAU/USD) rises to near $4,345 during the early Asian session on Friday. The precious metal rebounds from a six-week low amid falling oil prices and a weaker US Dollar (USD). Traders continue to assess the latest Federal Reserve (Fed) rate hike and policy cues.
Author  FXStreet
Sep 18, Fri
Gold price (XAU/USD) rises to near $4,345 during the early Asian session on Friday. The precious metal rebounds from a six-week low amid falling oil prices and a weaker US Dollar (USD). Traders continue to assess the latest Federal Reserve (Fed) rate hike and policy cues.
placeholder
Gold ends three-week slide at the $4,400 line — eight straight days of ETF inflows vs a 5% 10-year and a 100 dollarSpot gold closed Friday at $4,378.39, up 0.84% on the day and about 0.8% for the week — its first weekly gain in four weeks — with the intraday high of $4,399.67 leaving it 33 cents shy of the $4,400 line. Gold ETFs have now logged eight straight sessions of inflows, but with the 10-year back above 5% and the dollar index near 100, here is what decides whether this is a reversal or a bounce.
Author  Suzie
19 hours ago
Spot gold closed Friday at $4,378.39, up 0.84% on the day and about 0.8% for the week — its first weekly gain in four weeks — with the intraday high of $4,399.67 leaving it 33 cents shy of the $4,400 line. Gold ETFs have now logged eight straight sessions of inflows, but with the 10-year back above 5% and the dollar index near 100, here is what decides whether this is a reversal or a bounce.
placeholder
Bitcoin squeezes back above $80,000 — 110,000 traders liquidated as the hawkish Fed and CLARITY setback fail to hold it down; is $83,000 next?Bitcoin closed above $80,000 on Friday for the first time since September 7, and pushed to $81,299 over the weekend, triggering about $603 million of liquidations — $523 million of them shorts — across more than 110,000 traders. With the Fed's hike already priced and the SEC and CFTC advancing crypto rules after the CLARITY Act failed, here is what stands between BTC and the $83,000 gate.
Author  Suzie
19 hours ago
Bitcoin closed above $80,000 on Friday for the first time since September 7, and pushed to $81,299 over the weekend, triggering about $603 million of liquidations — $523 million of them shorts — across more than 110,000 traders. With the Fed's hike already priced and the SEC and CFTC advancing crypto rules after the CLARITY Act failed, here is what stands between BTC and the $83,000 gate.
goTop
quote