

Top 3 Price Prediction: Bitcoin, Ethereum, Ripple – BTC, ETH and XRP rally after the US-Iran two-week ceasefire

Source Fxstreet
  • Bitcoin price nears the upper channel boundary on Wednesday; a breakout would suggest a bullish move.
  • Ethereum trades above key resistance after a rally of over 6% this week.
  • XRP approaches its 50-day EMA at $1.42, where a close above could extend further gains.

Bitcoin (BTC), Ethereum (ETH) and Ripple (XRP) extend their recovery on Wednesday, supported by improving risk sentiment following the announcement of a two-week ceasefire between the US and Iran. The easing of geopolitical tensions boosted risk appetite across the market, with BTC climbing to $72,000, ETH to $2,200, and XRP to $1.38.

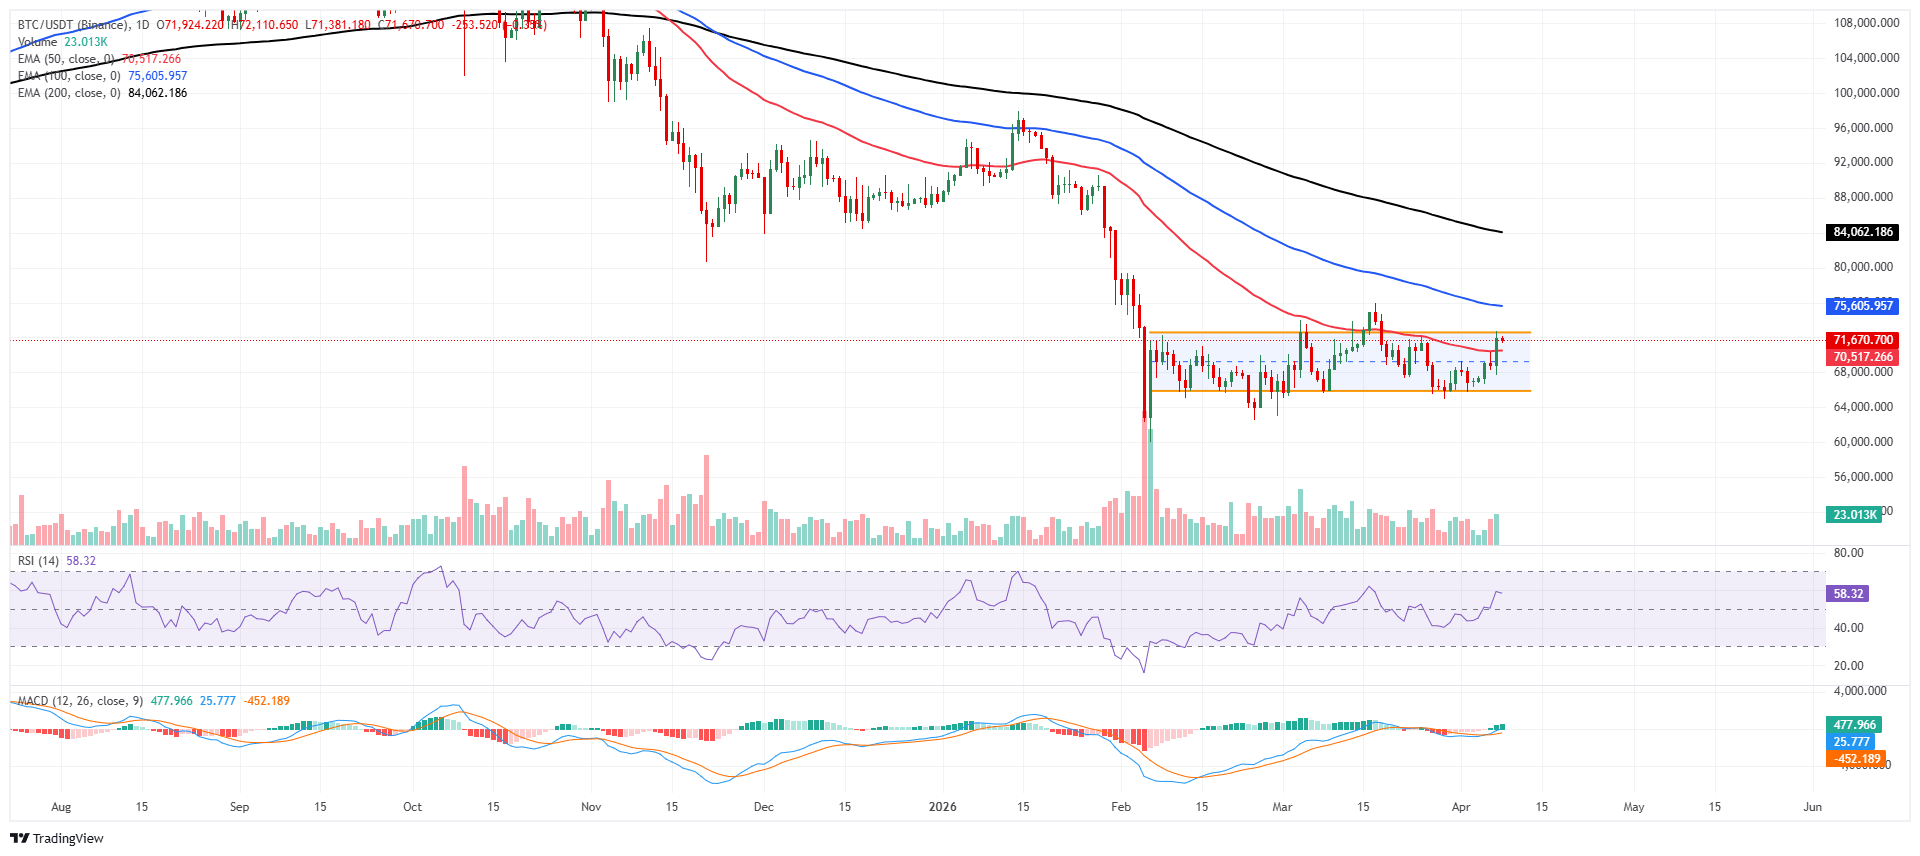
Bitcoin nears the upper boundary of the parallel channel

Bitcoin price is trading at $71,600 on Wednesday, up over 4% from the previous day. BTC holds in the upper half of a channel capped near $72,600, keeping a mildly bullish near-term bias within a broader corrective structure. BTC has reclaimed the 50-day Exponential Moving Average around $70,500, turning it into dynamic support and aligning with improving tone in the Moving Average Convergence Divergence (MACD) histogram, which has flipped positive as the MACD line advances above the signal line while both hover near the zero mark. The Relative Strength Index (RSI) around 58 remains above its midline, signaling that buyers retain momentum.

Initial resistance emerges at the channel top near $72,600, with a daily close above this barrier opening the way toward the recent swing high in the $74,800 region. A failure under $72,600 would keep BTC confined to the channel, with immediate support at the reclaimed 50-day EMA near $70,500, followed by $69,900, where recent lows cluster. 

Below there, the lower boundary of the descending channel around $65,900 serves as a more significant downside pivot, reinforced by the broader uptrend implied by the much higher 100- and 200-day exponential moving averages.
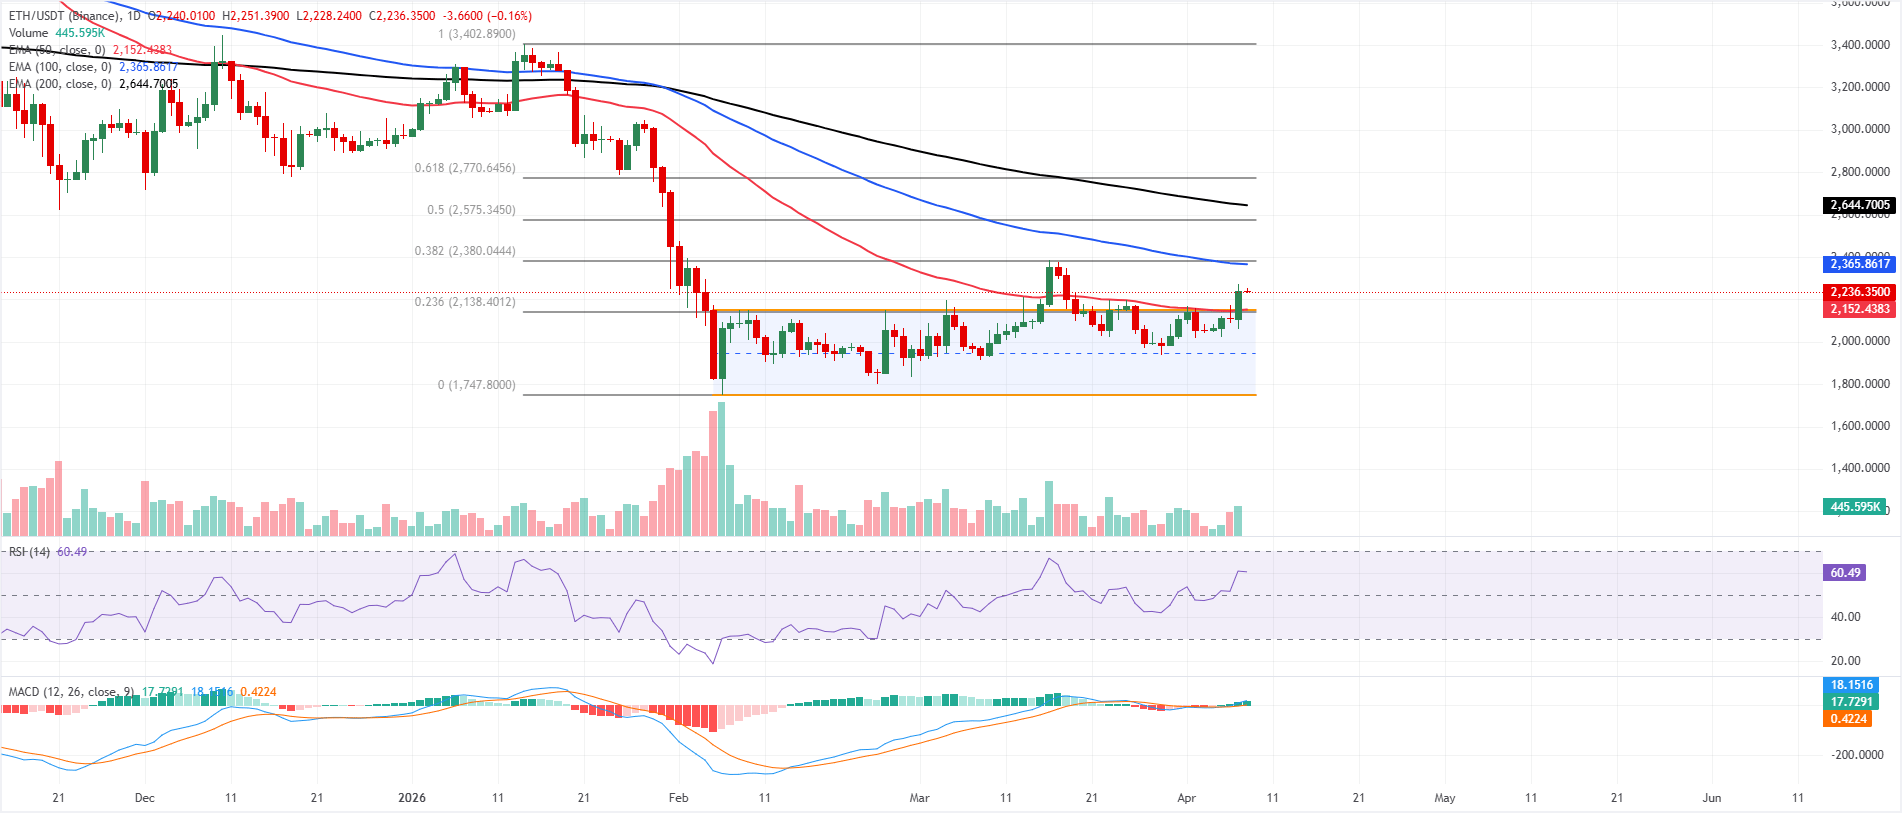
Ethereum closes above key resistance zone

Ethereum price is trading above $2,200 on Wednesday after rallying over 6% in the previous day. The near-term bias is cautiously bullish as price grinds higher off the $1,747 low while closing above the upper boundary of the channel that has capped advances since early February. ETH trades above the 50-day EMA near $2,150, but remains well below the 100-day and 200-day EMAs, which still frame a broader downtrend.

Momentum has improved, with the RSI on the daily chart holding around 60 and the MACD line extending above its signal in positive territory, suggesting buyers retain the initiative despite overhead structural resistance.

Initial support emerges at the 23.6% Fibonacci retracement of the $3,402 to $1,747 decline at $2,138, aligning with the broken 50-day EMA to form a pivotal floor for the nascent recovery. A break below this area would expose the channel midpoint, followed by the lower boundary near $1,750. 

On the topside, immediate resistance stands the 38.2% retracement at $2,380, where the falling 100-day EMA converges to reinforce supply. A daily close above $2,380 would signal growing bullish conviction and open the way toward the 50% retracement at $2,575 as the next upside objective.
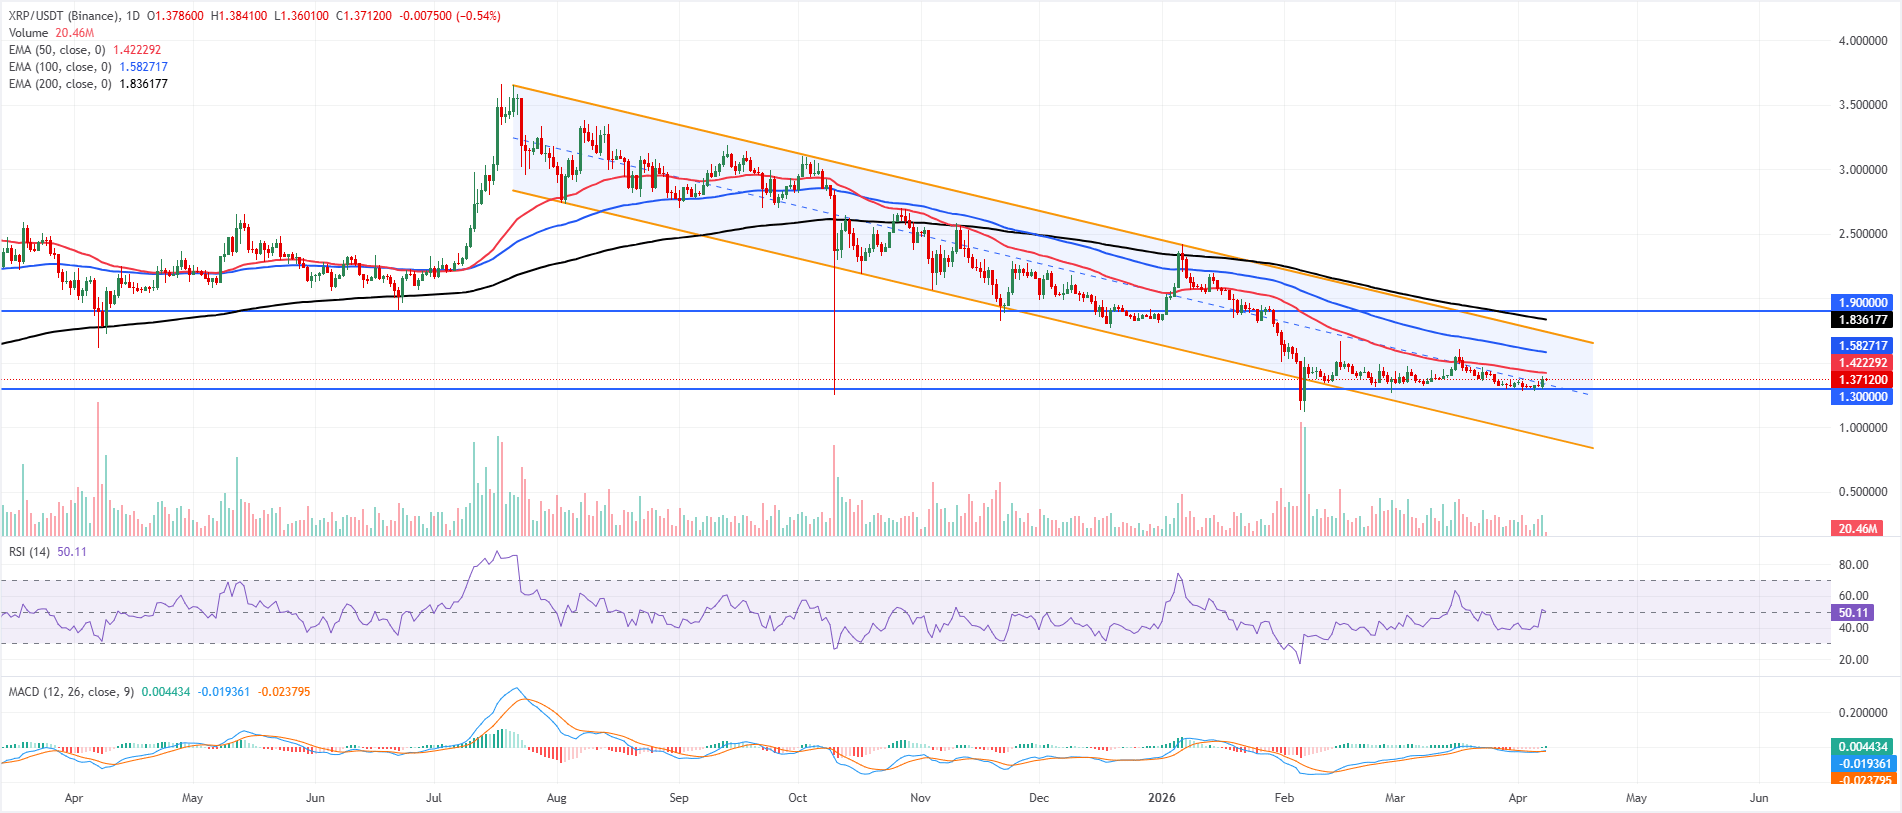
XRP rebounds after finding support around the $1.30 level

XRP price is trading at $1.37 on Wednesday, up 4.35% from the previous day. XRP remains embedded in a descending channel from above $2.80, keeping the broader structure bearish while price holds well below the upper boundary near $1.74. Daily closes continue to track under the clustered 50-day, 100-day and 200-day EMAs, reinforcing downside pressure despite last session’s modest rebound. 

Momentum stabilizes rather than improves, with the RSI on the daily chart hovering near 50 and the MACD indicator edging back above its signal line but still near the zero mark, suggesting a weak recovery attempt within a dominant downtrend.

Initial support lies at the $1.30 horizontal level, where a break would reopen the lower half of the descending channel and expose the $0.93 region defined by the channel floor. Holding above $1.30 would leave scope for a corrective bounce toward the $1.40–$1.45 area, where the descending channel mid-zone aligns with recent closing congestion. The first meaningful resistance sits near the 50-day EMA around $1.42, followed by the channel cap near $1.74, while the more distant horizontal barrier at $1.9000 marks a pivotal level that bulls would need to reclaim to challenge the prevailing bearish bias.
(The technical analysis of this story was written with the help of an AI tool.)

Cryptocurrency prices FAQs

Token launches influence demand and adoption among market participants. Listings on crypto exchanges deepen the liquidity for an asset and add new participants to an asset’s network. This is typically bullish for a digital asset.

A hack is an event in which an attacker captures a large volume of the asset from a DeFi bridge or hot wallet of an exchange or any other crypto platform via exploits, bugs or other methods. The exploiter then transfers these tokens out of the exchange platforms to ultimately sell or swap the assets for other cryptocurrencies or stablecoins. Such events often involve an en masse panic triggering a sell-off in the affected assets.

Macroeconomic events like the US Federal Reserve’s decision on interest rates influence crypto assets mainly through the direct impact they have on the US Dollar. An increase in interest rate typically negatively influences Bitcoin and altcoin prices, and vice versa. If the US Dollar index declines, risk assets and associated leverage for trading gets cheaper, in turn driving crypto prices higher.

Halvings are typically considered bullish events as they slash the block reward in half for miners, constricting the supply of the asset. At consistent demand if the supply reduces, the asset’s price climbs.

Disclaimer: For information purposes only. Past performance is not indicative of future results.
placeholder
Natural Gas sinks to pivotal level as China’s demand slumpsNatural Gas price (XNG/USD) edges lower and sinks to $2.56 on Monday, extending its losing streak for the fifth day in a row. The move comes on the back of China cutting its Liquified Natural Gas (LNG) imports after prices rose above $3.0 in June. It
Author  FXStreet
Jul 01, 2024
Natural Gas price (XNG/USD) edges lower and sinks to $2.56 on Monday, extending its losing streak for the fifth day in a row. The move comes on the back of China cutting its Liquified Natural Gas (LNG) imports after prices rose above $3.0 in June. It
placeholder
Bitcoin briefly loses 2025 gains as crypto plunges over the weekend.Bitcoin experienced a sharp decline this weekend, briefly erasing its 2025 gains and dipping below its year-opening value of $93,507. The cryptocurrency fell to a low of $93,029 on Sunday, representing a 25% drop from its all-time high in October. Although it has rebounded slightly to around $94,209, the pressures on the market remain significant. The downturn occurred despite the reopening of the U.S. government on Thursday, which many had hoped would provide essential support for crypto markets. This year initially appeared promising for cryptocurrencies, particularly after the inauguration of President Donald Trump, who has established the most pro-crypto administration thus far. However, ongoing political tensions—including Trump's tariff strategies and the recent government shutdown, lasting a historic 43 days—have contributed to several rapid price pullbacks for Bitcoin throughout the year. Market dynamics are also being influenced by Bitcoin whales—investors holding large amounts of Bitcoin—who have been offloading portions of their assets, consequently stalling price rallies even as positive regulatory developments emerge. Despite these sell-offs, analysts from Glassnode argue that this behavior aligns with typical patterns seen among long-term investors during the concluding stages of bull markets, suggesting it is not indicative of a mass exodus. Notably, Bitcoin is not alone in its struggles, as Ethereum and Solana have also recorded declines of 7.95% and 28.3%, respectively, since the start of the year, while numerous altcoins have faced even steeper losses. Looking ahead, questions linger regarding the viability of the four-year cycle thesis, particularly given the increasing institutional support and regulatory frameworks now in place in the crypto landscape. Matt Hougan, chief investment officer at Bitwise, remains optimistic, suggesting a potential Bitcoin resurgence in 2026 driven by the “debasement trade” thesis and a broader trend toward increased adoption of stablecoins, tokenization, and decentralized finance. Hougan emphasized the soundness of the underlying fundamentals, pointing to a positive outlook for the sector in the longer term.
Author  Mitrade
Nov 17, 2025
Bitcoin experienced a sharp decline this weekend, briefly erasing its 2025 gains and dipping below its year-opening value of $93,507. The cryptocurrency fell to a low of $93,029 on Sunday, representing a 25% drop from its all-time high in October. Although it has rebounded slightly to around $94,209, the pressures on the market remain significant. The downturn occurred despite the reopening of the U.S. government on Thursday, which many had hoped would provide essential support for crypto markets. This year initially appeared promising for cryptocurrencies, particularly after the inauguration of President Donald Trump, who has established the most pro-crypto administration thus far. However, ongoing political tensions—including Trump's tariff strategies and the recent government shutdown, lasting a historic 43 days—have contributed to several rapid price pullbacks for Bitcoin throughout the year. Market dynamics are also being influenced by Bitcoin whales—investors holding large amounts of Bitcoin—who have been offloading portions of their assets, consequently stalling price rallies even as positive regulatory developments emerge. Despite these sell-offs, analysts from Glassnode argue that this behavior aligns with typical patterns seen among long-term investors during the concluding stages of bull markets, suggesting it is not indicative of a mass exodus. Notably, Bitcoin is not alone in its struggles, as Ethereum and Solana have also recorded declines of 7.95% and 28.3%, respectively, since the start of the year, while numerous altcoins have faced even steeper losses. Looking ahead, questions linger regarding the viability of the four-year cycle thesis, particularly given the increasing institutional support and regulatory frameworks now in place in the crypto landscape. Matt Hougan, chief investment officer at Bitwise, remains optimistic, suggesting a potential Bitcoin resurgence in 2026 driven by the “debasement trade” thesis and a broader trend toward increased adoption of stablecoins, tokenization, and decentralized finance. Hougan emphasized the soundness of the underlying fundamentals, pointing to a positive outlook for the sector in the longer term.
placeholder
ECB Policy Outlook for 2026: What It Could Mean for the Euro’s Next MoveWith the ECB likely holding rates steady at 2.15% and the Fed potentially extending cuts into 2026, EUR/USD may test 1.20 if Eurozone growth proves resilient, but weaker growth and an ECB pivot could pull the pair back toward 1.13 and potentially 1.10.
Author  Mitrade
Dec 26, 2025
With the ECB likely holding rates steady at 2.15% and the Fed potentially extending cuts into 2026, EUR/USD may test 1.20 if Eurozone growth proves resilient, but weaker growth and an ECB pivot could pull the pair back toward 1.13 and potentially 1.10.
placeholder
My Top 5 Stock Market Predictions for 2026Five 2026 market predictions written in a native, news-style voice: AI’s winners and losers, broader sector leadership, dividend demand, valuation cooling as the Shiller CAPE sits at 39 (Dec. 31, 2025), and quantum-computing bursts—while keeping all original facts and numbers unchanged.
Author  Mitrade
Jan 06, Tue
Five 2026 market predictions written in a native, news-style voice: AI’s winners and losers, broader sector leadership, dividend demand, valuation cooling as the Shiller CAPE sits at 39 (Dec. 31, 2025), and quantum-computing bursts—while keeping all original facts and numbers unchanged.
placeholder
Gold Price Forecast: Oil Price Breaking $100 Fuels Inflation Concerns, Will Gold Prices Fall Further?As of the Asian session on July 24, gold prices ( XAUUSD) fell continuously during intraday trading, briefly approaching the $4,000 mark. Looking at the chart, gold prices rebounded this
Author  TradingKey
Jul 24, Fri
As of the Asian session on July 24, gold prices ( XAUUSD) fell continuously during intraday trading, briefly approaching the $4,000 mark. Looking at the chart, gold prices rebounded this
goTop
quote