

Ripple Price Forecast: XRP pressured as exchange reserves grow

Source Fxstreet
  • XRP pulls back for the second consecutive day, holding above $1.30 support on Tuesday.
  • Exchange reserves rise above 2.75 billion XRP, suggesting incoming selling pressure.
  • XRP’s recovery potential is limited amid fading retail interest and muted ETF activity.

Ripple (XRP) is trading under pressure on Tuesday and holding support above $1.30 at the time of writing. Its near-term bias has remained largely bearish amid the war in the Middle East. Moreover, sentiment remains extremely weak in the broader crypto market, as reflected in muted institutional activity and suppressed retail demand.

Growing exchange reserves cap XRP’s recovery potential

XRP exchange reserves are edging higher as the price wobbles, keeping holders on edge. CryptoQuant data shows that tokens held in known exchange addresses averaged near 2.76 billion XRP on Monday, up from 2.74 billion XRP on Sunday.

Growing exchange reserves mean that more holders are moving their coins from self-custody onto exchanges, intending to sell. This activity increases the supply available for sale in the open market, often pressuring prices and leading to declines.
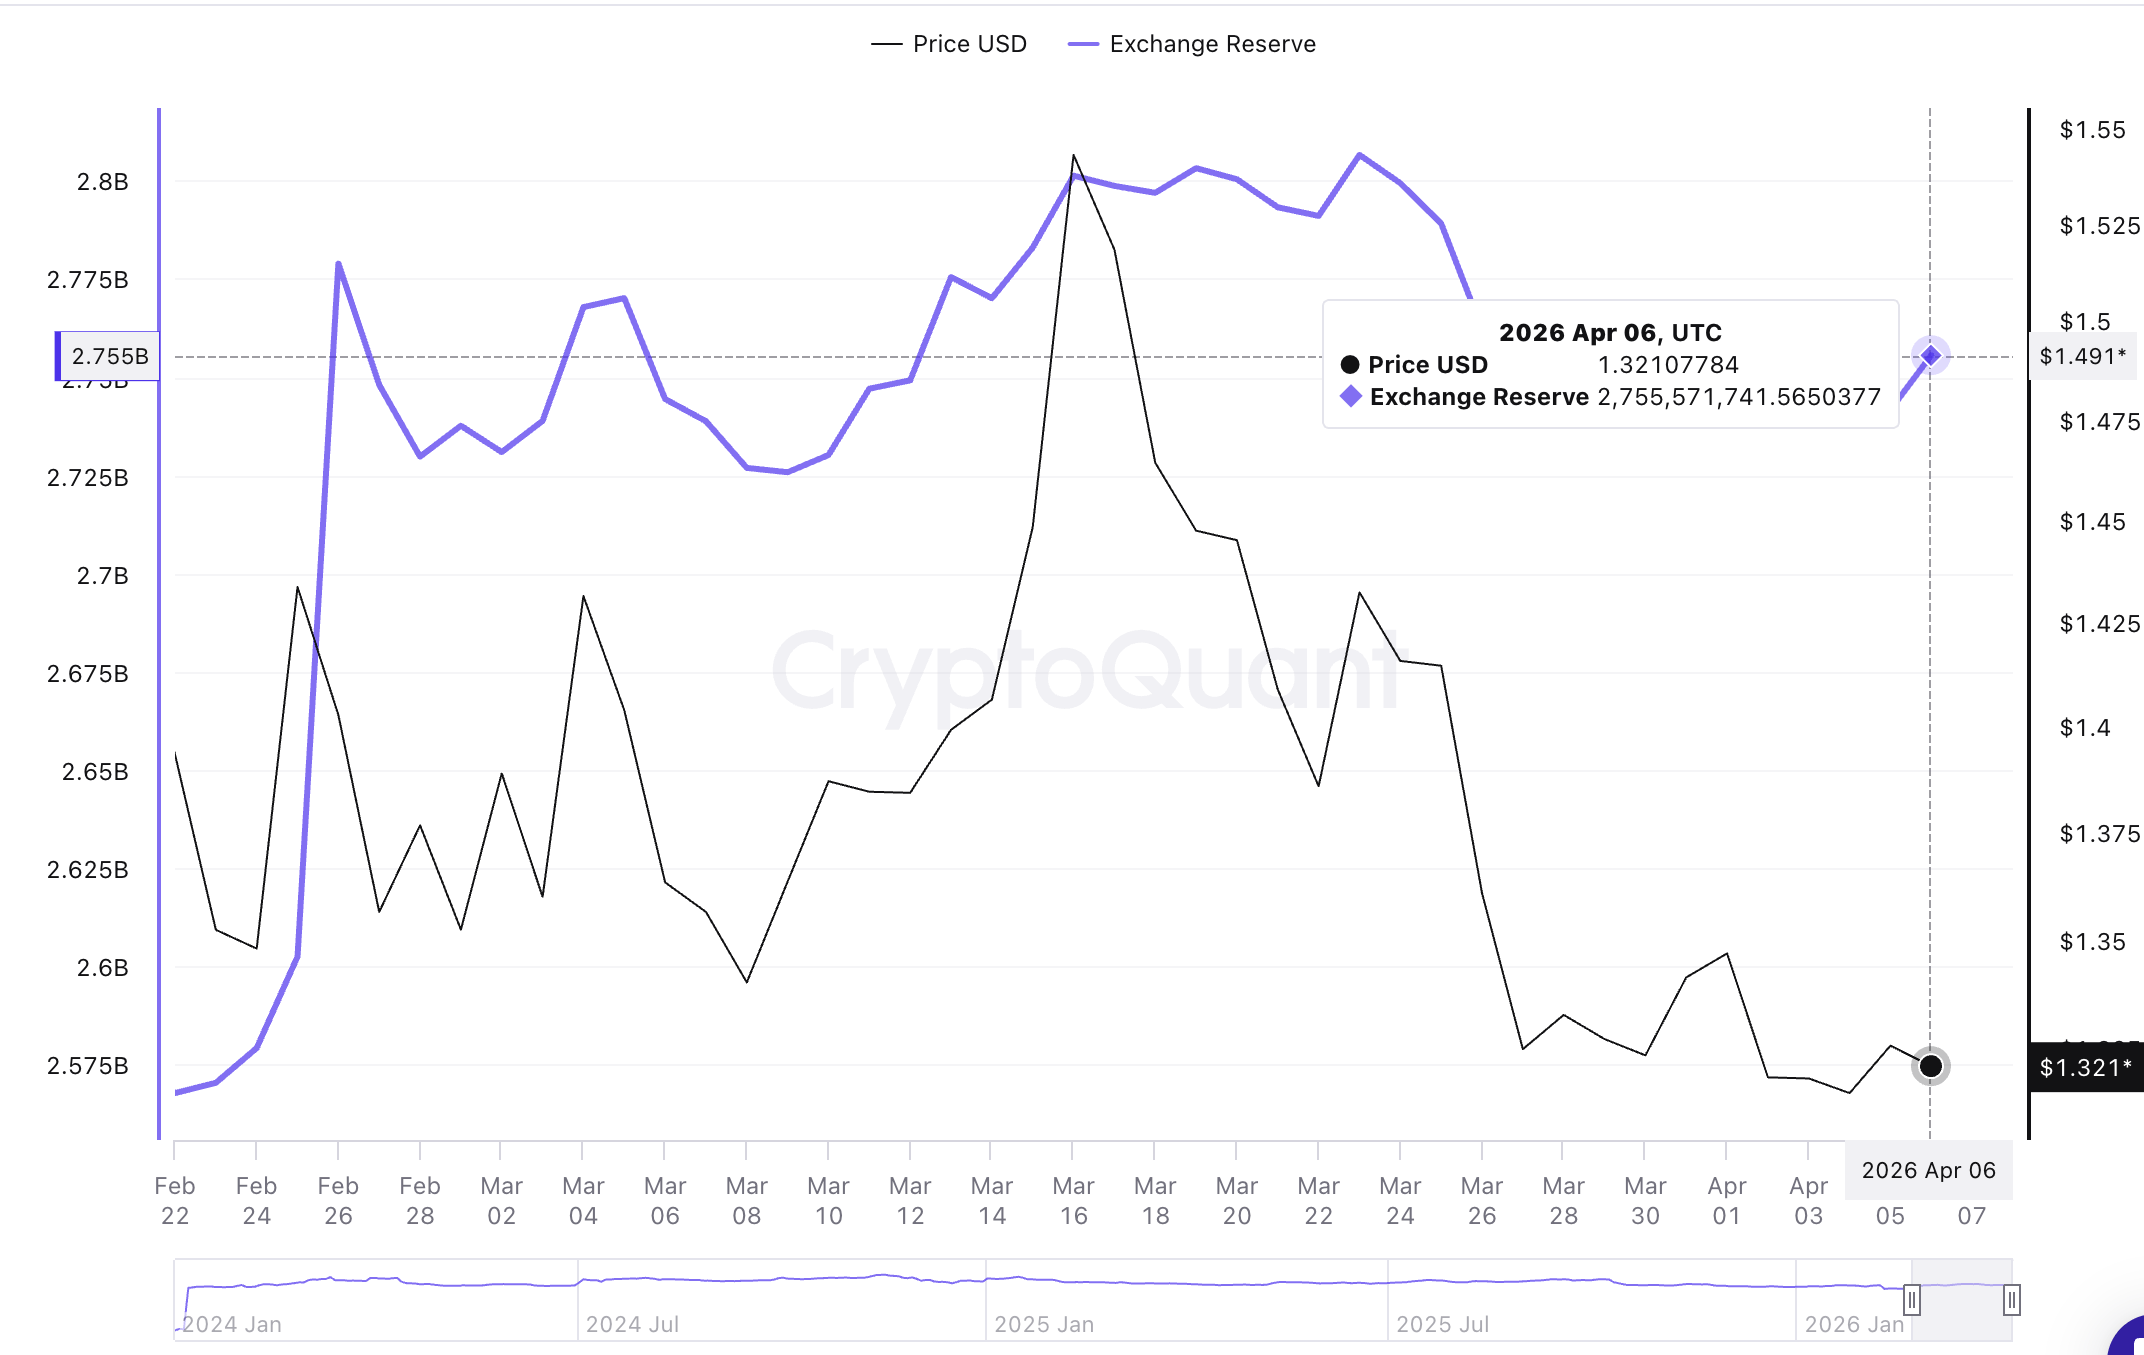
XRP exchange reserves | Source: CryptoQuant

At the same time, institutional and retail demand remains significantly suppressed, as observed with muted activity in XRP spot Exchange-Traded Funds (ETFs). SoSoValue data shows that US-listed spot XRP ETFs remained silent on Monday with zero flows recorded.

Cumulative inflows stand at $1.21 billion with net assets under management averaging $941 million. If risk appetite fails to improve and market sentiment remains weak, XRP’s recovery will be limited, favoring a persistent bearish trend.
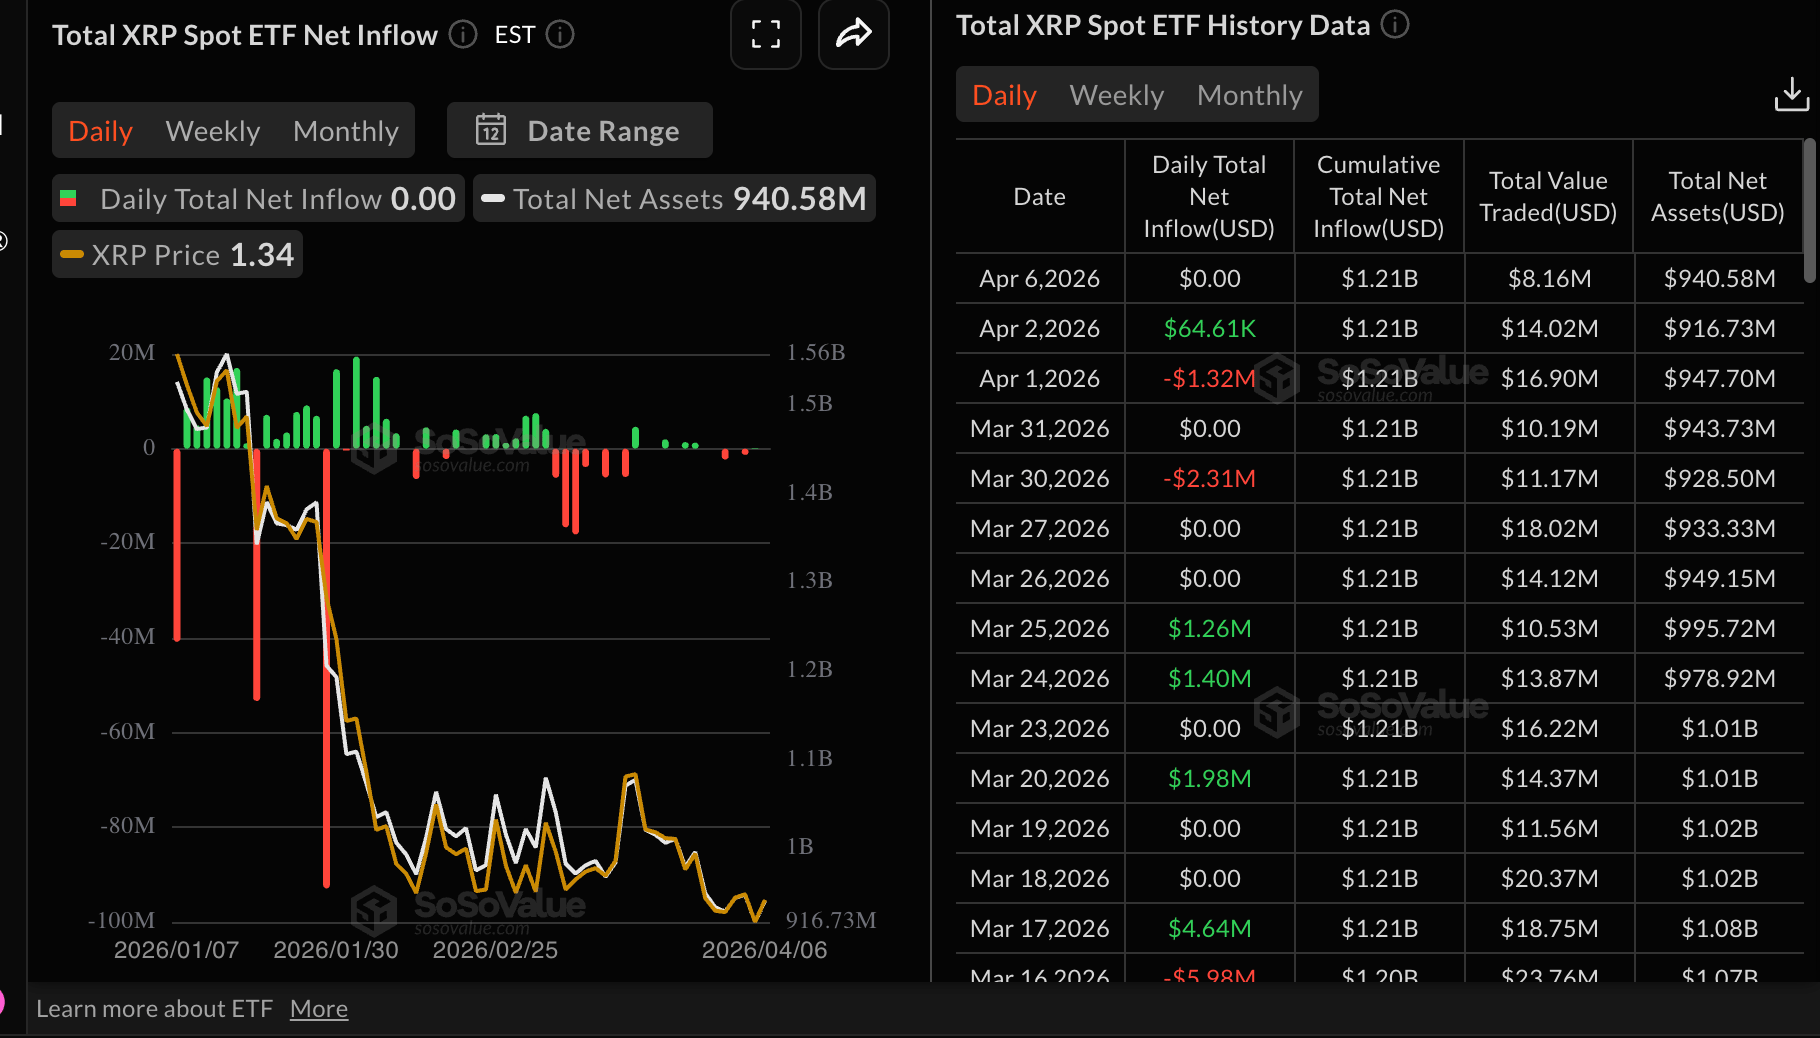
XRP ETF flows | Source: SoSoValue

XRP also faces suppressed retail demand, as reflected by futures Open Interest (OI) shrinking to $2.38 billion on Tuesday, from $2.47 billion the previous day. Since OI reflects the notional value of outstanding futures and options contracts, persistent declines indicate investors are losing conviction and are unwilling to open new positions. Ultimately, this deprives the underlying asset of the ability to sustain gains.
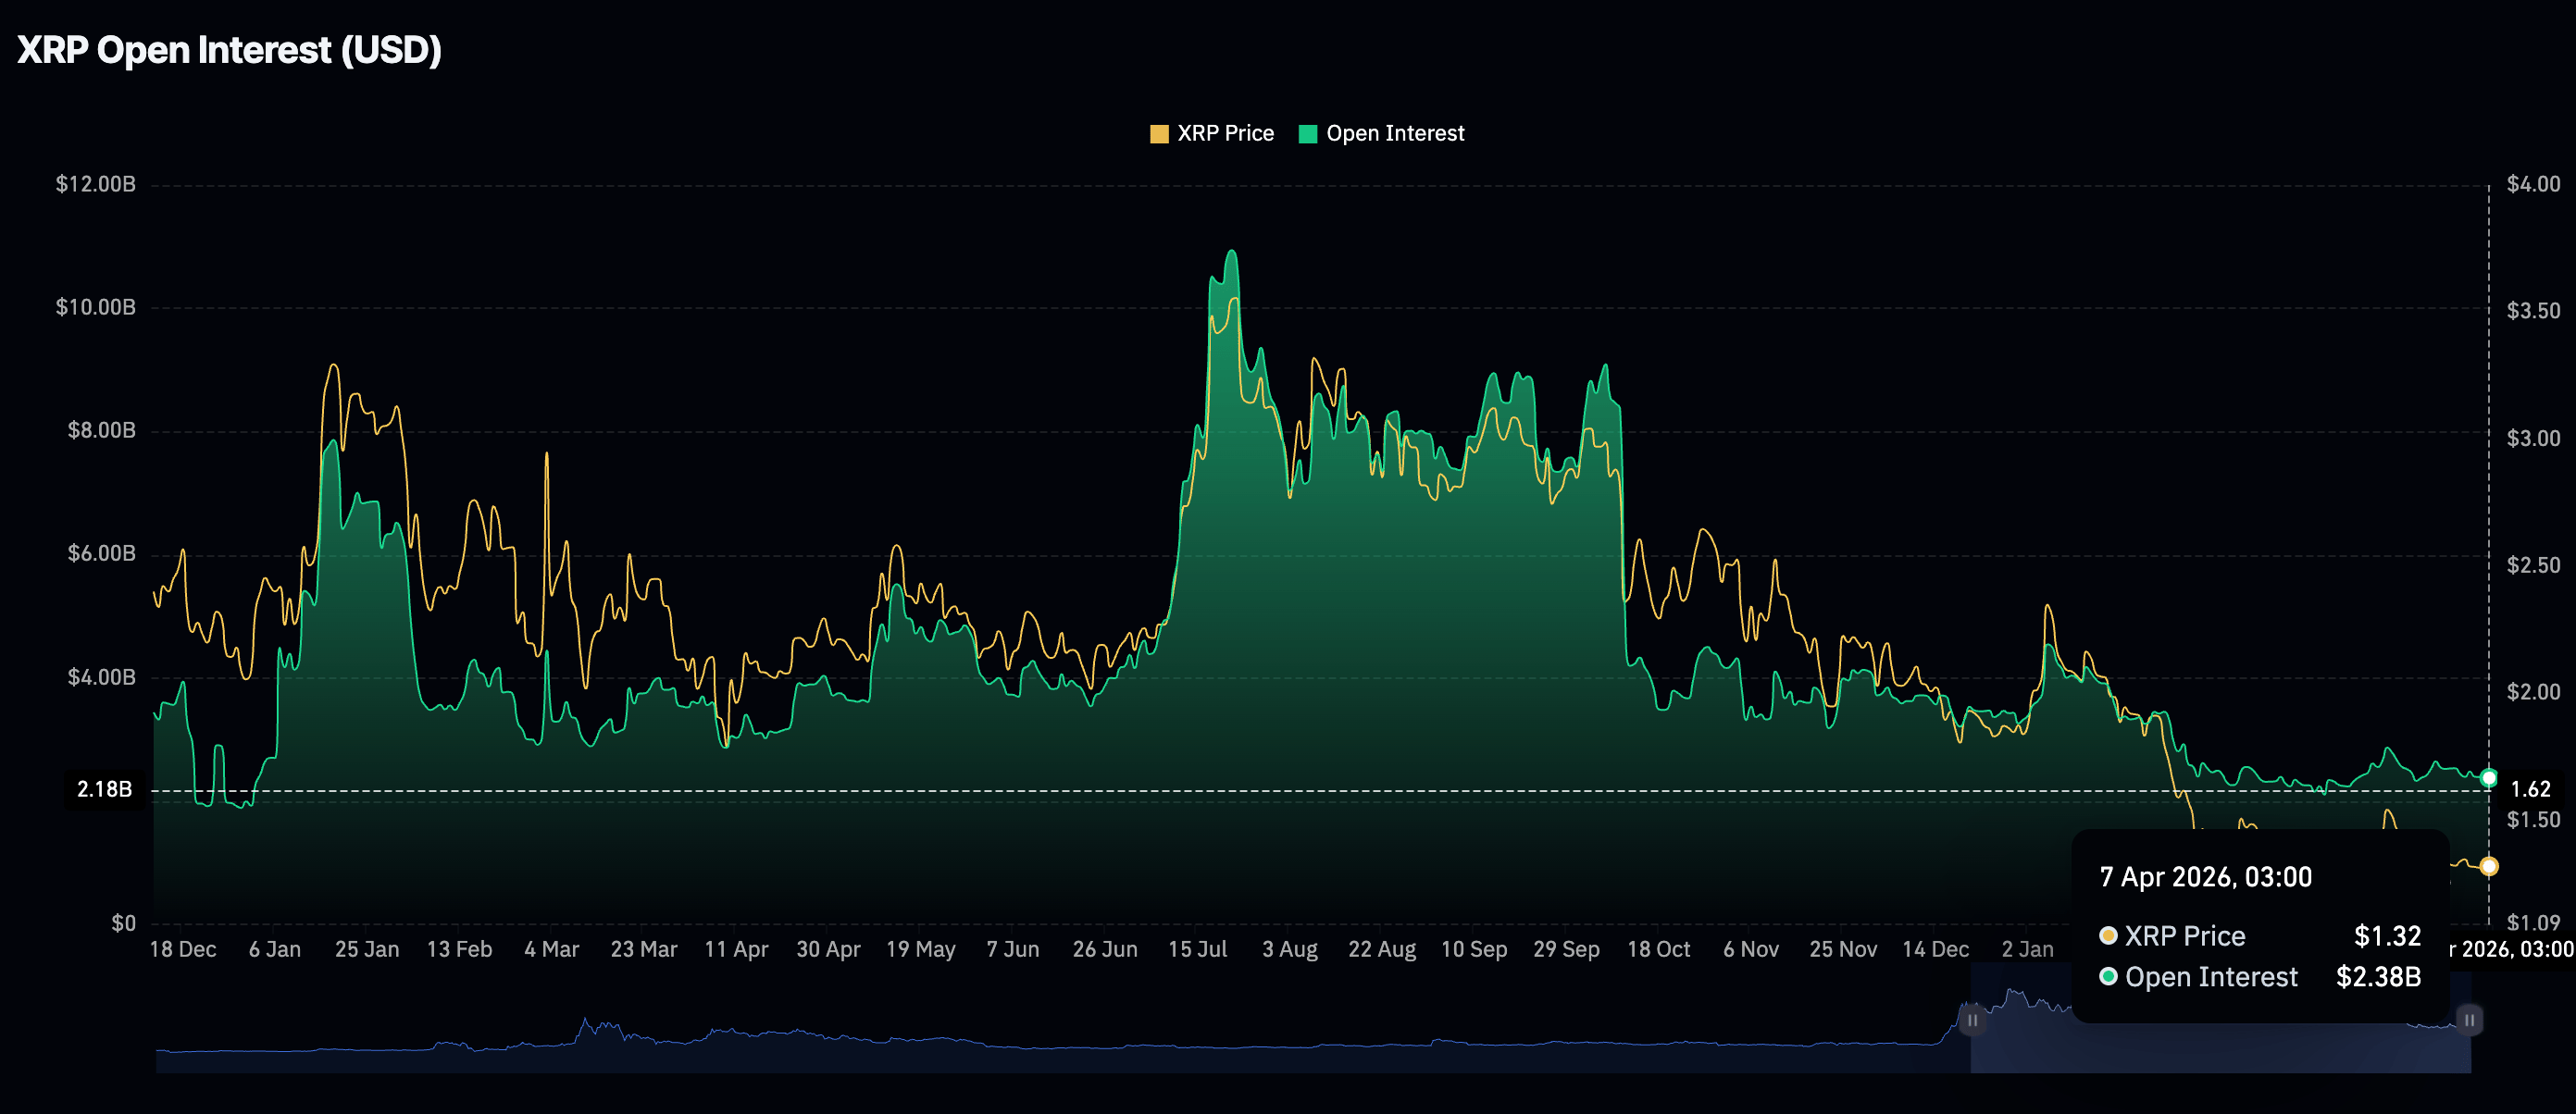
XRP Futures OI | Source: CoinGlass

Technical outlook: XRP at risk of extending bearish trend

XRP is trading above $1.30 at the time of writing on Tuesday. The remittance token remains locked in a corrective phase below a long-term descending trendline, with price action entrenched under the 50-day, 100-day, and 200-day Exponential Moving Averages (EMAs), which cluster between roughly $1.42 and $1.84. This configuration maintains a clear bearish near-term bias, as repeated failures near the 50-day EMA in recent sessions have given way to lower closes.

Momentum indicators back this downside tilt, with the Moving Average Convergence Divergence (MACD) holding below the signal line in negative territory and the negative histogram contracting only modestly on the daily chart, while the Relative Strength Index (RSI) extends below 40, signaling persistent selling pressure rather than an oversold inflection.

XRP/USDT daily chart

XRP's immediate resistance lies around $1.33, where recent rebound attempts have stalled, followed by $1.35 and the 50-day EMA at $1.42. A break of the latter would open a move toward the $1.45 area and then the $1.52–$1.54 band. On the downside, initial support is seen at the recent floor around $1.30, with a break lower exposing $1.28 and then $1.25 as deeper retracement levels within the broader downtrend.

Cryptocurrency metrics FAQs

The developer or creator of each cryptocurrency decides on the total number of tokens that can be minted or issued. Only a certain number of these assets can be minted by mining, staking or other mechanisms. This is defined by the algorithm of the underlying blockchain technology. On the other hand, circulating supply can also be decreased via actions such as burning tokens, or mistakenly sending assets to addresses of other incompatible blockchains.

Market capitalization is the result of multiplying the circulating supply of a certain asset by the asset’s current market value.

Trading volume refers to the total number of tokens for a specific asset that has been transacted or exchanged between buyers and sellers within set trading hours, for example, 24 hours. It is used to gauge market sentiment, this metric combines all volumes on centralized exchanges and decentralized exchanges. Increasing trading volume often denotes the demand for a certain asset as more people are buying and selling the cryptocurrency.

Funding rates are a concept designed to encourage traders to take positions and ensure perpetual contract prices match spot markets. It defines a mechanism by exchanges to ensure that future prices and index prices periodic payments regularly converge. When the funding rate is positive, the price of the perpetual contract is higher than the mark price. This means traders who are bullish and have opened long positions pay traders who are in short positions. On the other hand, a negative funding rate means perpetual prices are below the mark price, and hence traders with short positions pay traders who have opened long positions.

(The technical analysis of this story was written with the help of an AI tool.)

Disclaimer: For information purposes only. Past performance is not indicative of future results.
placeholder
Natural Gas sinks to pivotal level as China’s demand slumpsNatural Gas price (XNG/USD) edges lower and sinks to $2.56 on Monday, extending its losing streak for the fifth day in a row. The move comes on the back of China cutting its Liquified Natural Gas (LNG) imports after prices rose above $3.0 in June. It
Author  FXStreet
Jul 01, 2024
Natural Gas price (XNG/USD) edges lower and sinks to $2.56 on Monday, extending its losing streak for the fifth day in a row. The move comes on the back of China cutting its Liquified Natural Gas (LNG) imports after prices rose above $3.0 in June. It
placeholder
Bitcoin briefly loses 2025 gains as crypto plunges over the weekend.Bitcoin experienced a sharp decline this weekend, briefly erasing its 2025 gains and dipping below its year-opening value of $93,507. The cryptocurrency fell to a low of $93,029 on Sunday, representing a 25% drop from its all-time high in October. Although it has rebounded slightly to around $94,209, the pressures on the market remain significant. The downturn occurred despite the reopening of the U.S. government on Thursday, which many had hoped would provide essential support for crypto markets. This year initially appeared promising for cryptocurrencies, particularly after the inauguration of President Donald Trump, who has established the most pro-crypto administration thus far. However, ongoing political tensions—including Trump's tariff strategies and the recent government shutdown, lasting a historic 43 days—have contributed to several rapid price pullbacks for Bitcoin throughout the year. Market dynamics are also being influenced by Bitcoin whales—investors holding large amounts of Bitcoin—who have been offloading portions of their assets, consequently stalling price rallies even as positive regulatory developments emerge. Despite these sell-offs, analysts from Glassnode argue that this behavior aligns with typical patterns seen among long-term investors during the concluding stages of bull markets, suggesting it is not indicative of a mass exodus. Notably, Bitcoin is not alone in its struggles, as Ethereum and Solana have also recorded declines of 7.95% and 28.3%, respectively, since the start of the year, while numerous altcoins have faced even steeper losses. Looking ahead, questions linger regarding the viability of the four-year cycle thesis, particularly given the increasing institutional support and regulatory frameworks now in place in the crypto landscape. Matt Hougan, chief investment officer at Bitwise, remains optimistic, suggesting a potential Bitcoin resurgence in 2026 driven by the “debasement trade” thesis and a broader trend toward increased adoption of stablecoins, tokenization, and decentralized finance. Hougan emphasized the soundness of the underlying fundamentals, pointing to a positive outlook for the sector in the longer term.
Author  Mitrade
Nov 17, 2025
Bitcoin experienced a sharp decline this weekend, briefly erasing its 2025 gains and dipping below its year-opening value of $93,507. The cryptocurrency fell to a low of $93,029 on Sunday, representing a 25% drop from its all-time high in October. Although it has rebounded slightly to around $94,209, the pressures on the market remain significant. The downturn occurred despite the reopening of the U.S. government on Thursday, which many had hoped would provide essential support for crypto markets. This year initially appeared promising for cryptocurrencies, particularly after the inauguration of President Donald Trump, who has established the most pro-crypto administration thus far. However, ongoing political tensions—including Trump's tariff strategies and the recent government shutdown, lasting a historic 43 days—have contributed to several rapid price pullbacks for Bitcoin throughout the year. Market dynamics are also being influenced by Bitcoin whales—investors holding large amounts of Bitcoin—who have been offloading portions of their assets, consequently stalling price rallies even as positive regulatory developments emerge. Despite these sell-offs, analysts from Glassnode argue that this behavior aligns with typical patterns seen among long-term investors during the concluding stages of bull markets, suggesting it is not indicative of a mass exodus. Notably, Bitcoin is not alone in its struggles, as Ethereum and Solana have also recorded declines of 7.95% and 28.3%, respectively, since the start of the year, while numerous altcoins have faced even steeper losses. Looking ahead, questions linger regarding the viability of the four-year cycle thesis, particularly given the increasing institutional support and regulatory frameworks now in place in the crypto landscape. Matt Hougan, chief investment officer at Bitwise, remains optimistic, suggesting a potential Bitcoin resurgence in 2026 driven by the “debasement trade” thesis and a broader trend toward increased adoption of stablecoins, tokenization, and decentralized finance. Hougan emphasized the soundness of the underlying fundamentals, pointing to a positive outlook for the sector in the longer term.
placeholder
ECB Policy Outlook for 2026: What It Could Mean for the Euro’s Next MoveWith the ECB likely holding rates steady at 2.15% and the Fed potentially extending cuts into 2026, EUR/USD may test 1.20 if Eurozone growth proves resilient, but weaker growth and an ECB pivot could pull the pair back toward 1.13 and potentially 1.10.
Author  Mitrade
Dec 26, 2025
With the ECB likely holding rates steady at 2.15% and the Fed potentially extending cuts into 2026, EUR/USD may test 1.20 if Eurozone growth proves resilient, but weaker growth and an ECB pivot could pull the pair back toward 1.13 and potentially 1.10.
placeholder
My Top 5 Stock Market Predictions for 2026Five 2026 market predictions written in a native, news-style voice: AI’s winners and losers, broader sector leadership, dividend demand, valuation cooling as the Shiller CAPE sits at 39 (Dec. 31, 2025), and quantum-computing bursts—while keeping all original facts and numbers unchanged.
Author  Mitrade
Jan 06, Tue
Five 2026 market predictions written in a native, news-style voice: AI’s winners and losers, broader sector leadership, dividend demand, valuation cooling as the Shiller CAPE sits at 39 (Dec. 31, 2025), and quantum-computing bursts—while keeping all original facts and numbers unchanged.
placeholder
Gold Price Forecast: Oil Price Breaking $100 Fuels Inflation Concerns, Will Gold Prices Fall Further?As of the Asian session on July 24, gold prices ( XAUUSD) fell continuously during intraday trading, briefly approaching the $4,000 mark. Looking at the chart, gold prices rebounded this
Author  TradingKey
Jul 24, Fri
As of the Asian session on July 24, gold prices ( XAUUSD) fell continuously during intraday trading, briefly approaching the $4,000 mark. Looking at the chart, gold prices rebounded this
Related Instrument
goTop
quote