Can XRP Price Escape a 17-Day Bearish Channel Despite a Weakening BTC Link?

Source Beincrypto

XRP price trades at $1.32 on April 3, down 2.9% over the past seven days and still trapped inside a descending parallel channel that has contained price action since March 17.

A bullish RSI divergence on the 8-hour chart has triggered an early bounce. However, two dense cost basis clusters sit directly above the current price, and XRP’s unusually low correlation with Bitcoin introduces a variable that could either help or hurt the breakout attempt. The channel escape depends on whether conviction holds at the right levels.

A Bounce Has Started but Walls Stand Above

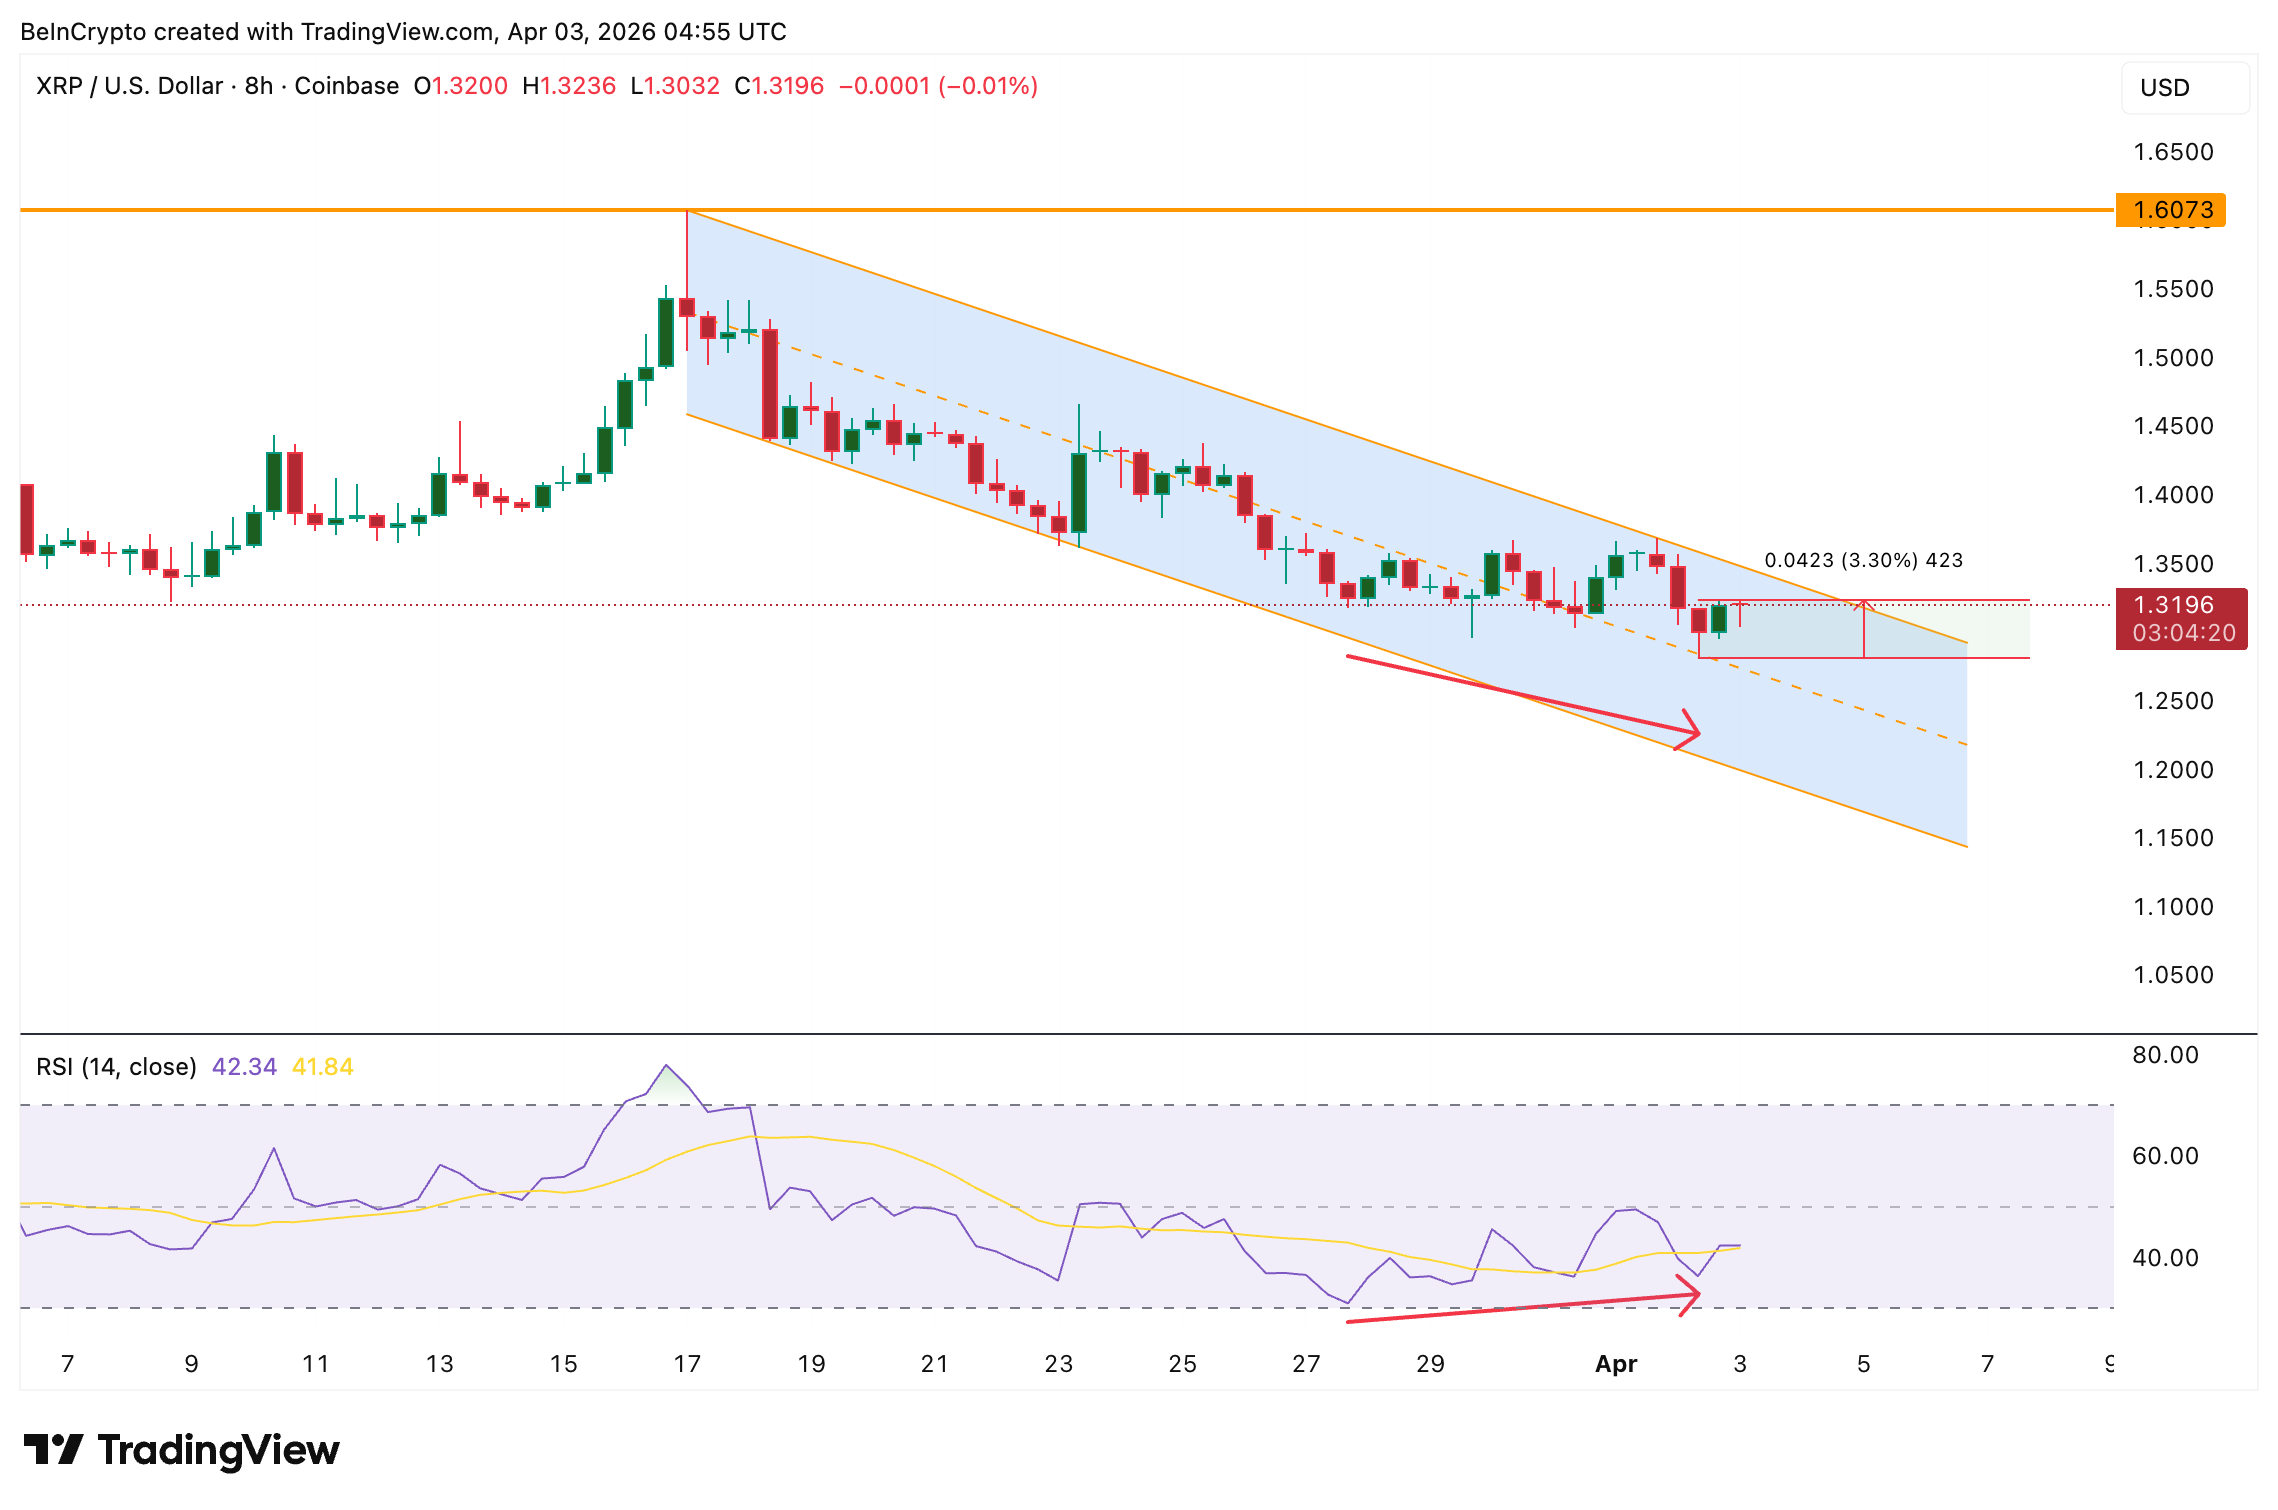
Since March 17, when XRP price briefly reached $1.60, the token has been trading inside a falling parallel channel on the 8-hour chart. The structure reflects persistent selling pressure, with each rally capping at a lower level than the previous one.

Between March 27 and April 2, however, price made a lower low while the Relative Strength Index (RSI), a momentum oscillator, made a higher low. That standard bullish divergence signals weakening selling momentum and often precedes short-term trend reversals. The bounce has already begun, but the question is whether it has enough strength to escape the channel.

RSI Bullish DivergenceRSI Bullish Divergence: TradingView

Want more token insights like this? Sign up for Editor Harsh Notariya’s Daily Crypto Newsletter here.

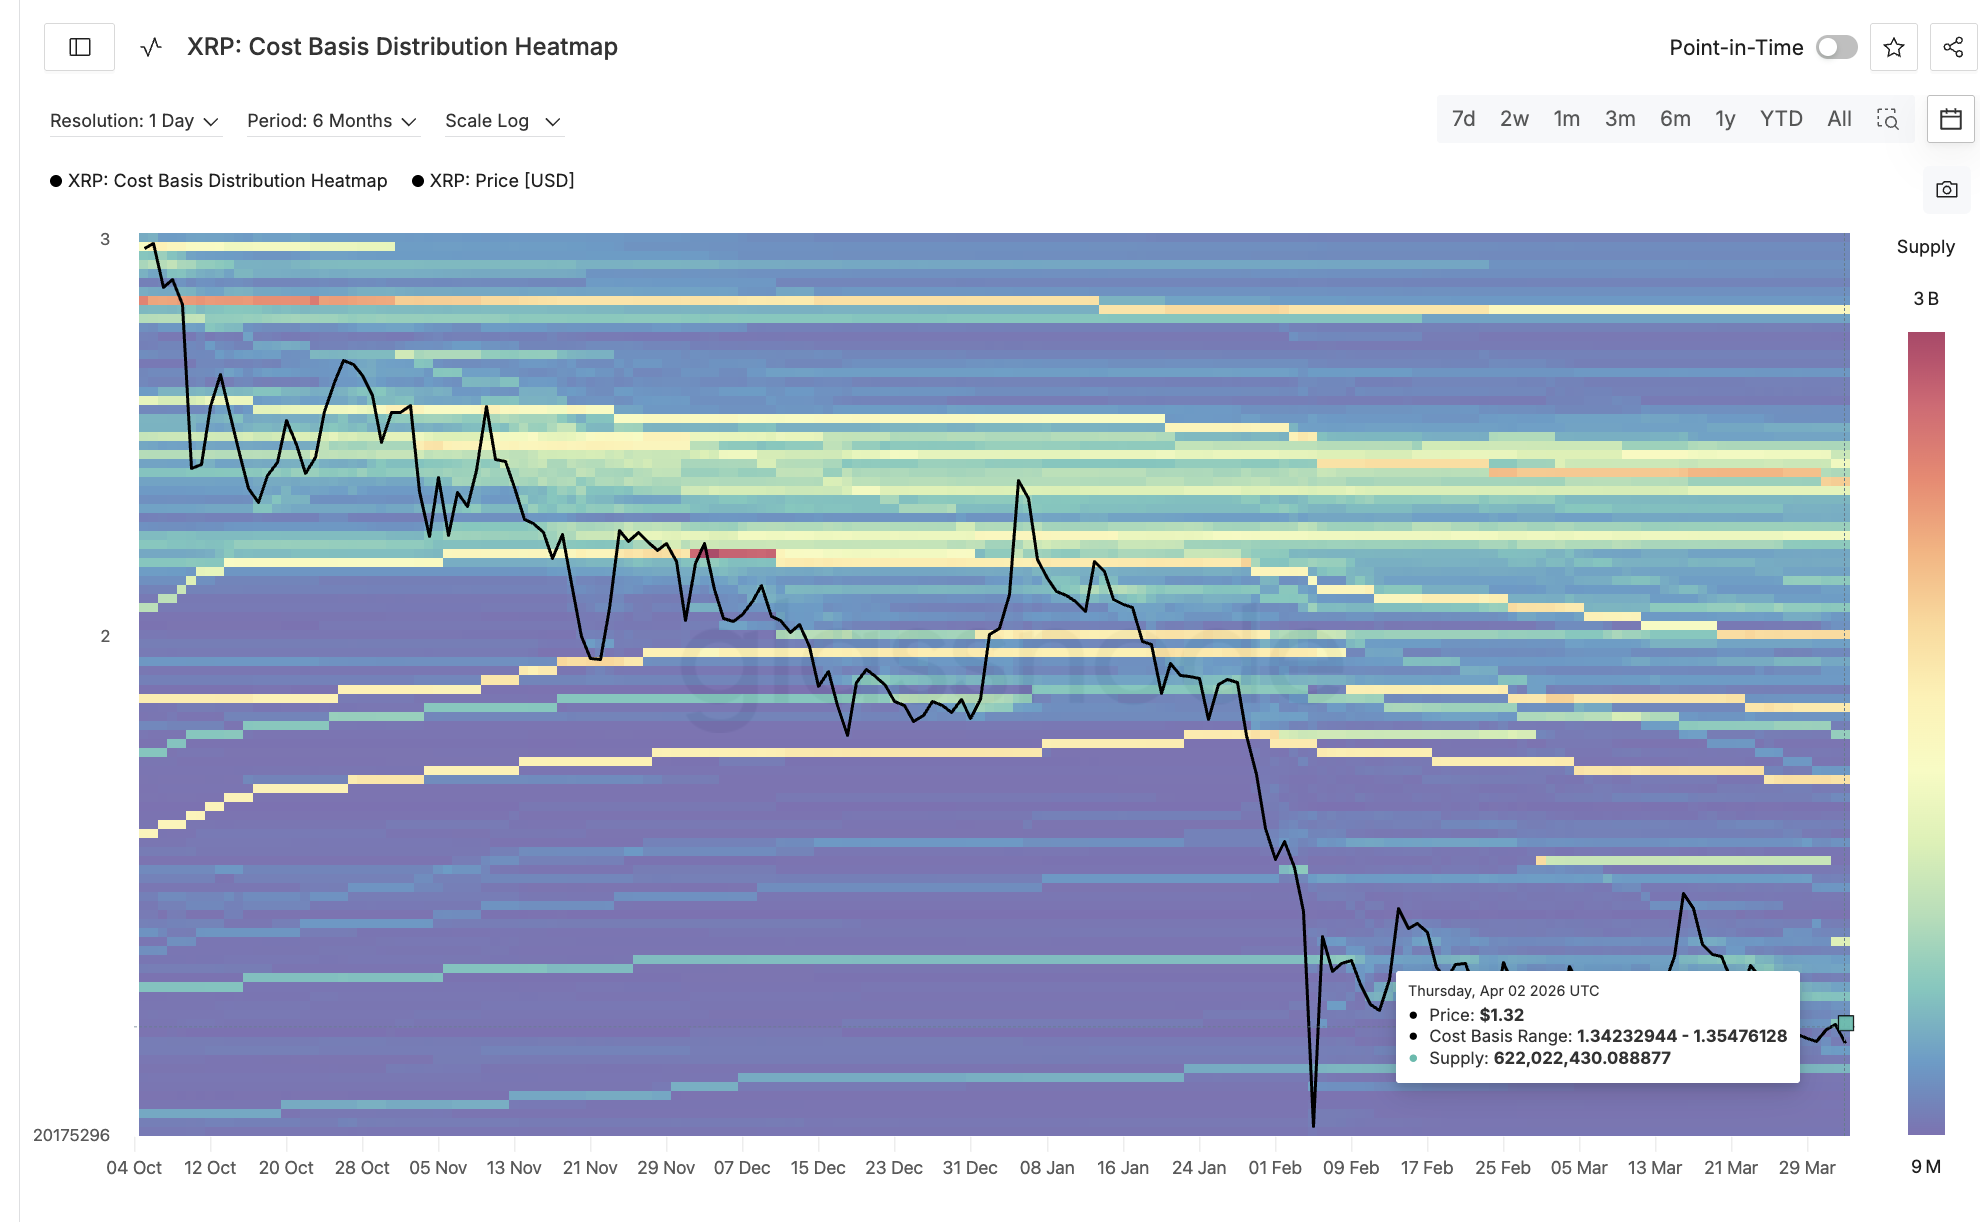
The XRP cost basis distribution heatmap from Glassnode reveals two clusters directly in the bounce’s path. The first sits between $1.34 and $1.35, where approximately 622 million XRP tokens are concentrated.

Cost Basis Near ClusterCost Basis Near Cluster: Glassnode

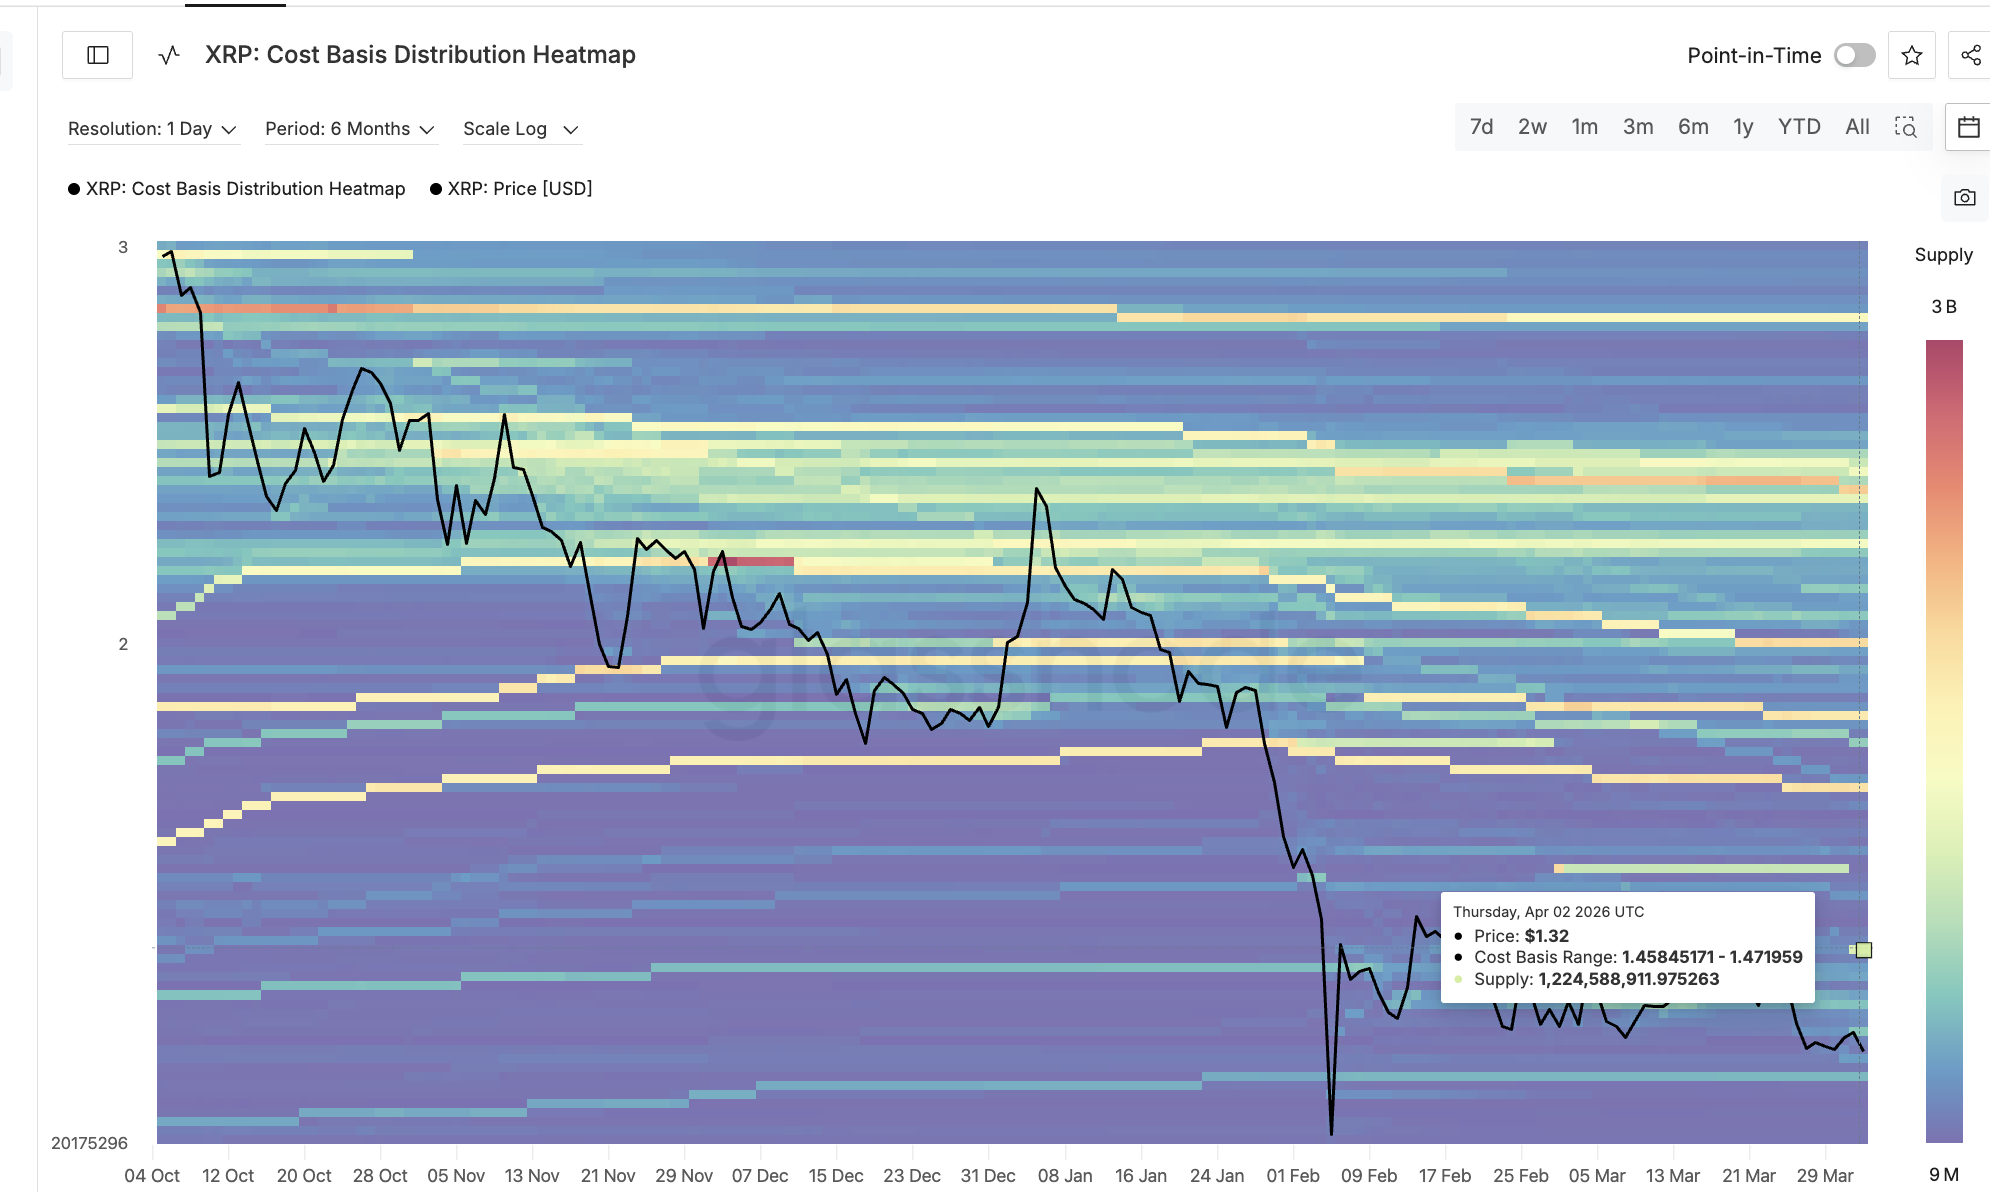
If participants at this level choose to sell into strength, the bounce stalls early. The second and stronger cluster lies between $1.45 and $1.47, holding roughly 1.22 billion XRP. That zone aligns closely with the upper boundary of the descending channel. While other clusters lie in between as well, we have just highlighted the near-term and the strongest one (in near-term) for now.

Cost Basis Strong ClusterCost Basis Strong Cluster: Glassnode

For the bounce to convert into a channel breakout, XRP must push through both clusters without triggering significant distribution. The first test at $1.34 to $1.35 will reveal whether market conviction supports the divergence. The correlation with Bitcoin then determines whether external forces help or hinder that test.

Bitcoin Correlation at 0.75 Gives XRP Room but Not Safety

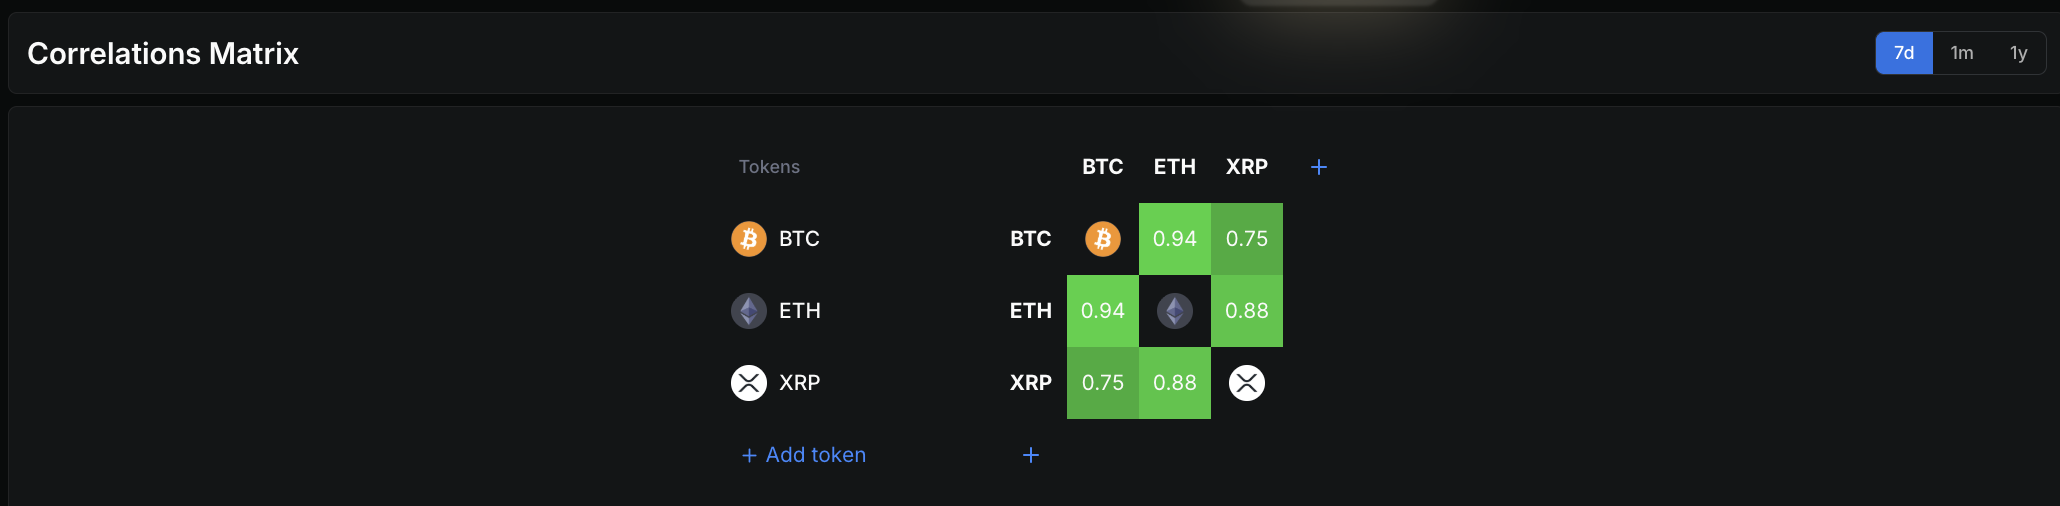
The seven-day correlation matrix shows that XRP’s correlation with Bitcoin currently sits at 0.75. For context, Ethereum’s Bitcoin correlation over the same period is 0.94. That gap means XRP moves with the broader market but retains more independence than most large-cap tokens.

This independence cuts both ways. If Bitcoin weakens further, XRP’s lower correlation could allow the RSI-driven bounce to continue without being fully dragged down. The divergence provides a short-term internal catalyst that does not depend on BTC’s direction.

However, that same independence means that even if Bitcoin recovers, XRP may not follow with the same intensity. The cost basis clusters are XRP-specific resistance zones, and the descending channel is an XRP-specific structure. Bitcoin strength can provide a tailwind, but it cannot push XRP price through its own walls if internal conviction is absent.

BTC-XRP Correlation MatrixBTC-XRP Correlation Matrix: Coinglass

The correlation effectively isolates the question. XRP’s breakout or breakdown will be determined more by how its own participants behave at the $1.34 and $1.45 clusters than by Bitcoin’s next move. That makes the XRP price levels even more critical.

XRP Price Prediction and the Critical Hurdles

The 8-hour chart with Fibonacci levels drawn from the channel’s swing points frames the immediate path. XRP price currently sits at $1.32, just below the 0 Fib level at $1.36. That level represents the first technical hurdle and aligns with the $1.34 to $1.35 cost basis cluster from the previous section.

A clean 8-hour close above $1.36 would confirm that the cost basis cluster is holding rather than distributing. It would also place XRP above the channel’s upper trendline and validate the RSI divergence bounce. From there, $1.46 becomes the next resistance, aligning with the stronger 1.22 billion XRP cost basis cluster at $1.45 to $1.47. An 8-hour reclaim above $1.46 opens the path toward $1.60, the March 17 high that started the channel.

On the downside, $1.29 acts as the 0.236 Fib and the immediate floor. A break below that level invalidates the RSI divergence bounce and pushes XRP price deeper into the channel. Below $1.29, the 0.5 Fib at $1.21 and the 0.618 Fib at $1.17 come into play. Losing $1.17 would confirm a full channel breakdown and could trigger an extended decline.

XRP Price Analysis
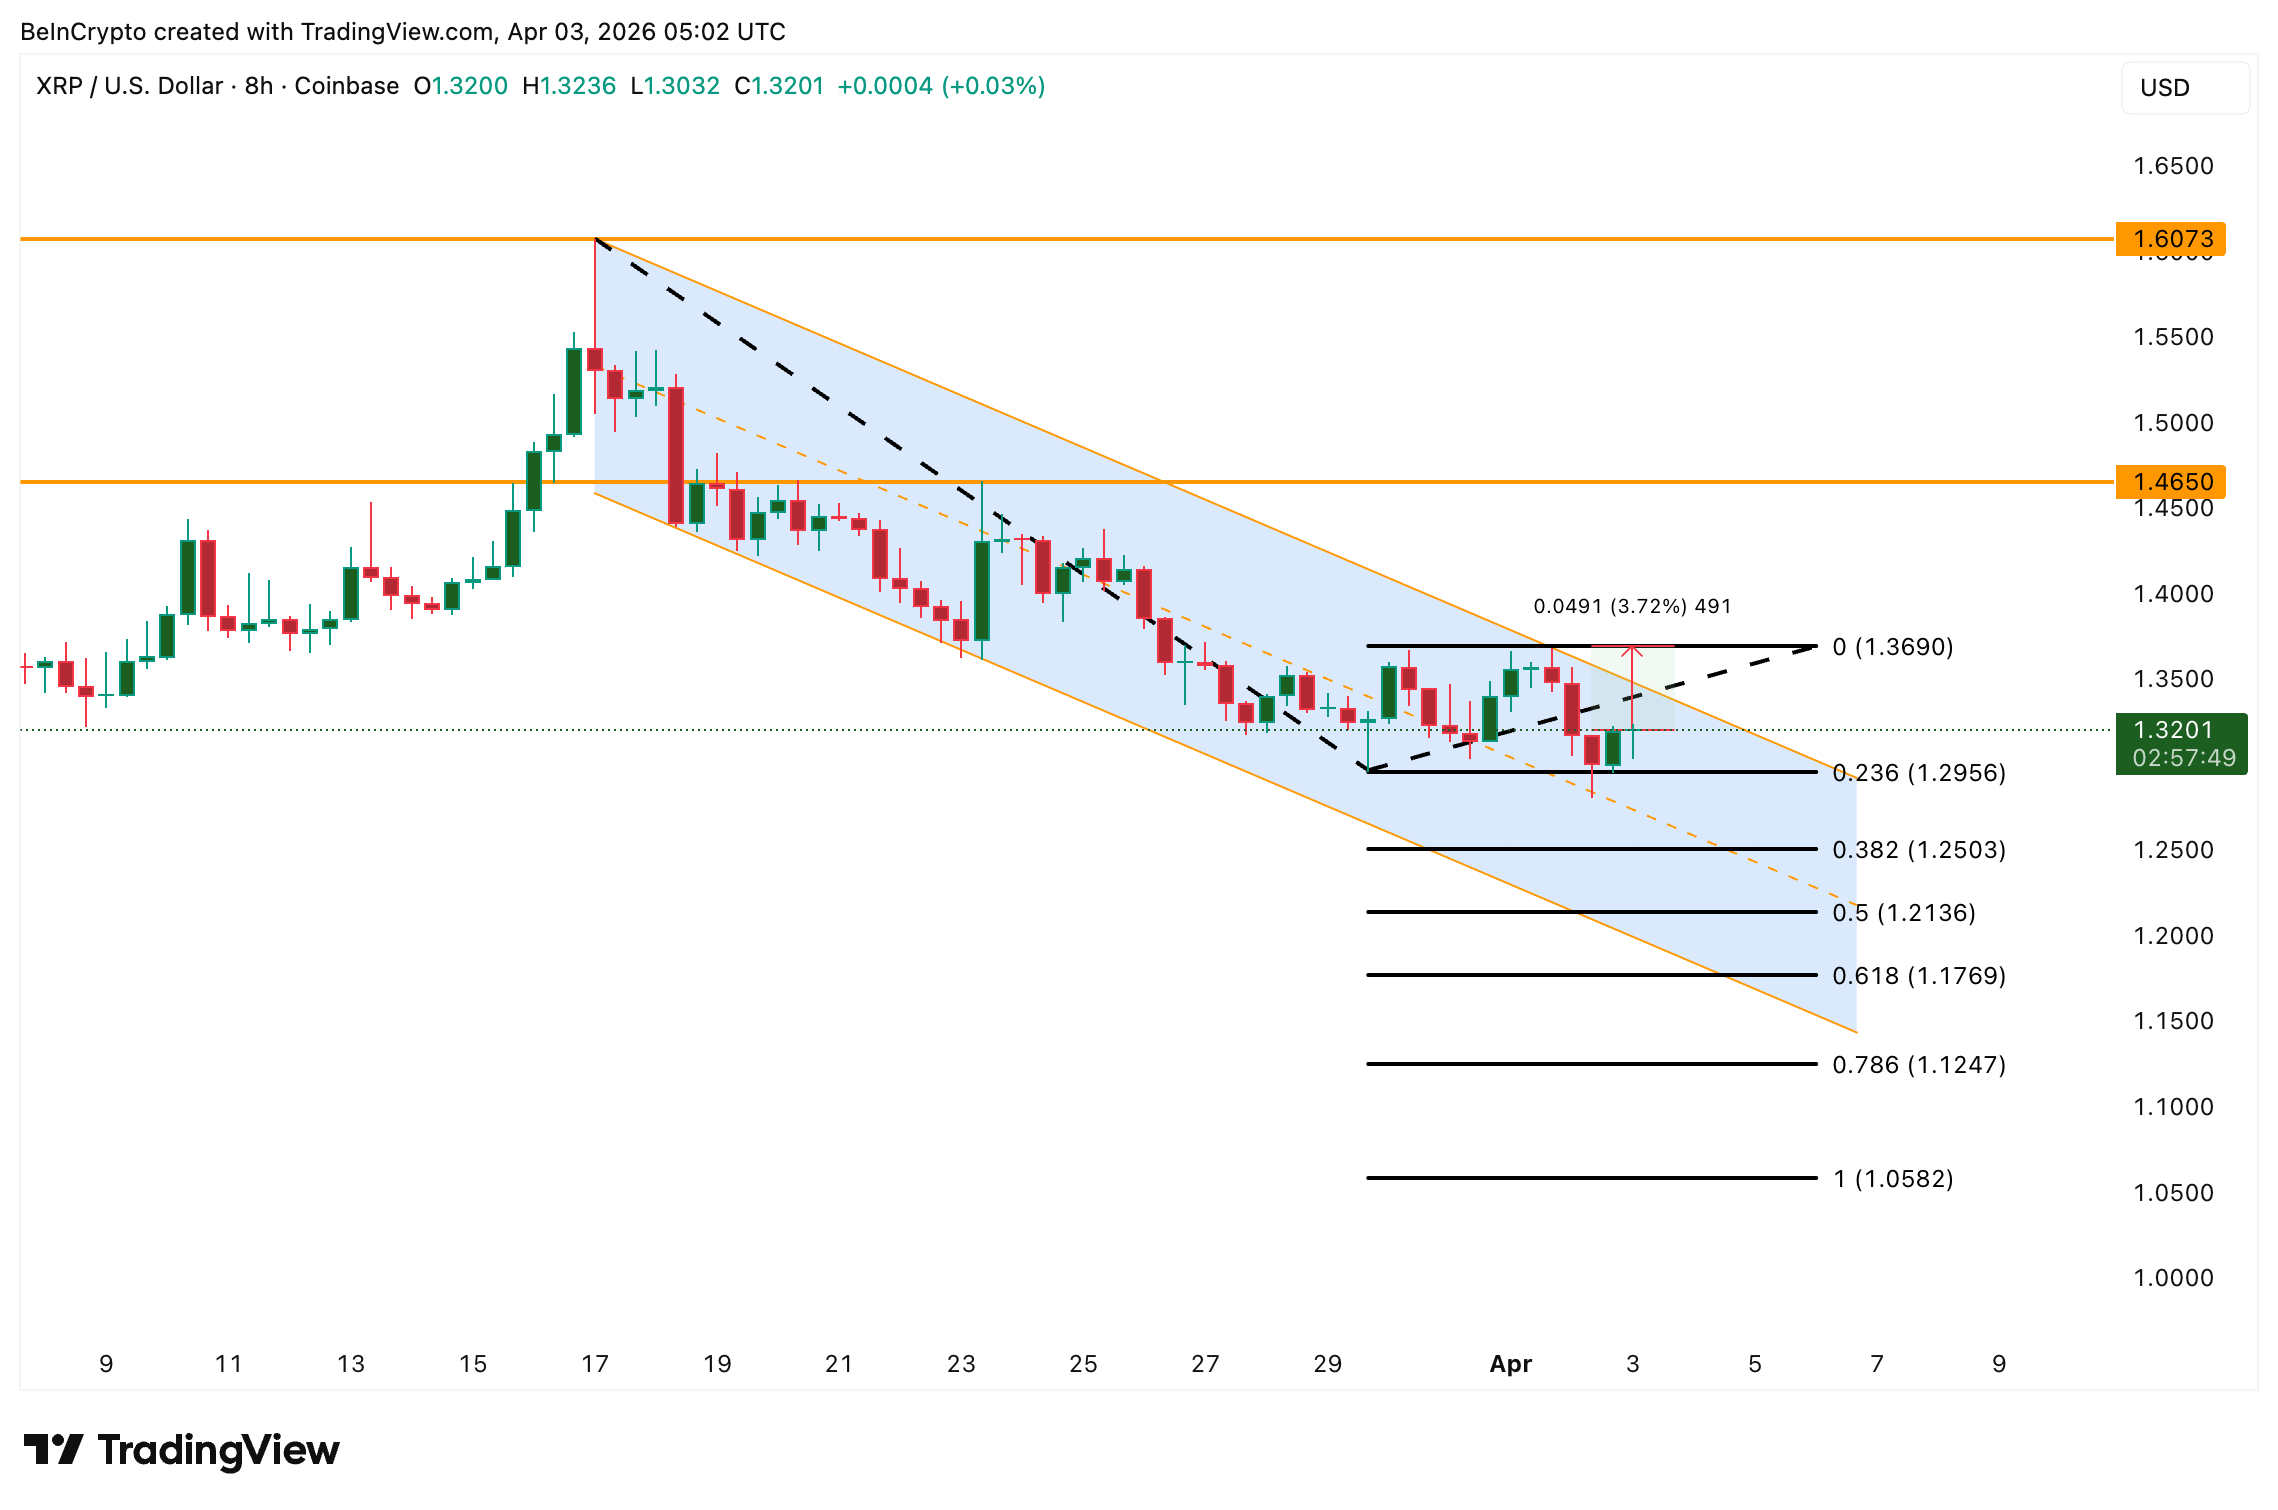
XRP Price Analysis: TradingView

Descending channels with bullish divergences sometimes produce false bounces that fail at the first resistance and resume the downtrend. The cost basis data shows exactly where conviction will be tested, and the weakening Bitcoin correlation means XRP must pass that test largely on its own terms.

A clean close above $1.36 separates a divergence-driven recovery toward $1.46 from a failed bounce that sends XRP back toward the $1.21 zone, while breaking $1.17 would confirm the channel has won.

Disclaimer: For information purposes only. Past performance is not indicative of future results.
placeholder
Bitcoin To Anchor America Party—’Fiat Is Hopeless,’ Says Elon MuskMusk Pitches Bitcoin As Pillar Of America Party
Author  Bitcoinist
Jul 07, 2025
Musk Pitches Bitcoin As Pillar Of America Party
placeholder
Bitcoin briefly loses 2025 gains as crypto plunges over the weekend.Bitcoin experienced a sharp decline this weekend, briefly erasing its 2025 gains and dipping below its year-opening value of $93,507. The cryptocurrency fell to a low of $93,029 on Sunday, representing a 25% drop from its all-time high in October. Although it has rebounded slightly to around $94,209, the pressures on the market remain significant. The downturn occurred despite the reopening of the U.S. government on Thursday, which many had hoped would provide essential support for crypto markets. This year initially appeared promising for cryptocurrencies, particularly after the inauguration of President Donald Trump, who has established the most pro-crypto administration thus far. However, ongoing political tensions—including Trump's tariff strategies and the recent government shutdown, lasting a historic 43 days—have contributed to several rapid price pullbacks for Bitcoin throughout the year. Market dynamics are also being influenced by Bitcoin whales—investors holding large amounts of Bitcoin—who have been offloading portions of their assets, consequently stalling price rallies even as positive regulatory developments emerge. Despite these sell-offs, analysts from Glassnode argue that this behavior aligns with typical patterns seen among long-term investors during the concluding stages of bull markets, suggesting it is not indicative of a mass exodus. Notably, Bitcoin is not alone in its struggles, as Ethereum and Solana have also recorded declines of 7.95% and 28.3%, respectively, since the start of the year, while numerous altcoins have faced even steeper losses. Looking ahead, questions linger regarding the viability of the four-year cycle thesis, particularly given the increasing institutional support and regulatory frameworks now in place in the crypto landscape. Matt Hougan, chief investment officer at Bitwise, remains optimistic, suggesting a potential Bitcoin resurgence in 2026 driven by the “debasement trade” thesis and a broader trend toward increased adoption of stablecoins, tokenization, and decentralized finance. Hougan emphasized the soundness of the underlying fundamentals, pointing to a positive outlook for the sector in the longer term.
Author  Mitrade
Nov 17, 2025
Bitcoin experienced a sharp decline this weekend, briefly erasing its 2025 gains and dipping below its year-opening value of $93,507. The cryptocurrency fell to a low of $93,029 on Sunday, representing a 25% drop from its all-time high in October. Although it has rebounded slightly to around $94,209, the pressures on the market remain significant. The downturn occurred despite the reopening of the U.S. government on Thursday, which many had hoped would provide essential support for crypto markets. This year initially appeared promising for cryptocurrencies, particularly after the inauguration of President Donald Trump, who has established the most pro-crypto administration thus far. However, ongoing political tensions—including Trump's tariff strategies and the recent government shutdown, lasting a historic 43 days—have contributed to several rapid price pullbacks for Bitcoin throughout the year. Market dynamics are also being influenced by Bitcoin whales—investors holding large amounts of Bitcoin—who have been offloading portions of their assets, consequently stalling price rallies even as positive regulatory developments emerge. Despite these sell-offs, analysts from Glassnode argue that this behavior aligns with typical patterns seen among long-term investors during the concluding stages of bull markets, suggesting it is not indicative of a mass exodus. Notably, Bitcoin is not alone in its struggles, as Ethereum and Solana have also recorded declines of 7.95% and 28.3%, respectively, since the start of the year, while numerous altcoins have faced even steeper losses. Looking ahead, questions linger regarding the viability of the four-year cycle thesis, particularly given the increasing institutional support and regulatory frameworks now in place in the crypto landscape. Matt Hougan, chief investment officer at Bitwise, remains optimistic, suggesting a potential Bitcoin resurgence in 2026 driven by the “debasement trade” thesis and a broader trend toward increased adoption of stablecoins, tokenization, and decentralized finance. Hougan emphasized the soundness of the underlying fundamentals, pointing to a positive outlook for the sector in the longer term.
placeholder
Gold Price Forecast: XAU/USD opens lower around $4,450 on fears of widening Iran conflictsGold price (XAU/USD) opens over 1% lower to near $4,445.00 on Monday, as oil prices have rallied further on fears of further widening of conflicts in the Middle East. WTI Oil price is up almost 3% above $102.50 in the opening trade, increasing fears of higher inflation expectations globally.
Author  FXStreet
Mar 30, Mon
Gold price (XAU/USD) opens over 1% lower to near $4,445.00 on Monday, as oil prices have rallied further on fears of further widening of conflicts in the Middle East. WTI Oil price is up almost 3% above $102.50 in the opening trade, increasing fears of higher inflation expectations globally.
placeholder
Silver Price Forecast: XAG/USD falls to near $72.00 amid fading safe-haven demandSilver price (XAG/USD) continues to lose ground after registering tiny losses in the previous day, trading around $72.90 during the Asian hours on Thursday. The safe-haven demand for the precious metal fades amid rising optimism over Middle East peace.
Author  FXStreet
Yesterday 08: 19
Silver price (XAG/USD) continues to lose ground after registering tiny losses in the previous day, trading around $72.90 during the Asian hours on Thursday. The safe-haven demand for the precious metal fades amid rising optimism over Middle East peace.
placeholder
Gold retreats sharply from two-week top/$4,800 as Trump’s Iran comments boost USDGold (XAU/USD) witnessed an intraday turnaround from the $4,800 mark, or a fresh two-week high set earlier this Thursday, and for now, seems to have snapped a four-day winning streak amid resurgent US Dollar (USD) demand.
Author  FXStreet
Yesterday 07: 03
Gold (XAU/USD) witnessed an intraday turnaround from the $4,800 mark, or a fresh two-week high set earlier this Thursday, and for now, seems to have snapped a four-day winning streak amid resurgent US Dollar (USD) demand.
goTop
quote