

Ethereum Is Fighting to Break a 6-Month Curse, But Things Can Go Wrong
Ethereum (ETH) price is clinging to a 2.93% gain in March, its first green month since August 2025. Every month from September through February closed in the red, creating a six-month losing streak that wiped out over 50% of ETH’s value.
With only a few days left in March, the question is whether Ethereum can hold this gain or whether the forces building against it will flip the month red and extend the streak to seven.
March Started Strong, but the Second Half Tells a Different Story
The monthly returns chart shows the damage. September 2025 fell 5.59%. October dropped 7.15%. November crashed 22.2%. December slipped 0.83%. January 2026 lost 17.7%, and February shed 19.6%.
March’s +2.93% stands alone in green, but the number masks what happened in the second half of the month.
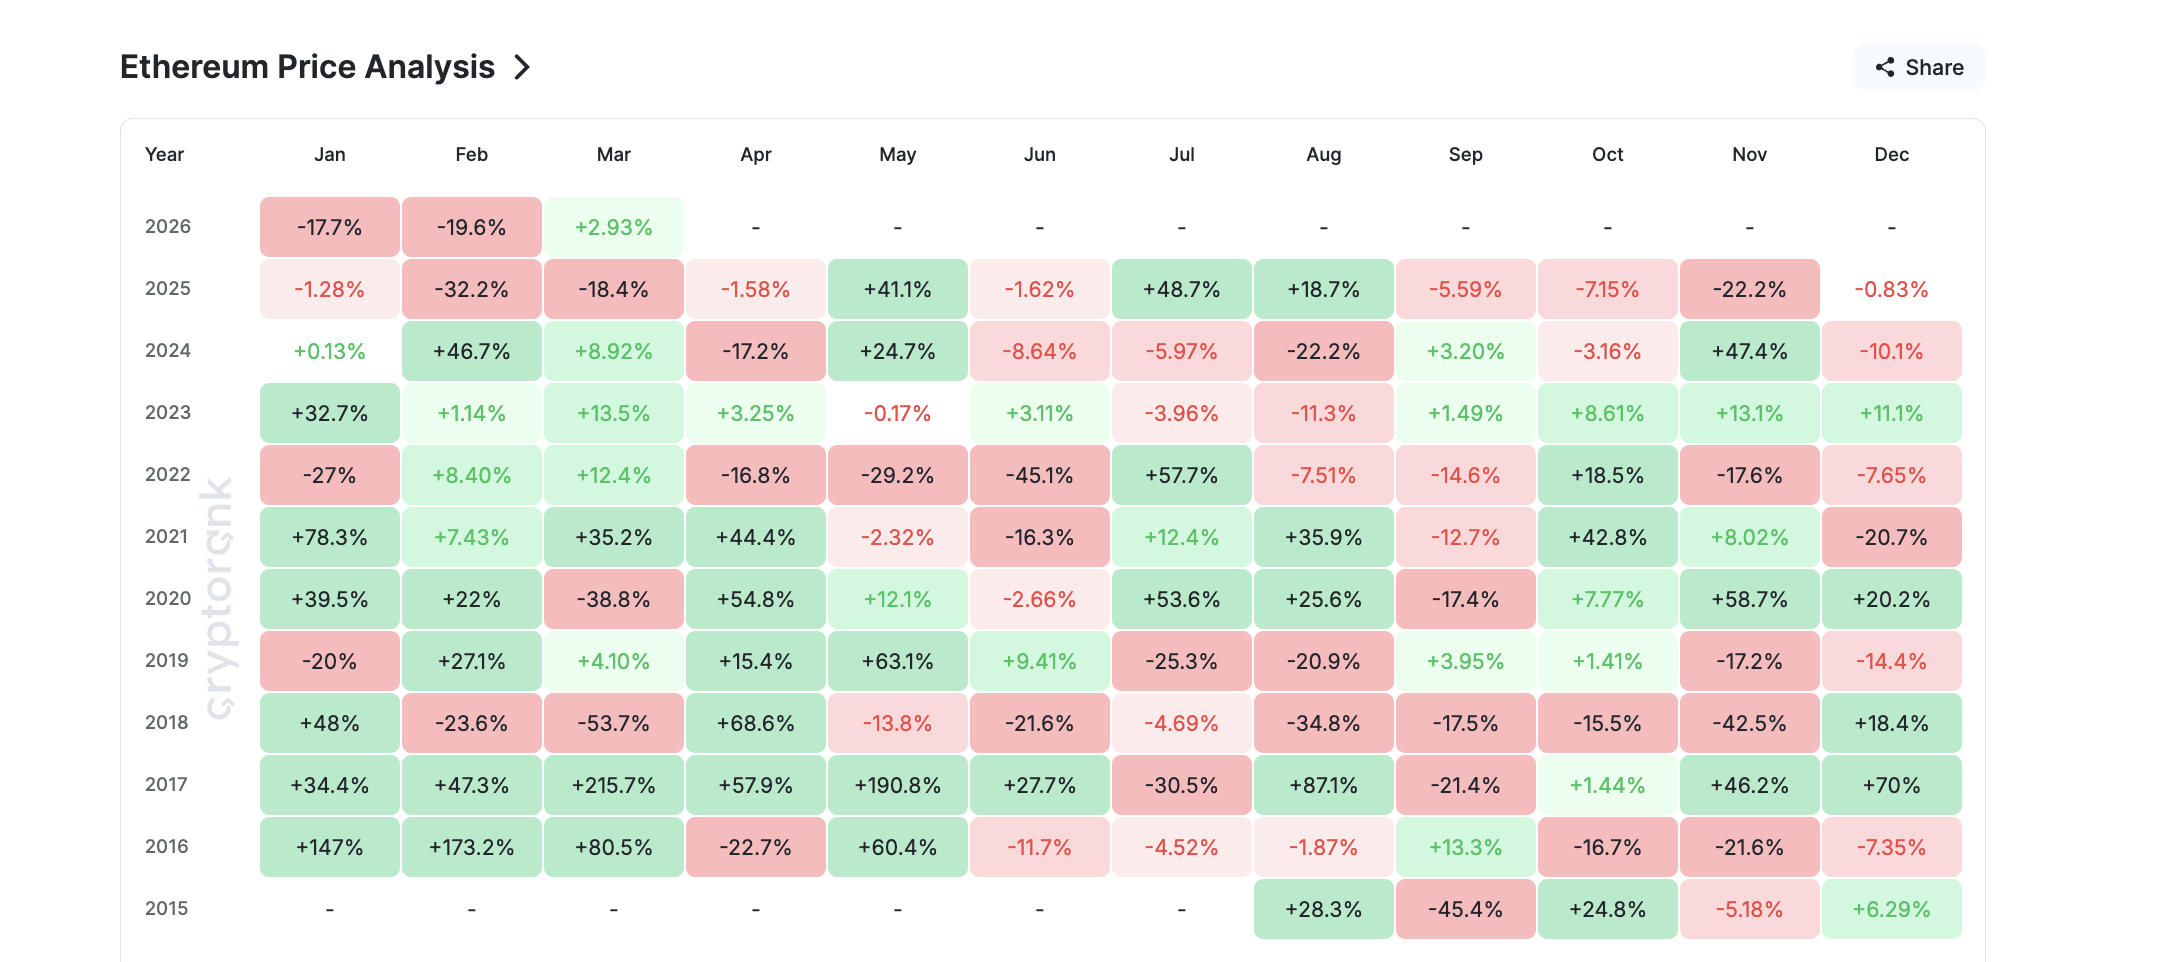 Ethereum Monthly Returns: CryptoRank
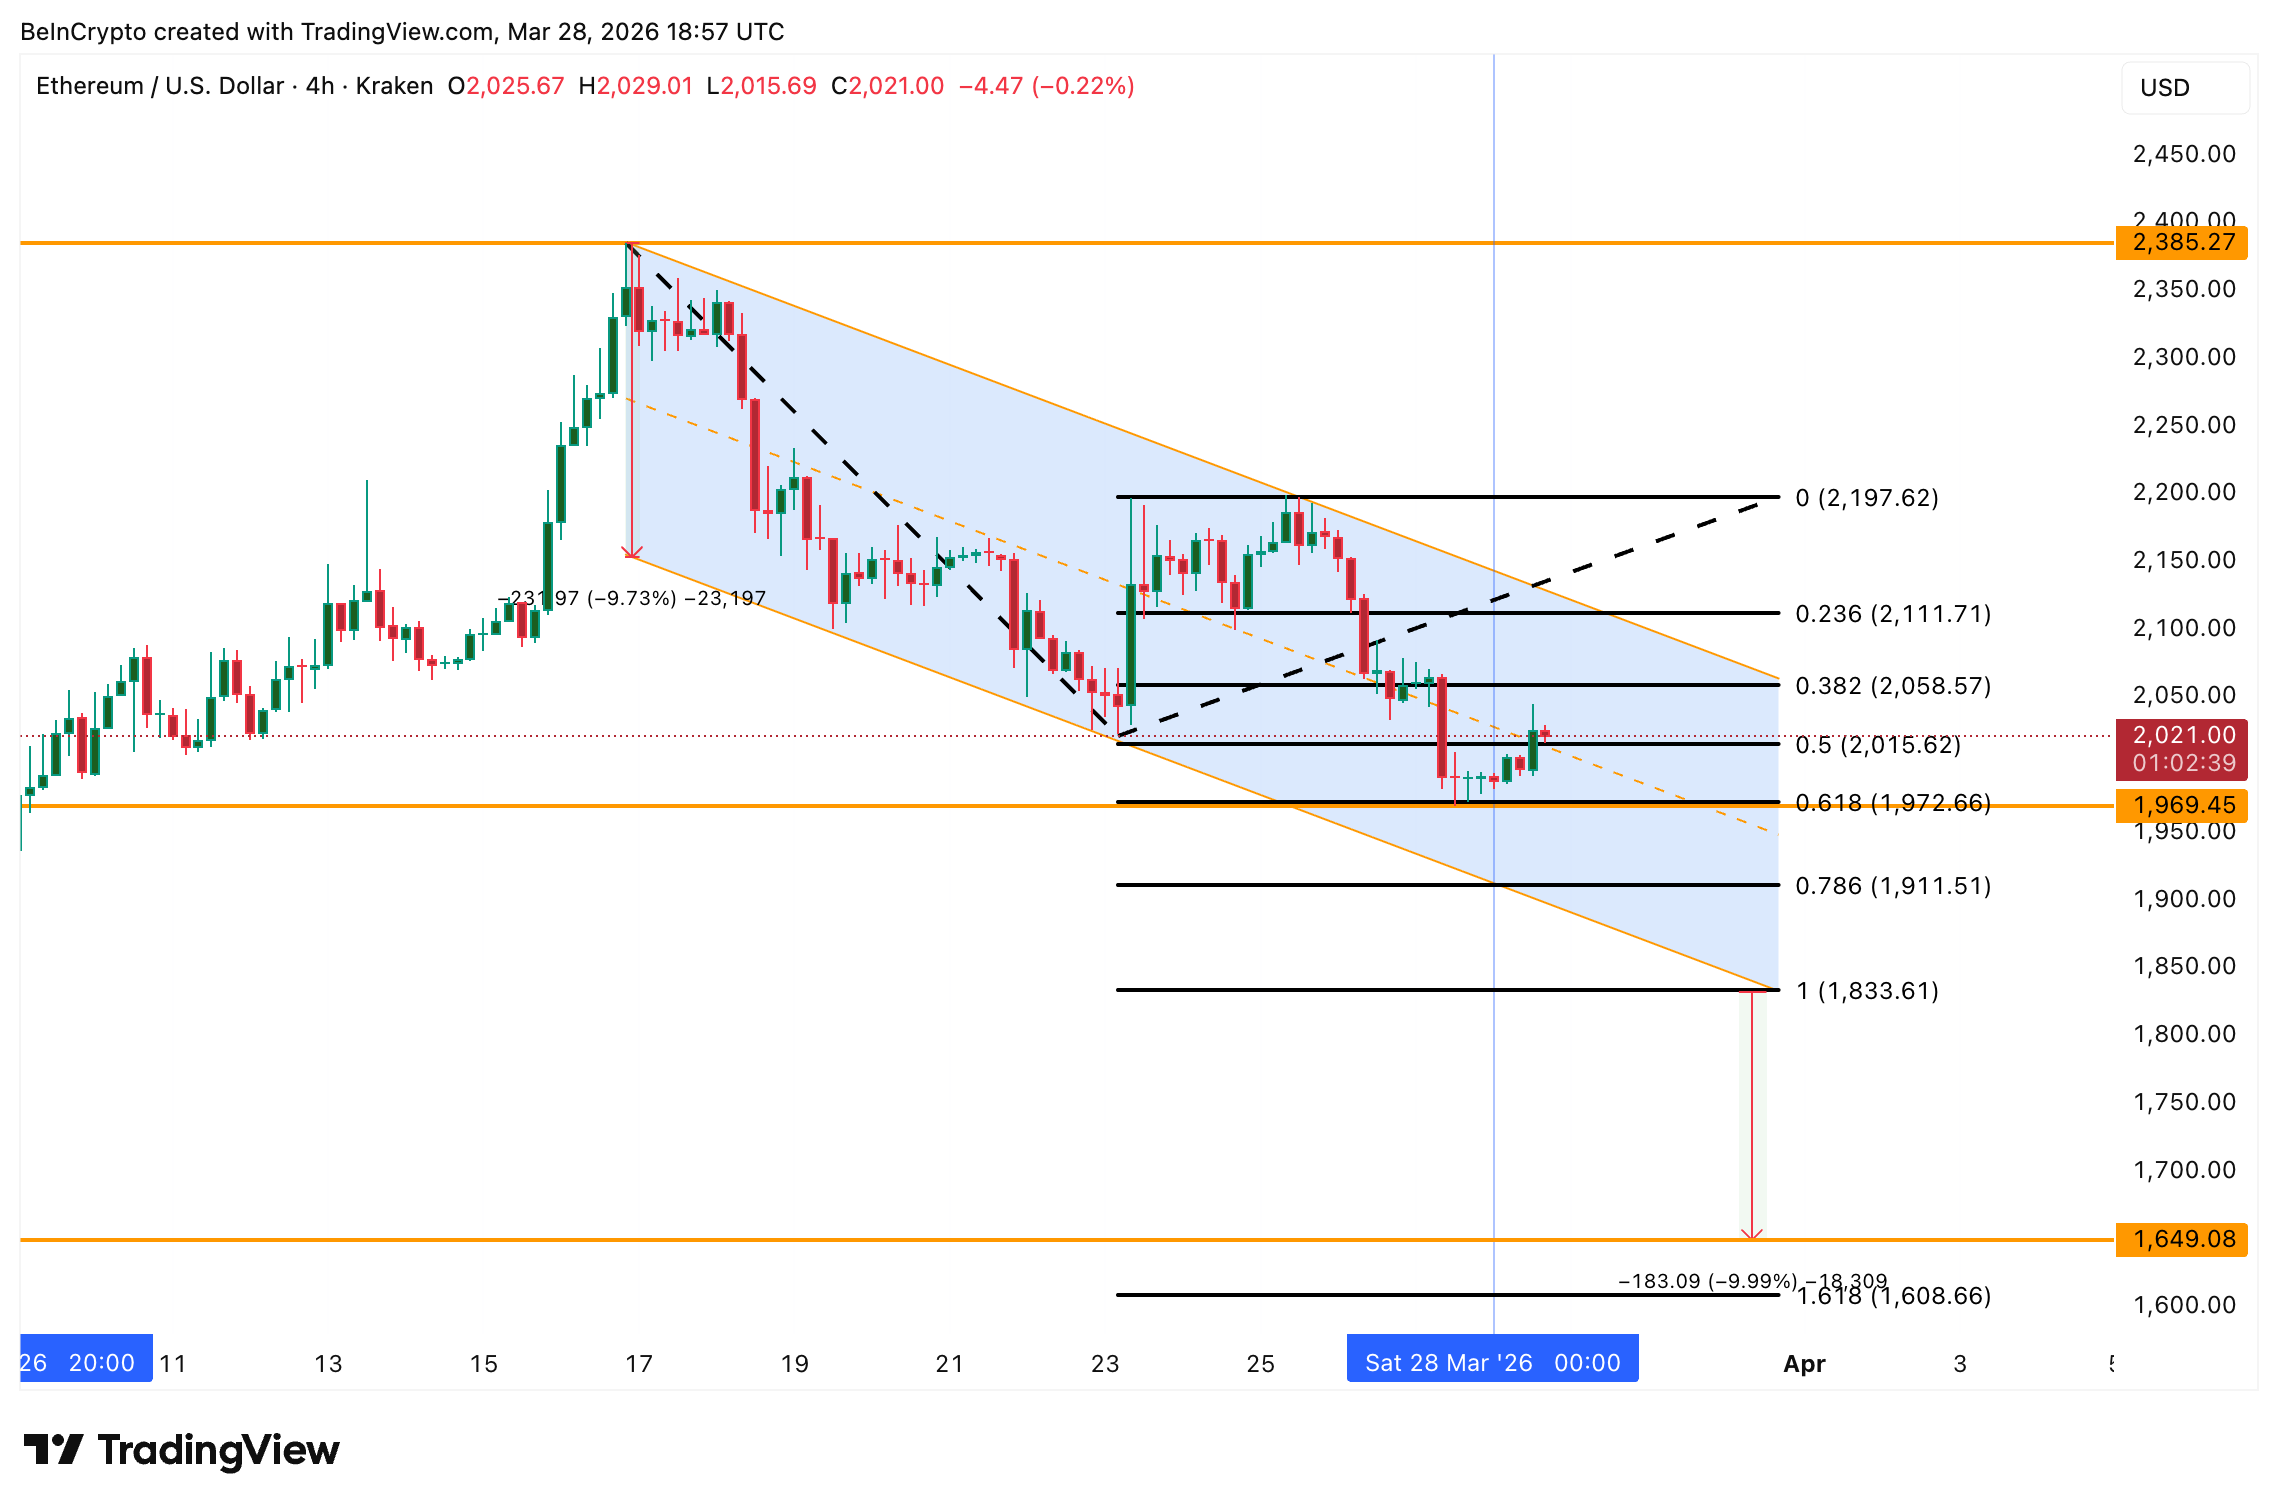
On the 4-hour chart, Ethereum price has been trading inside a falling channel since March 16, when it peaked at $2,380. The channel has pushed ETH as low as $1,970, a correction of roughly 18% from the mid-March high. The ETH price currently sits near $2,020, still within the channel and still trending lower.
Want more token insights like this? Sign up for Editor Harsh Notariya’s Daily Crypto Newsletter here.
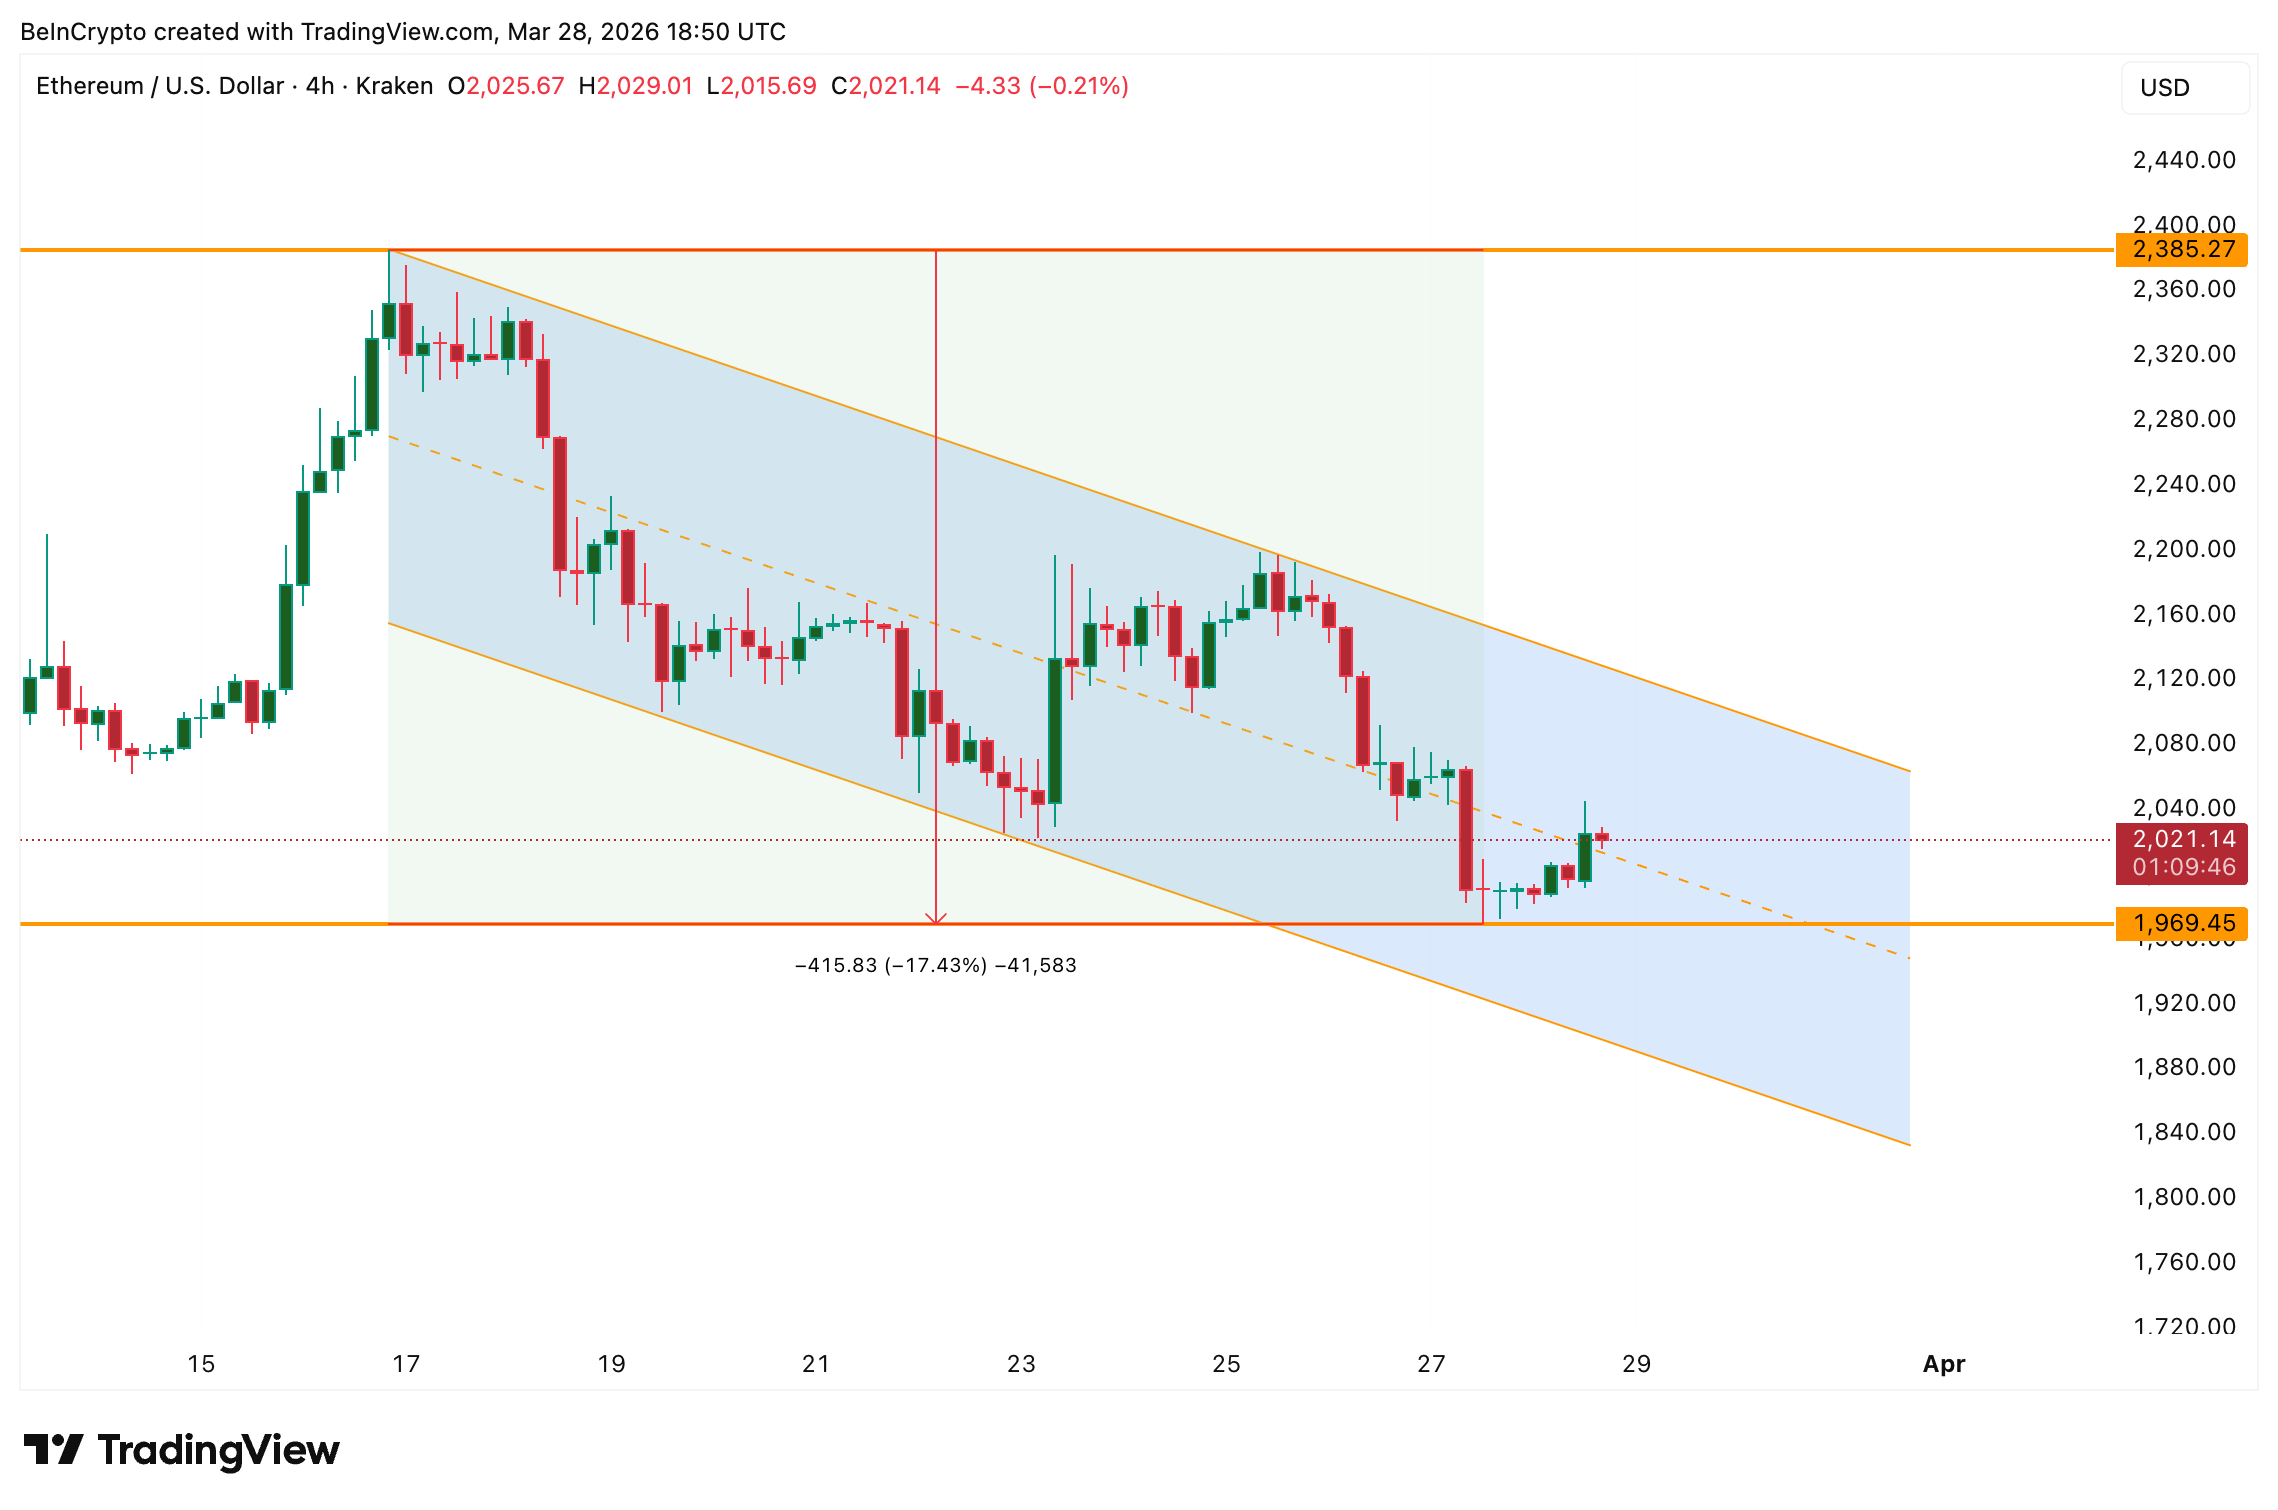 4-Hour Falling Channel: TradingView
The first half of March delivered the gains. The second half has been steadily giving them back. If the channel continues to compress the price toward the lower boundary, the remaining days of March could determine whether the streak breaks or extends.
Two conviction-based metrics suggest the bears are gaining ground heading into the month’s close.
Whales Are Dropping and Dip Buyers Are Fading
Ethereum whale wallets, excluding exchange addresses, held 122.91 million ETH as recently as 48 hours ago. That balance has since dropped to 122.73 million, a reduction of roughly 180,000 ETH. The timing is concerning because it coincides with the price sliding toward the lower end of the falling channel.
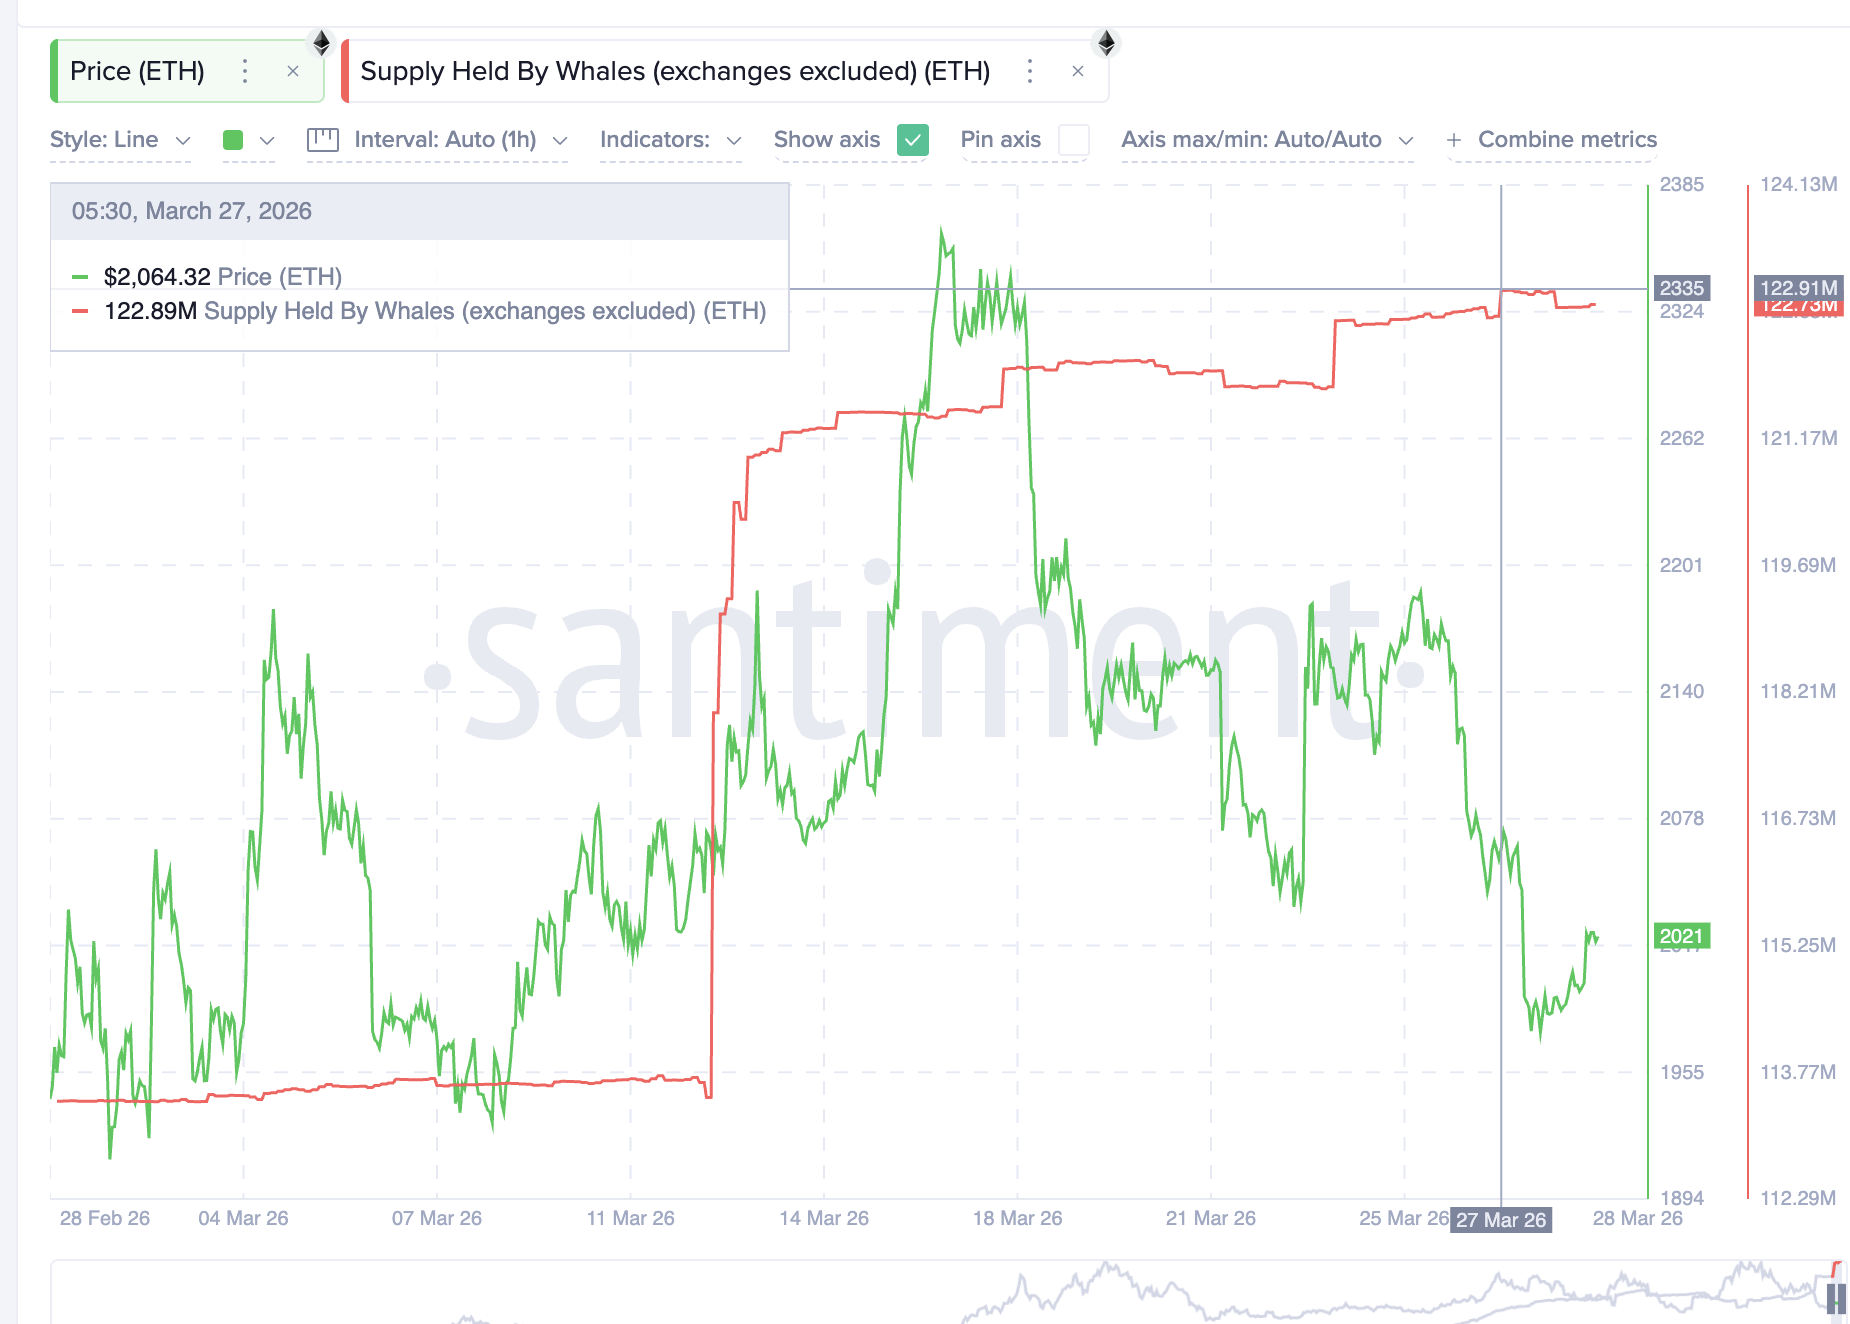 Whale Supply: Santiment
The Money Flow Index (MFI), a volume-weighted momentum indicator that acts as a proxy for buying, adds another layer of concern. Between March 8 and March 28, the Ethereum price trended higher on the 4-hour chart. However, the MFI during the same window trended lower.
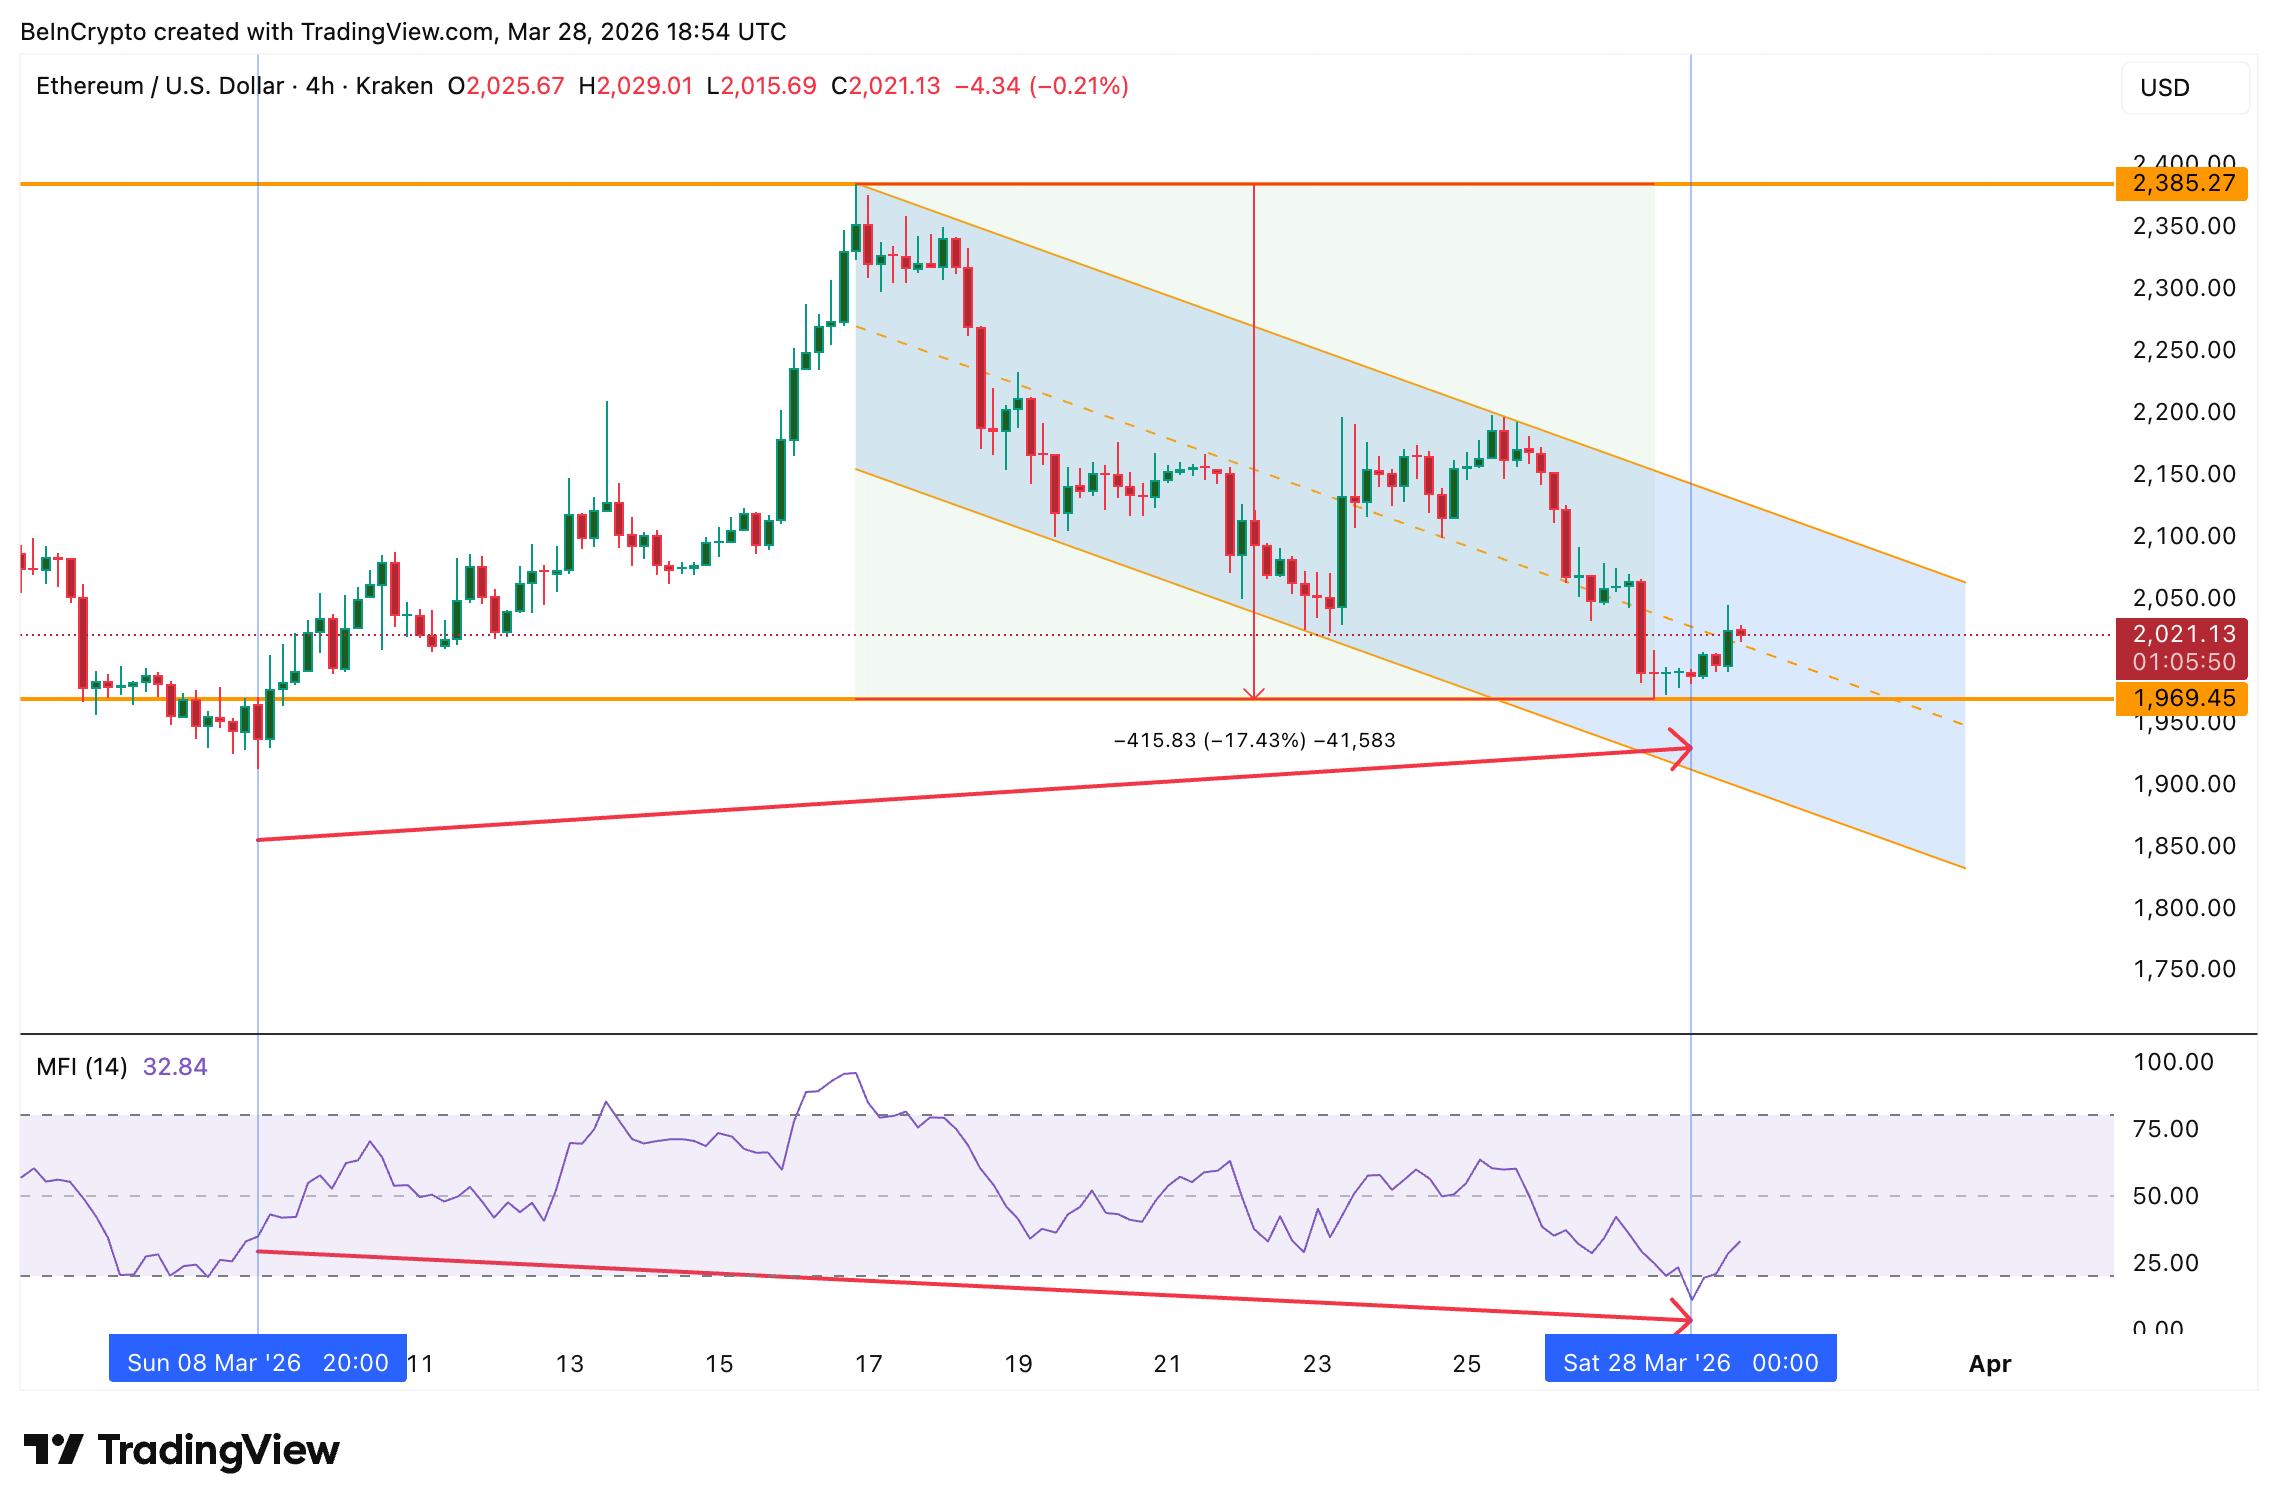 MFI Bearish Divergence: TradingView
That bearish divergence means dip-buying support has been weakening throughout March, even while the monthly price action stayed green. Each successive dip attracted less buying volume than the one before. When whales are reducing, and dip buyers are fading simultaneously, the conviction floor beneath the current price becomes thinner.
If the broader market continues to weaken, these two metrics suggest Ethereum may not have the demand to hold its March gains.
Ethereum Price Forecast and the $1,970 Zone
The key level is $1,972 (the $1,970 zone). It has held as support since early March.
A 4-hour close below $1,970 would break both the strongest support level (the 0.618 Fib level) and push ETH closer to the falling channel’s lower boundary.
Below that, $1,910 and $1,830 come into play. A break under $1,830 would confirm the channel breakdown, and the projected drop of roughly 10% from that level targets the $1,650 zone. However, that kind of drop might still take some time to materialize.
 Ethereum Price Analysis: TradingView
On the upside, ETH needs to reclaim and hold above the $2,050 zone to relieve immediate pressure. Above that, the channel’s upper boundary near 2,110 becomes the first real test of strength.
For now, $1,970 separates Ethereum’s first green month in seven from a breakdown that could push it toward $1,650.
Recommended Articles


