

Ethereum Price Forecast: ETFs pull in $169M as validators pile in to stake ETH
Ethereum price today: $2,080
- Ethereum ETFs recorded $169 million in net inflows on March 4, the largest in two months.
- Ethereum’s validator entry queue climbed to 3.4 million, signaling continued institutional confidence in staking despite market volatility and geopolitical tensions.
- ETH is under pressure at the $2,110 resistance level.
US spot Ethereum exchange-traded funds (ETFs) recorded $169 million in net inflows on Wednesday, marking the largest daily intake in two months, according to SoSoValue data. The rise in inflows signals renewed institutional interest in Ethereum amid broader market volatility.
The largest inflows went to Grayscale’s Ethereum Mini Trust ETF, which pulled in $59 million. BlackRock’s iShares Ethereum Trust followed with $39 million, while Fidelity Investments’ Ethereum Fund attracted $30 million.
The combined inflows pushed daily totals close to the January peak of $175 million. The inflows coincided with escalating geopolitical tensions in the Middle East. Investors appear to be rotating capital out of traditional assets into crypto as a hedge against global uncertainty.
At the same time, Ethereum’s validator queue has expanded significantly. The entry queue has risen to roughly 3.4 million ETH, while the exit queue has fallen to 58,944 ETH, according to Validatorqueue.com.
The increase extended validator wait times to 57 days, reflecting strong participation in Ethereum’s network security. The rise in entries suggests that large holders are continuing to stake ETH for yield rather than liquidating holdings during periods of market volatility.
Ethereum Price Forecast: ETH under pressure at $2,110
Ethereum saw $58 million in liquidations over the past 24 hours, led by $35.7 million in long liquidations, per CoinGlass data.
In the daily chart, ETH trades at $2,080. The near-term bias is neutral with a modest bullish tilt as price holds above the recent $1,850 zone while momentum stabilizes. The Relative Strength Index (RSI) has recovered toward the mid-40s from oversold territory, and the Stochastic Oscillator (Stoch) has retreated from overbought levels after a sharp rebound, suggesting reduced downside pressure but not a confirmed uptrend.
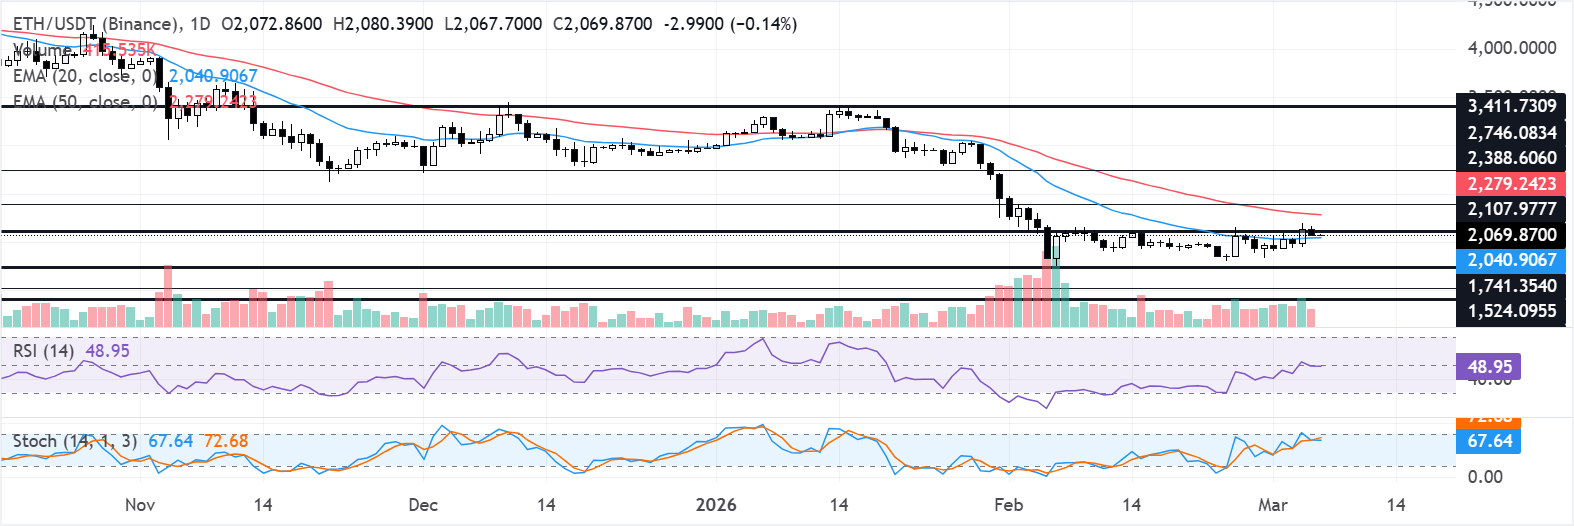
Price remains under pressure near the 20-day Exponential Moving Average (EMA) around $2,040–$2,050, keeping recovery attempts in check, while the much higher 50-day EMA near $2,280 underscores that the broader trend remains under strain despite the recent bounce.
Immediate resistance is located at $2,108, where recent highs converge with the 20-day EMA, and a daily close above this area would open the path toward $2,388 and then $2,746 as the next upside levels. Initial support stands at $1,741, with a break below exposing $1,524 and then $1,404, which defines the lower boundary of the broader range.
(The technical analysis of this story was written with the help of an AI tool.)
Recommended Articles


