


Cardano Price Forecast: ADA recovers from key support amid uncertain market conditions
- Cardano is up nearly 1% on Monday after nearly 3% losses the previous day.
- Derivatives data shows mixed retail sentiment, with funding rates remaining positive despite sharp liquidations.
- The technical outlook for Cardano puts focus on the immediate support level at $0.2593.
Cardano (ADA) recovers nearly 1% at press time on Monday following nearly 3% losses the previous day. Retail sentiment for Cardano remains mixed due to intense liquidations in ADA derivatives, while the positive funding rate skews the bias bullish. The technical outlook for ADA focuses on the crucial support level near $0.2593.
The mixed sentiment surrounding Cardano is persistent, with the rising fear in the broader cryptocurrency market due to the US and Israel attack on Iran. The escalating tensions leading to the blockage of the Strait of Hormuz are affecting global oil supply and shifting macroeconomics conditions.
Mixed sentiments keep Cardano on edge
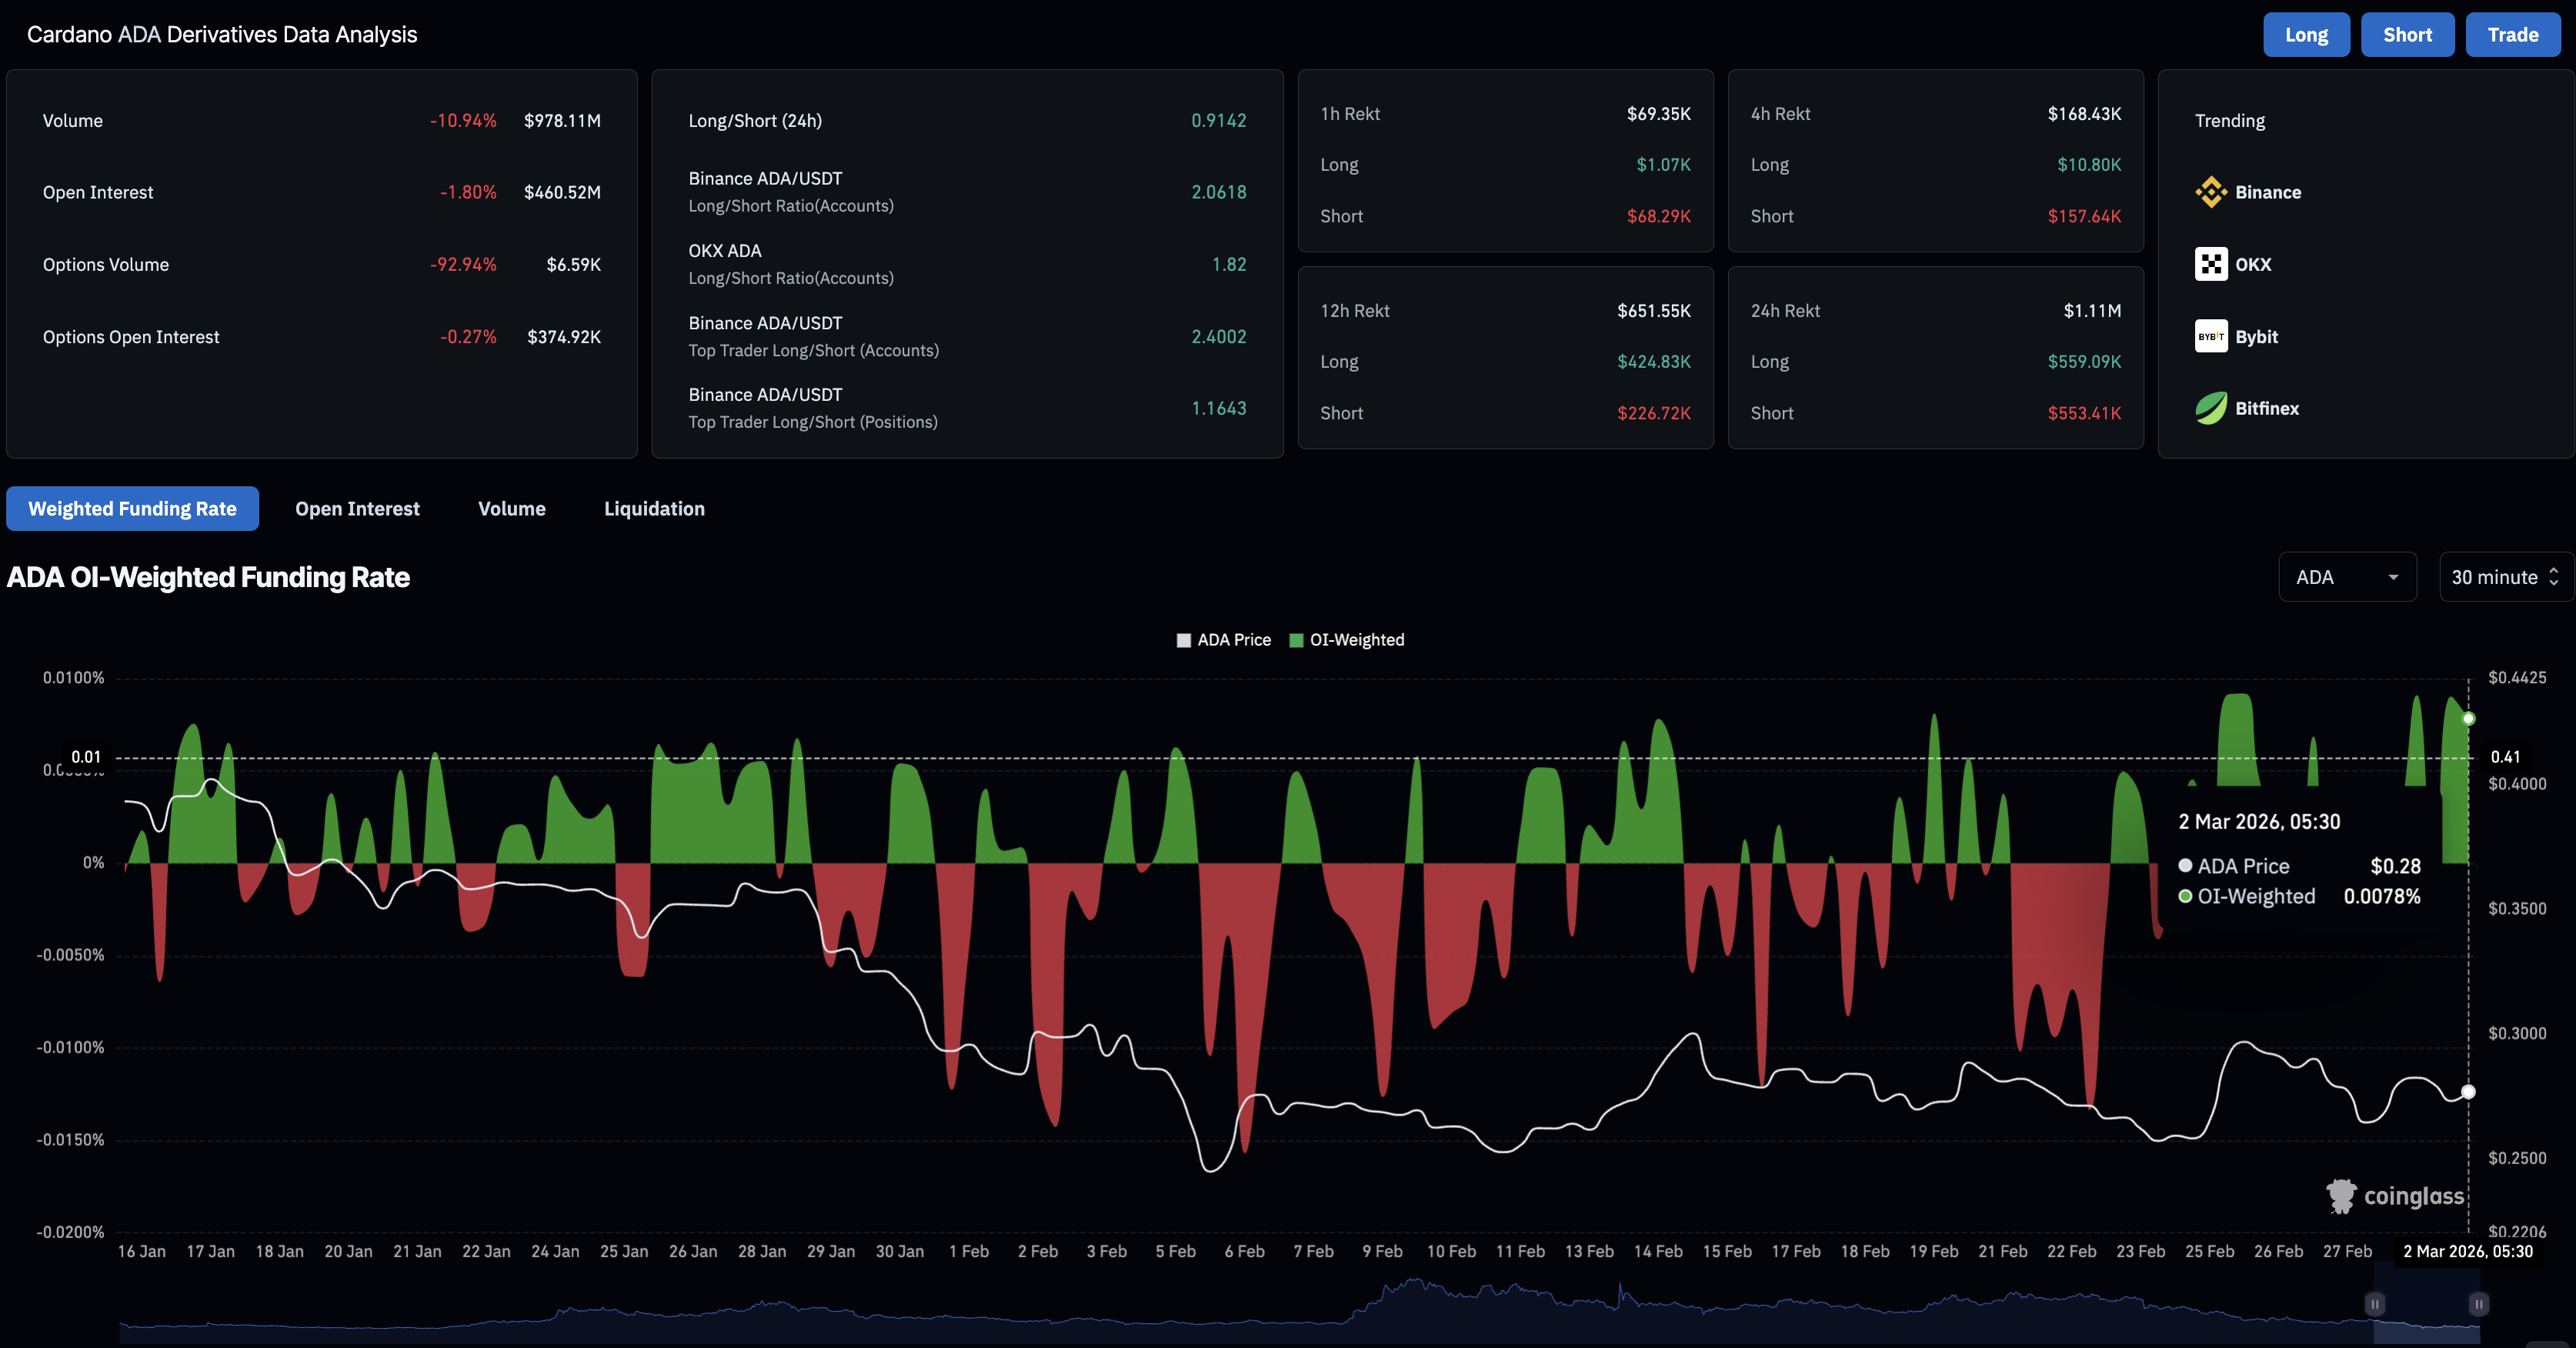
CoinGlass data shows the ADA futures Open Interest (OI) is down nearly 2% over the last 24 hours to $460.52 million, indicating a loss in positional buildup and a risk-averse condition. Consistent with this capital outflow, liquidations of $1.11 million over the last 24 hours, led by $559,090 in long liquidations and $553,410 in short liquidations, reflecting a nearly equal wipeout of either side.
Still, the funding rate remains at 0.0078% on Monday, suggesting persistent bullish interest among traders to hold long positions at an additional premium.
Technical outlook: Will Cardano bounce back toward $0.30?
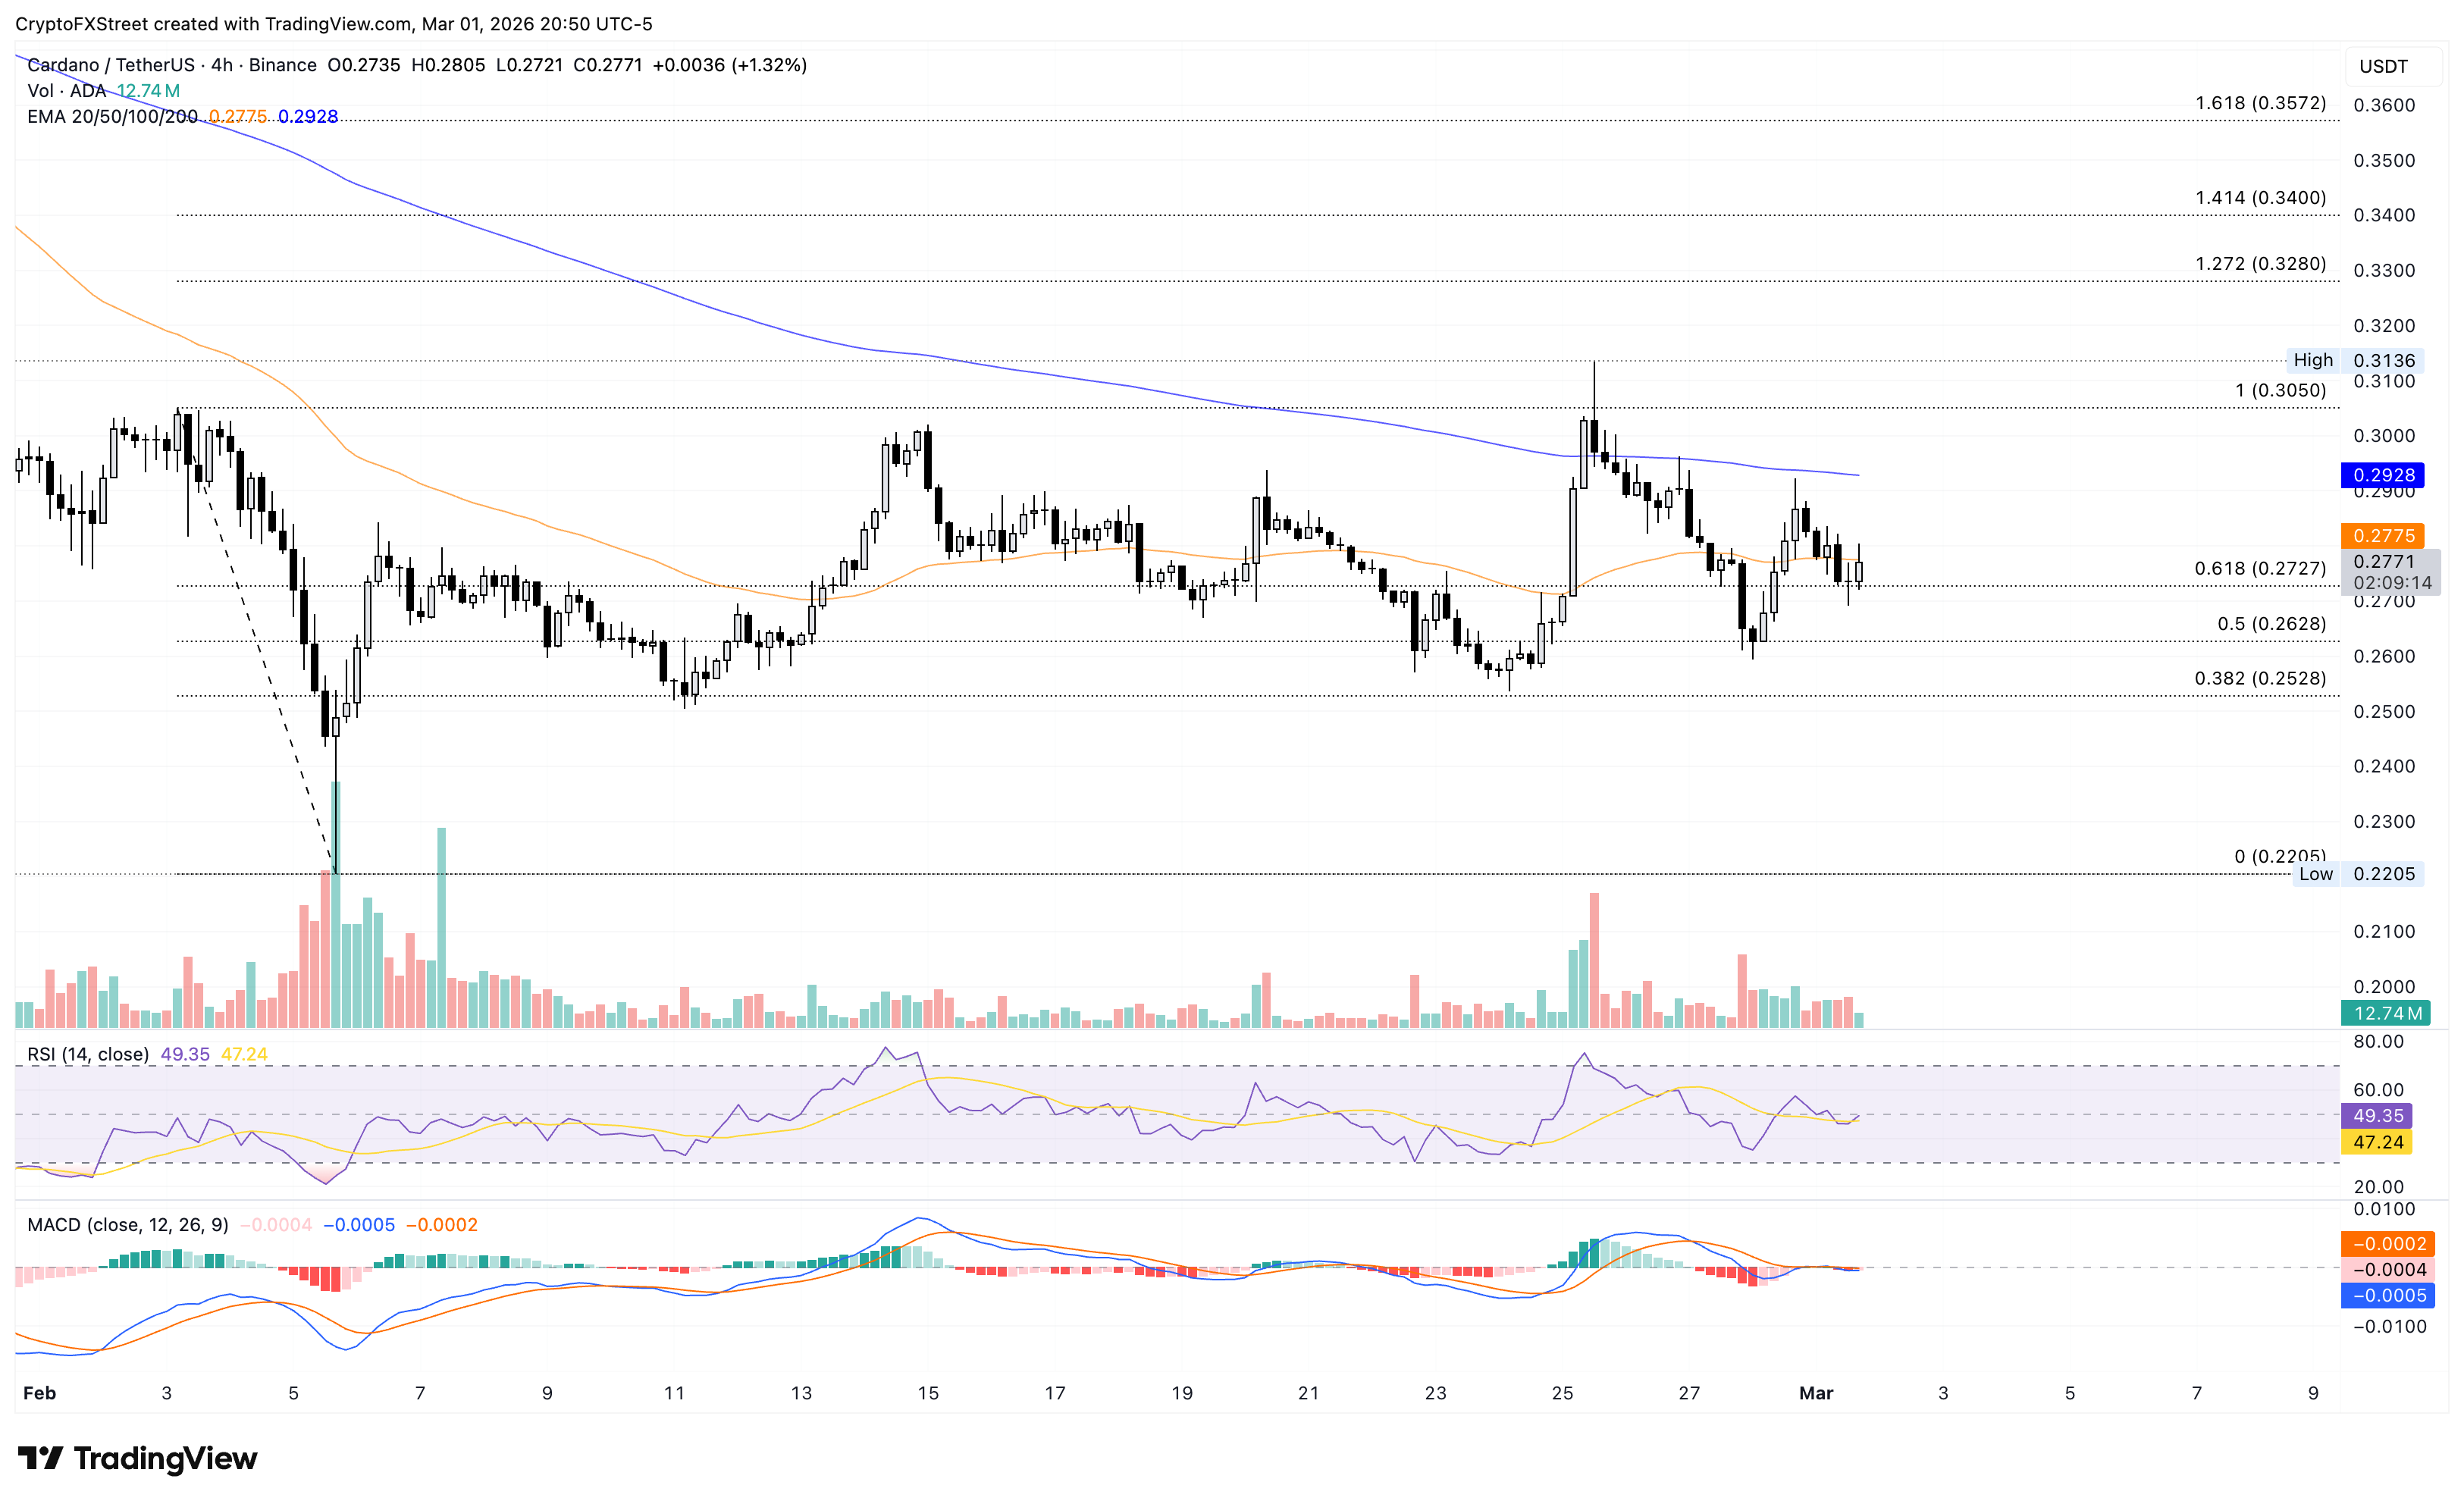
Cardano trades above $0.2770 at press time on Monday, testing the 50-period Exponential Moving Average (EMA) at $0.2775. However, the declining 50-period and 200-period EMAs keep the broader trend bearish.
The Moving Average Convergence Divergence (MACD) slips below the signal line into negative territory on the 4-hour chart amid a muted histogram, reinforcing a lack of strong directional momentum. The Relative Strength Index (RSI) at 49 on the same chart remains close to the midline, indicating balanced forces on either side as Cardano recovers on Monday.
The 61.8% Fibonacci retracement level at $0.2695, measured from the February 3 high at $0.3050 to the February 6 low at $0.2289, serves as crucial support, capping downside risk to the 50% retracement at $0.2628.
If sellers regain control, the 38.2% retracement at $0.2528 would be the next downside support in an extended correction.
On the upside, Cardano should exceed the 50-period EMA at $0.2775, which could open the door to the 200-period EMA at $0.2928.
(The technical analysis of this story was written with the help of an AI tool.)
Recommended Articles


