

Solana Price Forecast: SOL enters survival mode on losing key support level

Source Fxstreet
  • Solana declines below $80 on Tuesday after Monday’s 6% fall, marking the third consecutive day of losses.
  • US spot SOL ETFs record their ninth consecutive day of inflows, totaling roughly $8 million on Monday.
  • Derivatives market data reflects a bearish tilt, as rising long liquidations push the long-to-short ratio below 1.

Solana (SOL) trades below $80 at press time on Tuesday, extending its 6% drop from Monday amid increased sell pressure as the market leader, Bitcoin (BTC), dropped below $64,000. The institutional support holds for Solana with Exchange Traded Funds (ETFs) expanding exposure, while the derivatives market succumbs to market fear. The technical outlook for Solana focuses on a key support level near $75, which caps downside risk toward $67. 

Institutions favor Solana amid market downturn

Solana remains a consistent choice for institutional investors despite the broader market stress. US spot Solana ETFs recorded $7.99 million in inflows on Monday, extending the accumulation spree for the ninth consecutive trading session. 
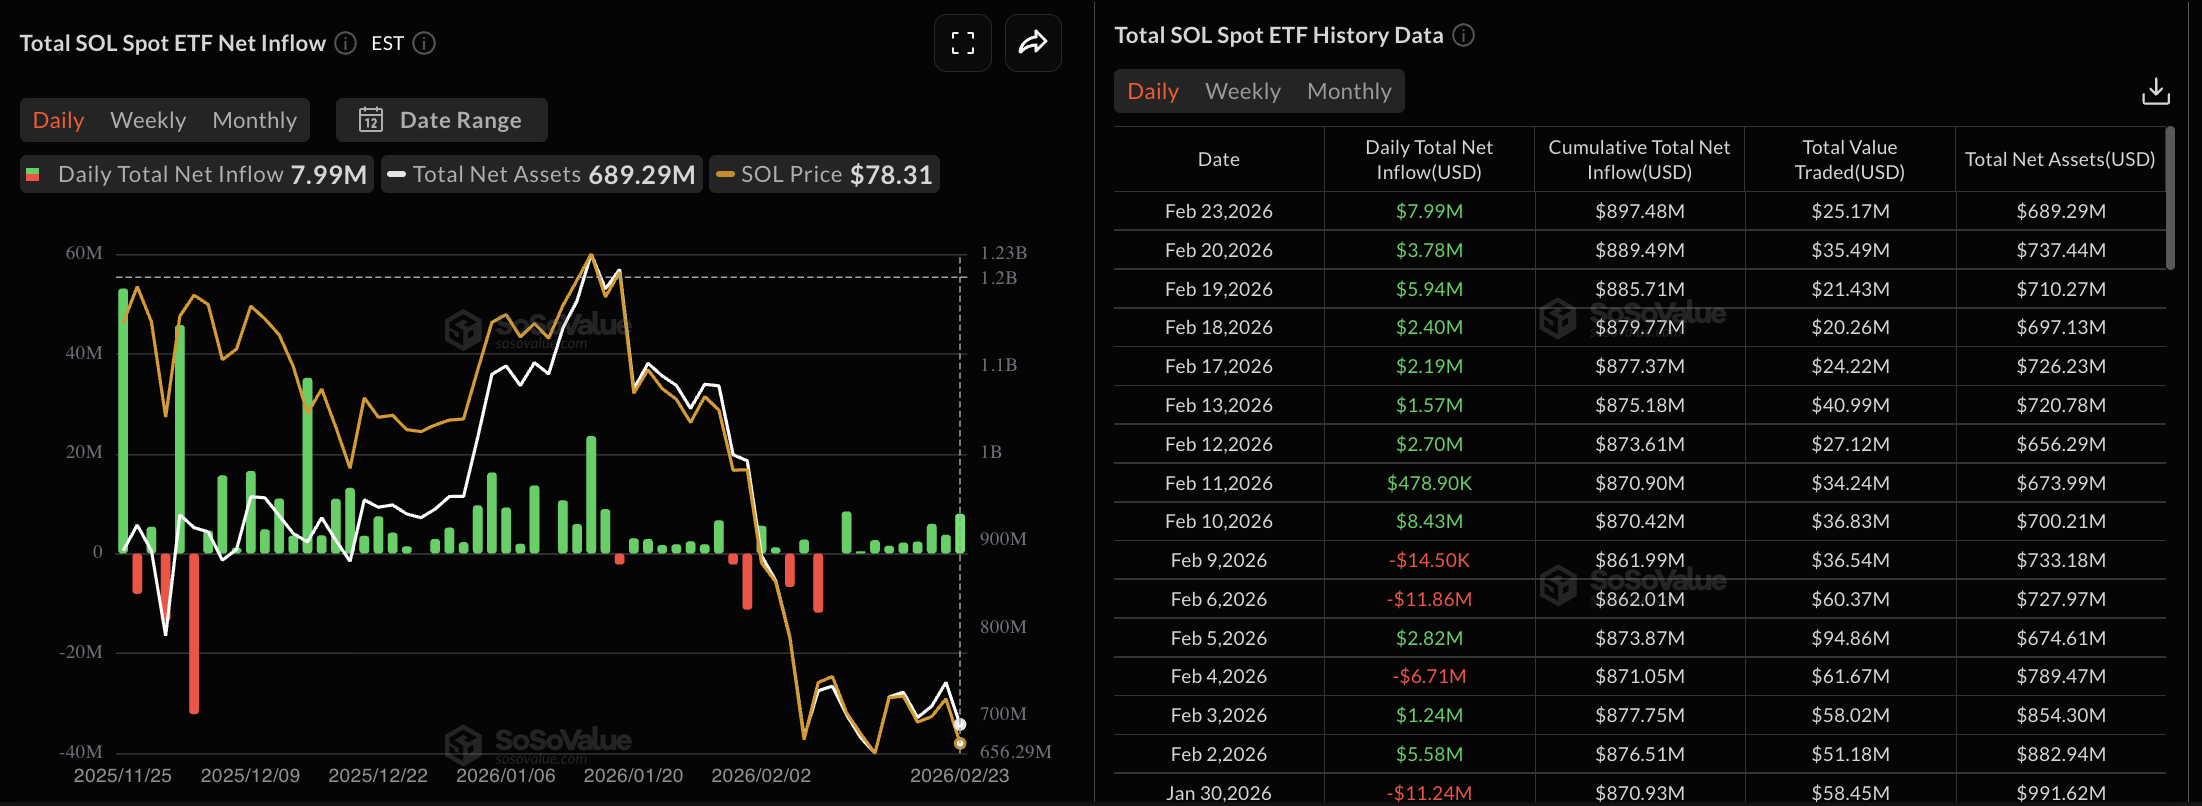
SOL ETFs data. Source: Sosovalue

On the derivatives side, retail sentiment suggests a bearish bias. CoinGlass data shows SOL Open Interest (OI) at $4.92 billion on Tuesday, down 1.44% over the last 24 hours, suggesting risk-off sentiment among traders. The long liquidation over the same time period accounts for $15.97 million, significantly higher than the short liquidations of $3.46 million. Declining OI amid increased long liquidations suggests that the bullish positional buildup in Solana futures was hit, driving the traders to the sidelines.

The wipeout of long positions dropped the long-to-short ratio to 0.9627, which indicates a greater number of short positions left active. Additionally, the funding rate remains negative at -0.0027%, reaffirming the bias that traders are leaning toward holding short positions.
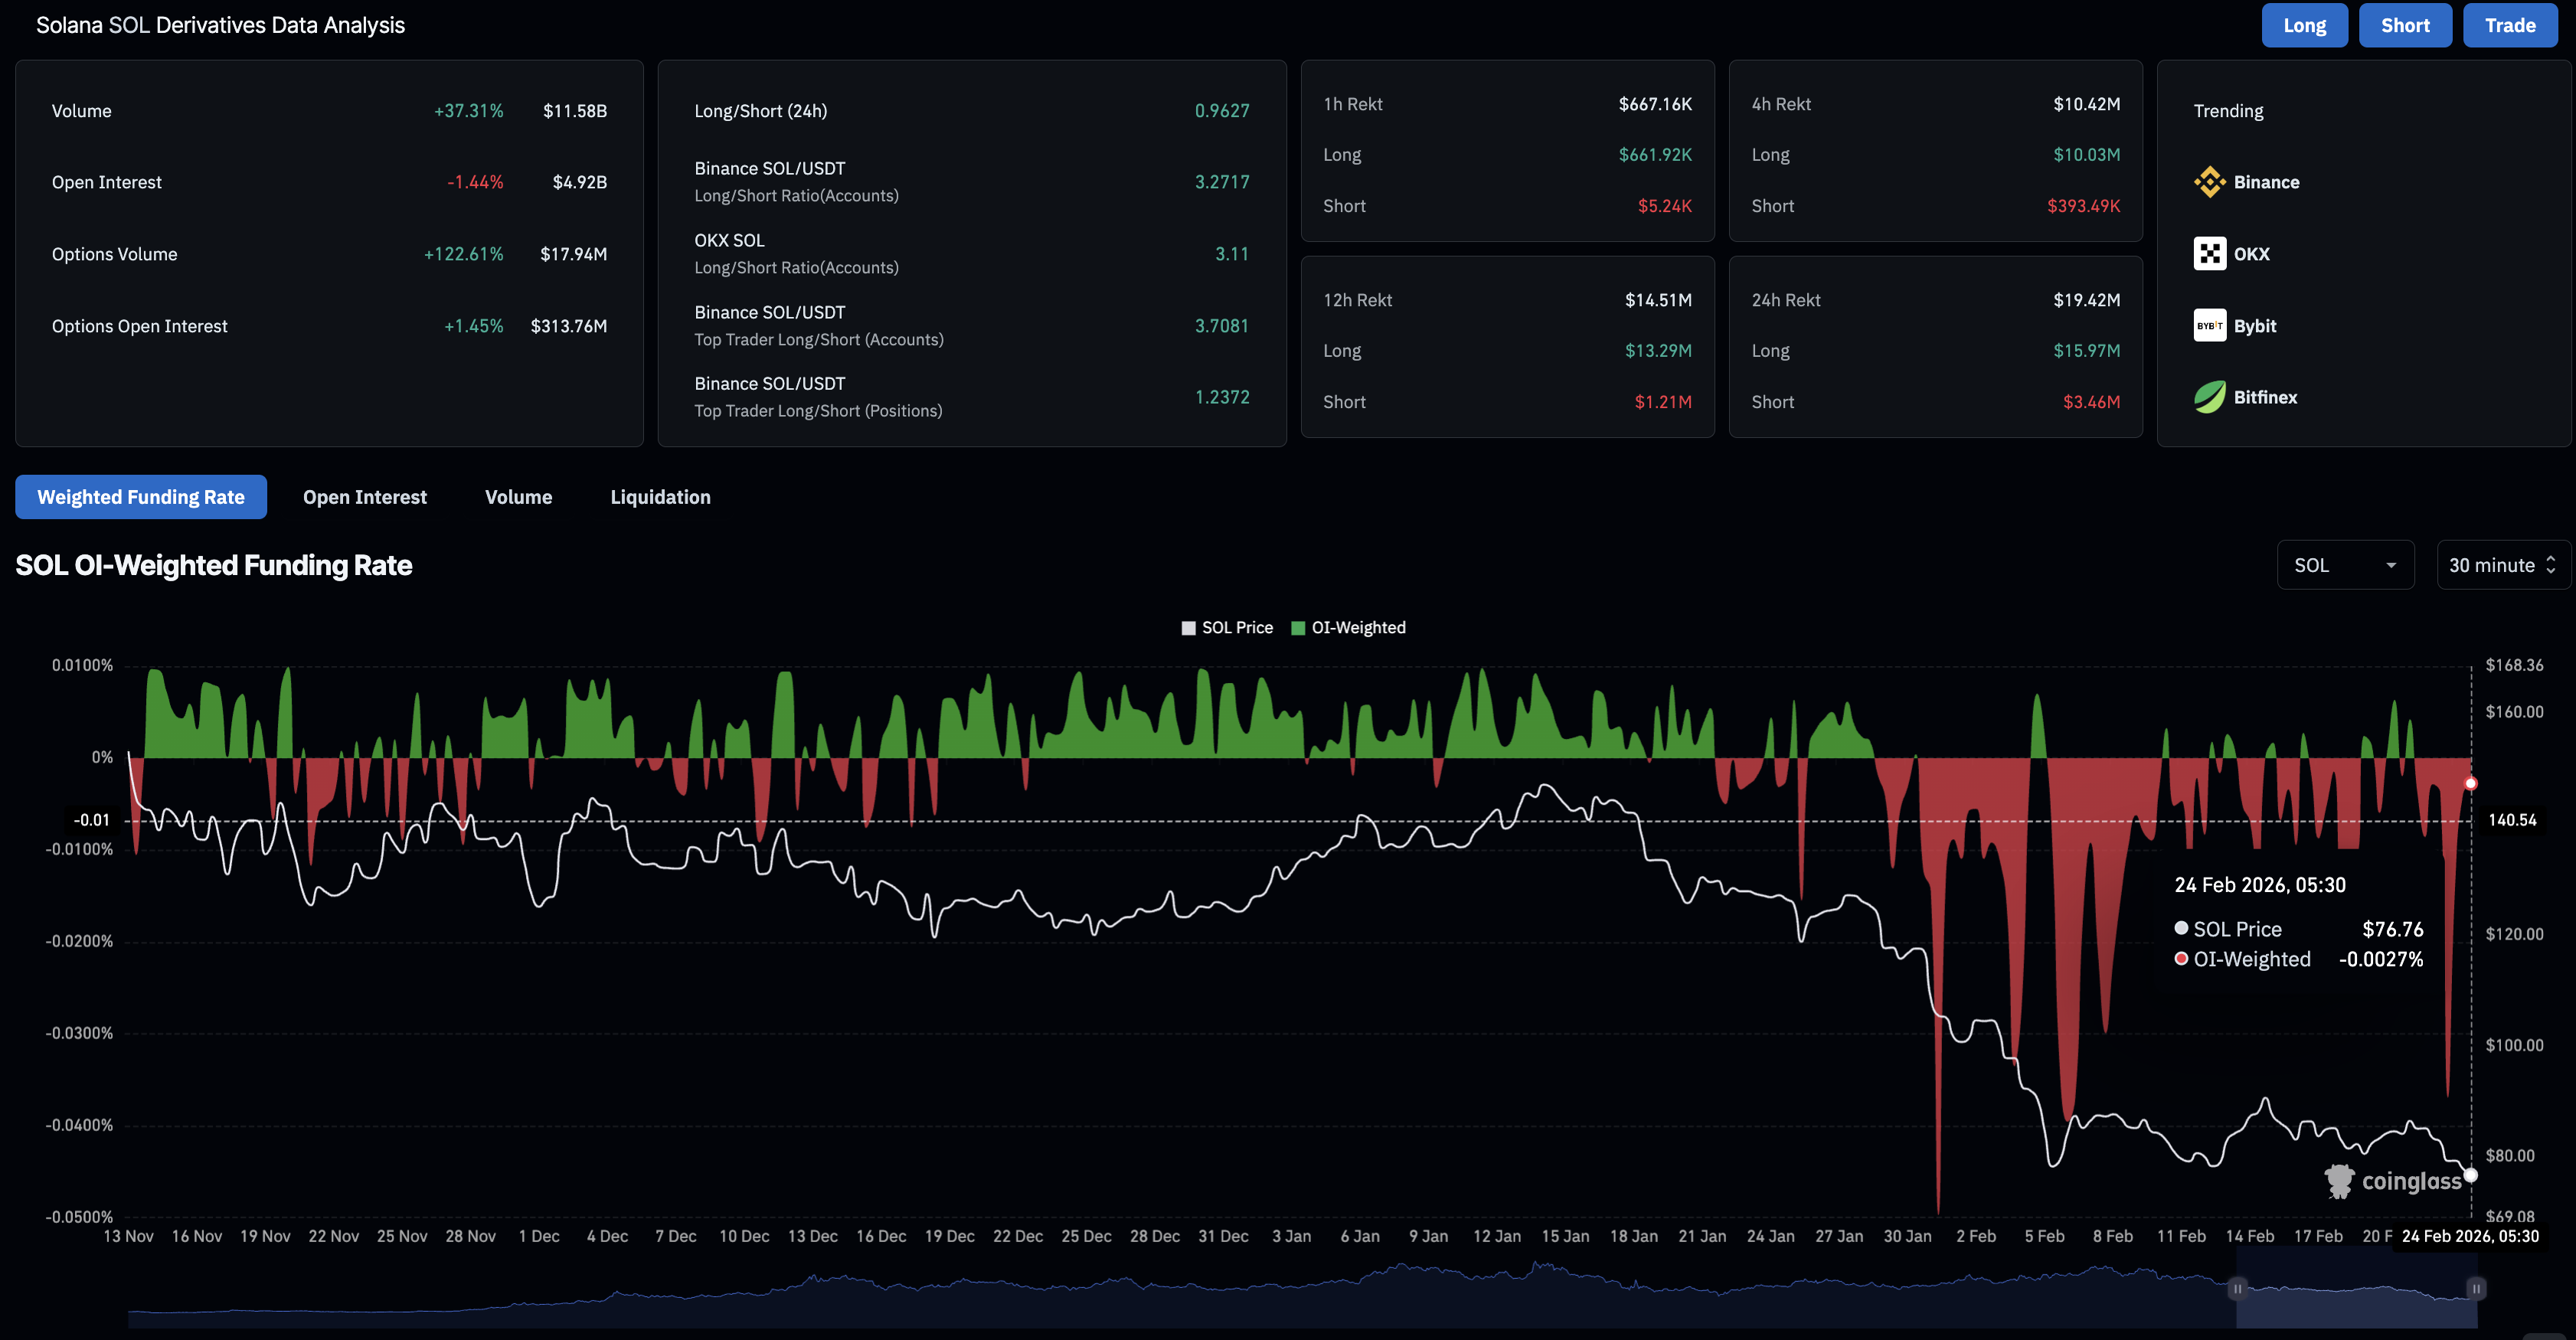
SOL derivatives data. Source: CoinGlass

Technical Analysis: Will Solana extend its fall below $70?

Solana is extending its decline below $80 at press time on Tuesday, resulting in its third consecutive day of losses. SOL remains below the 50- and 200-day Exponential Moving Averages (EMAs), with both slopes lower, indicating a bearish bias. 

Solana approaches the 23.6% trend-based Fibonacci retracement level at $75.74, measured from the January 13 high at $148.74 to the February 15 high at $91.26, including the February 6 low at $67.50. 

If Solana clears below this support level, it could extend the decline to the February 6 low at $67.50, followed by the 50% trend-based Fibonacci retracement level at $61.48. 

The technical indicators on the daily chart suggest that the short-term recovery is losing strength. The Moving Average Convergence Divergence (MACD) reverses toward the signal line while both remain below zero, and positive histograms contract, suggesting fading bullish momentum. At the same time, the Relative Strength Index (RSI) is at 31, stretched to the downside, and shows nearly oversold conditions. 

Chart Analysis SOL/USDT (Binance)
SOL/USDT daily price chart.

On the upside, a potential rebound from this key support could challenge the February 15 high at $91.26, followed by a higher resistance at the 50-day EMA at $102.90.

(The technical analysis of this story was written with the help of an AI tool.)

Disclaimer: For information purposes only. Past performance is not indicative of future results.
placeholder
Bitcoin falls below $75,000 as the CLARITY Act fails in the Senate — what the vote means for cryptoThe US Senate blocked the Digital Asset Market CLARITY Act in a 49-50 procedural vote, sending Bitcoin briefly below $75,000 — its biggest one-day drop since June. Ethereum fell more than 8%, Coinbase slid 10% and $75 billion of crypto market value evaporated. Here is what the vote was, why it failed, and the levels that matter now.
Author  Suzie
Sep 16, Wed
The US Senate blocked the Digital Asset Market CLARITY Act in a 49-50 procedural vote, sending Bitcoin briefly below $75,000 — its biggest one-day drop since June. Ethereum fell more than 8%, Coinbase slid 10% and $75 billion of crypto market value evaporated. Here is what the vote was, why it failed, and the levels that matter now.
placeholder
Dollar index tops 100 for the first time since July as the Fed's hawkish dot plot sinks inThe U.S. dollar index broke back above 100 for the first time since 31 July after the Fed delivered its first rate hike since 2023, with the dot plot showing 16 of 18 officials expect at least one more increase this year. Here are the levels that matter for DXY, the currencies feeling it most, and what to watch next.
Author  Irene Q.
Sep 17, Thu
The U.S. dollar index broke back above 100 for the first time since 31 July after the Fed delivered its first rate hike since 2023, with the dot plot showing 16 of 18 officials expect at least one more increase this year. Here are the levels that matter for DXY, the currencies feeling it most, and what to watch next.
placeholder
US to delay new "overcapacity" tariffs on China — what the pause means for trade, inflation and the dollarWashington is expected to hold off announcing new tariffs over Chinese "overcapacity" until after the 24 September summit, according to Bloomberg. The postponed plan would have added 7.5% to Chinese goods, taking second-term US tariffs to around 20%. Here is what is on the table, and what a deal versus no deal would mean for the yuan, Hong Kong equities and the dollar.
Author  Mitrade
Sep 18, Fri
Washington is expected to hold off announcing new tariffs over Chinese "overcapacity" until after the 24 September summit, according to Bloomberg. The postponed plan would have added 7.5% to Chinese goods, taking second-term US tariffs to around 20%. Here is what is on the table, and what a deal versus no deal would mean for the yuan, Hong Kong equities and the dollar.
placeholder
Gold ends three-week slide at the $4,400 line — eight straight days of ETF inflows vs a 5% 10-year and a 100 dollarSpot gold closed Friday at $4,378.39, up 0.84% on the day and about 0.8% for the week — its first weekly gain in four weeks — with the intraday high of $4,399.67 leaving it 33 cents shy of the $4,400 line. Gold ETFs have now logged eight straight sessions of inflows, but with the 10-year back above 5% and the dollar index near 100, here is what decides whether this is a reversal or a bounce.
Author  Suzie
Yesterday 05: 53
Spot gold closed Friday at $4,378.39, up 0.84% on the day and about 0.8% for the week — its first weekly gain in four weeks — with the intraday high of $4,399.67 leaving it 33 cents shy of the $4,400 line. Gold ETFs have now logged eight straight sessions of inflows, but with the 10-year back above 5% and the dollar index near 100, here is what decides whether this is a reversal or a bounce.
placeholder
Bitcoin squeezes back above $80,000 — 110,000 traders liquidated as the hawkish Fed and CLARITY setback fail to hold it down; is $83,000 next?Bitcoin closed above $80,000 on Friday for the first time since September 7, and pushed to $81,299 over the weekend, triggering about $603 million of liquidations — $523 million of them shorts — across more than 110,000 traders. With the Fed's hike already priced and the SEC and CFTC advancing crypto rules after the CLARITY Act failed, here is what stands between BTC and the $83,000 gate.
Author  Suzie
Yesterday 06: 19
Bitcoin closed above $80,000 on Friday for the first time since September 7, and pushed to $81,299 over the weekend, triggering about $603 million of liquidations — $523 million of them shorts — across more than 110,000 traders. With the Fed's hike already priced and the SEC and CFTC advancing crypto rules after the CLARITY Act failed, here is what stands between BTC and the $83,000 gate.
Related Instrument
goTop
quote