BNB price risks a 10% drop as Binance founder and ex-CEO Changpeng Zhao eyes Tuesday sentencing

Source Fxstreet
  • Binance founder and former CEO Changpeng Zhao will be sentenced in a US court in Seattle on Tuesday.
  • Reuters had hinted at a possible three-year jail term as prosecutors cited willful violation of the law.
  • BNB price has dumped nearly 3% already, reflecting a broader market bleed with potential for extended losses. 

Binance Coin (BNB) price, like most altcoins, is dumping, with the one-day chart showing a defined downtrend. While the broader market continues to bleed, things could get worse for BNB price ahead of Binance executive Changpeng Zhao (CZ) sentencing on Tuesday, April 30.

Also Read: Binance founder Changpeng Zhao could face three-year jail time

Binance exec to receive sentencing on Tuesday

Binance’s former CEO Changpeng Zhao will receive his sentence on Tuesday after capitulating to the US Department of Justice (DoJ) in November.  Binance exchange succumbed to the US DoJ, with CZ officially stepping down as CEO and inadvertently naming Richard Teng, former Global Head of Regional Markets, as the new CEO.

In the immediate aftermath of CZ stepping down, BNB price dropped by over 8% in an hour. The same could happen on Tuesday when the court issues a sentencing against the wealthiest man in crypto, according to Forbes list as of April 3.

Forbes estimates his fortune at $33 billion, followed by Brian Armstrong, the CEO of the largest US cryptocurrency exchange, Coinbase, with a net worth of $11.2 billion following the exchange’s stock price 200% surge in the past year.

As reported, the prosecution requested the court to issue a three-year jail term (36 months). Nevertheless, Federal sentencing guidelines set a maximum sentence of 18 months for the Binance founder. Zhao has previously agreed not to appeal against any sentence that stretches up to 18 months of jail time. 

The Department of Justice claimed that:

  • Binance and CZ churned $1.6 billion worth of profits via illegal transactions
  • Allowed users to trade despite lacking KYC compliance
  • Failing to report more than 100,000 suspicious transactions involving specific terrorist groups
  • Supported the sale of child sexual abuse materials and was a recipient of a large portion of ransomware proceeds.

Secretary of the Treasury Janet L. Yellen echoed the DOJ’s remarks, saying, “Binance turned a blind eye to its legal obligations in the pursuit of profit. Its willful failures allowed money to flow to terrorists, cybercriminals, and child abusers through its platform.” 

The then-acting US  Attorney Tessa M. Gorman (now confirmed) for the Western District of Washington accused Binance of enabling multiple terrorist and extremist organizations across the world. She stated:

Because Changpeng Zhao knowingly operated a financial platform without basic anti-money laundering safeguards, the company caused illegal transactions between U.S. users and users in sanctioned jurisdictions such as Iran, Cuba, Syria, and Russian-occupied regions of Ukraine – transactions for which Binance profited with significant fees.

Binance Coin outlook ahead of April 30 sentencing

BNB price is trading within a range, measured from $497.30 to $637.00, determined from where selling pressure climaxed and buying pressure peaked, respectively. Sentiment remains bullish in the Binance Coin market, but this is on the balance.

Bullish sentiment is seen with the Relative Strength Index (RSI) holding well above the mean level of 50, accentuated by the Awesome Oscillator (AO), which is still in positive territory. However, the bullish outlook is under threat, as shown by the lower highs on the RSI. If this momentum indicator records another lower high below 50, it could kickstart a selloff and confirm the continuation of the downtrend.

Notice the grey spikes on the volume profile, showing the massive bearish pressure waiting to descend on BNB price once it drops below today’s intra-day low of $581.30. The ensuing seller momentum could see Binance Coin price extend the fall below the 50% Fibonacci placeholder at $567.10.

Increased selling pressure below the aforementioned level could send BNB price to $537.10, but a failure of this buyer congestion level to hold could see Binance Coin spiral to the bottom of the market range at $497.30, constituting a 15% fall below current levels.

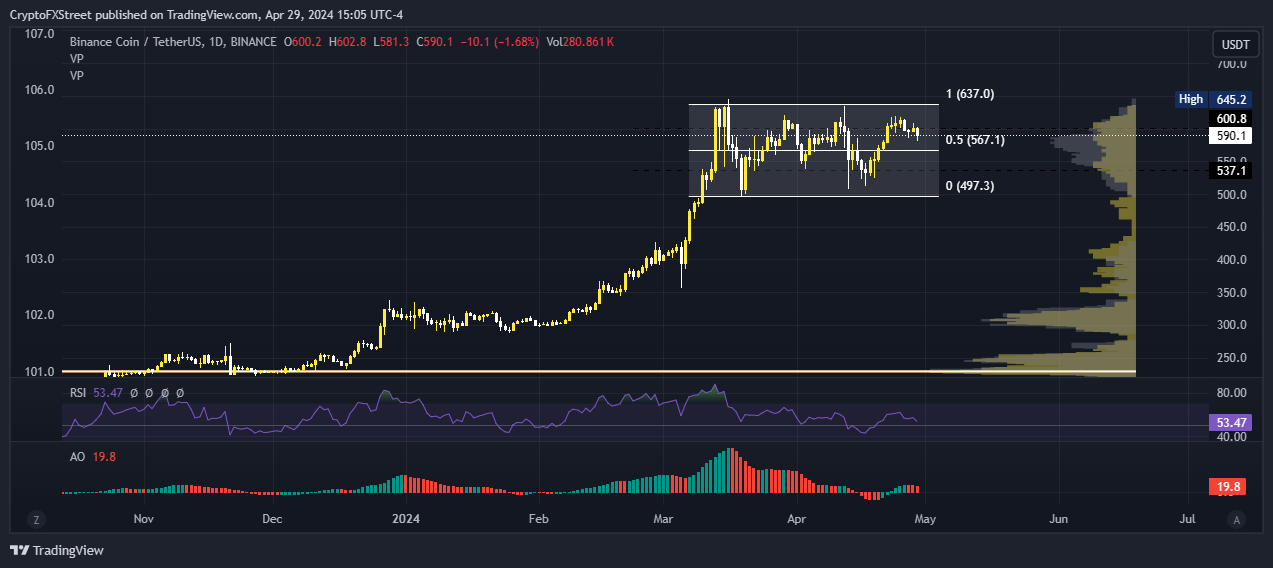
BNB/USDT 1-day chart

On the other hand, if BNB bulls come into play, Binance Coin price could push north. A candlestick close above $637.00 would produce a higher high, effectively invalidating the bearish thesis. 

Disclaimer: For information purposes only. Past performance is not indicative of future results.
placeholder
Gold Price Forecast: XAU/USD drifts higher above $4,200 as Fed delivers expected cutGold price (XAU/USD) gains momentum to around $4,235 during the early Asian session on Thursday. The precious metal extends its upside after the US Federal Reserve (Fed) delivered an expected third consecutive interest rate cut and maintained its outlook for just one cut in 2026.
Author  FXStreet
Dec 11, Thu
Gold price (XAU/USD) gains momentum to around $4,235 during the early Asian session on Thursday. The precious metal extends its upside after the US Federal Reserve (Fed) delivered an expected third consecutive interest rate cut and maintained its outlook for just one cut in 2026.
placeholder
Gold remains bid as lack of Fed clarity and geopolitical frictions persistGold (XAU/USD) advances modestly on Friday as traders seem to book profits ahead of the weekend, yet clings to gains of over 0.51% after reaching a seven-week high of $4,353. At the time of writing, XAU/USD trades at $4,302 as traders digest comments from Federal Reserve (Fed) officials.
Author  FXStreet
Yesterday 01: 34
Gold (XAU/USD) advances modestly on Friday as traders seem to book profits ahead of the weekend, yet clings to gains of over 0.51% after reaching a seven-week high of $4,353. At the time of writing, XAU/USD trades at $4,302 as traders digest comments from Federal Reserve (Fed) officials.
placeholder
Ethereum Price Slips Lower — $3,000 Looms as the Key BattlegroundEthereum is attempting to recover from a $3,026 low but remains below $3,200 and the 100-hour SMA, with a bearish trend line near $3,175 capping rebounds as bulls need a clean break above $3,200 to target $3,250–$3,400, while a drop below $3,050 risks a retest of $3,000 and $2,940.
Author  Mitrade
Yesterday 03: 25
Ethereum is attempting to recover from a $3,026 low but remains below $3,200 and the 100-hour SMA, with a bearish trend line near $3,175 capping rebounds as bulls need a clean break above $3,200 to target $3,250–$3,400, while a drop below $3,050 risks a retest of $3,000 and $2,940.
placeholder
Macro Analysts: Hawkish Japan Could Push Bitcoin Below $70KAnalysts predict Bitcoin may face further declines towards the $70,000 mark if the Bank of Japan raises interest rates as expected.
Author  Mitrade
Yesterday 05: 48
Analysts predict Bitcoin may face further declines towards the $70,000 mark if the Bank of Japan raises interest rates as expected.
placeholder
Bitcoin Slides 5% as Sellers Lean In — Can BTC Reclaim $88,000?Bitcoin has dropped back below $88,000 after rolling over from $90,500, with price still trading under the 100-hour Simple Moving Average. The sell-off found a floor at $85,151, and BTC is now consolidating near that base, but rebounds are facing pressure from a bearish trend line around $89,000. Bulls need to retake $88,000–$89,000 to ease downside risk; failure to do so keeps $85,500–$85,000 and then $83,500 in play, with $80,000 as the deeper “line in the sand.” Bitcoin (BTC) is back in damage-control mode after a sharp pullback wiped out recent gains. The price failed to reclaim the $90,000–$90,500 band, rolled over, and slid through $88,500 before briefly dipping under $87,000. Buyers did show up around $85,000, but the rebound so far looks more like stabilization than a clear trend reversal. Bitcoin dips hard, finds a bid near $85,000(h3) BTC’s latest move lower began when it couldn’t build follow-through above $90,000 and $90,500. Once that upside stalled, sellers took control and pushed price down through $88,500. The slide accelerated enough to spike below $87,000, but the market didn’t free-fall. Bulls defended the $85,000 zone, printing a low at $85,151. Since then, Bitcoin has been consolidating below the 23.6% Fibonacci retracement of the drop from the $93,560 swing high to the $85,151 low — a clue that the bounce is still shallow and that sellers haven’t fully backed off yet. Structurally, BTC is still on the back foot: It’s trading below $88,000, and It remains below the 100-hour Simple Moving Average, keeping short-term trend pressure pointed downward. Resistance is layered, and $89,000 is the problem area(h3) If bulls try to turn this into a recovery, they’ll have to climb through multiple ceilings in quick succession. First, BTC faces resistance around $87,150, followed by a more meaningful barrier near $87,500. From there, the market’s attention snaps back to $88,000 — the level BTC just lost and now needs to reclaim. A close back above $88,000 would improve the tone, but it doesn’t solve the bigger issue: there’s a bearish trend line on the hourly BTC/USD chart (Kraken feed) with resistance near $89,000, which also lines up with the next technical hurdle. If BTC can push through $89,000 and hold, the rebound could extend toward $90,000, with follow-through targets at $91,000 and $91,500. But until price clears that $88,000–$89,000 zone, rallies are at risk of being sold rather than chased. If BTC fails to reclaim resistance, the downside path is clear(h3) The near-term bear case is simple: if Bitcoin can’t climb back above the $87,000 area and keep traction, sellers may attempt another leg lower. Support levels line up like this: Immediate support: $85,500 First major support: $85,000 Next support: $83,500 Then $82,500 in the near term Below that, the major “don’t break this” level is still $80,000. If BTC slips under $80,000, the risk of acceleration to the downside increases significantly — not because it’s magic, but because it’s the kind of psychological and structural level that tends to trigger forced de-risking. Indicators: momentum still leans bearish(h3) The intraday indicators aren’t offering much comfort yet: Hourly MACD is losing pace in the bearish zone. Hourly RSI remains below 50, suggesting sellers still have the upper hand on short timeframes. So while the $85,000 defense held for now, the market hasn’t flipped bullish — it’s just stopped bleeding.
Author  Mitrade
10 hours ago
Bitcoin has dropped back below $88,000 after rolling over from $90,500, with price still trading under the 100-hour Simple Moving Average. The sell-off found a floor at $85,151, and BTC is now consolidating near that base, but rebounds are facing pressure from a bearish trend line around $89,000. Bulls need to retake $88,000–$89,000 to ease downside risk; failure to do so keeps $85,500–$85,000 and then $83,500 in play, with $80,000 as the deeper “line in the sand.” Bitcoin (BTC) is back in damage-control mode after a sharp pullback wiped out recent gains. The price failed to reclaim the $90,000–$90,500 band, rolled over, and slid through $88,500 before briefly dipping under $87,000. Buyers did show up around $85,000, but the rebound so far looks more like stabilization than a clear trend reversal. Bitcoin dips hard, finds a bid near $85,000(h3) BTC’s latest move lower began when it couldn’t build follow-through above $90,000 and $90,500. Once that upside stalled, sellers took control and pushed price down through $88,500. The slide accelerated enough to spike below $87,000, but the market didn’t free-fall. Bulls defended the $85,000 zone, printing a low at $85,151. Since then, Bitcoin has been consolidating below the 23.6% Fibonacci retracement of the drop from the $93,560 swing high to the $85,151 low — a clue that the bounce is still shallow and that sellers haven’t fully backed off yet. Structurally, BTC is still on the back foot: It’s trading below $88,000, and It remains below the 100-hour Simple Moving Average, keeping short-term trend pressure pointed downward. Resistance is layered, and $89,000 is the problem area(h3) If bulls try to turn this into a recovery, they’ll have to climb through multiple ceilings in quick succession. First, BTC faces resistance around $87,150, followed by a more meaningful barrier near $87,500. From there, the market’s attention snaps back to $88,000 — the level BTC just lost and now needs to reclaim. A close back above $88,000 would improve the tone, but it doesn’t solve the bigger issue: there’s a bearish trend line on the hourly BTC/USD chart (Kraken feed) with resistance near $89,000, which also lines up with the next technical hurdle. If BTC can push through $89,000 and hold, the rebound could extend toward $90,000, with follow-through targets at $91,000 and $91,500. But until price clears that $88,000–$89,000 zone, rallies are at risk of being sold rather than chased. If BTC fails to reclaim resistance, the downside path is clear(h3) The near-term bear case is simple: if Bitcoin can’t climb back above the $87,000 area and keep traction, sellers may attempt another leg lower. Support levels line up like this: Immediate support: $85,500 First major support: $85,000 Next support: $83,500 Then $82,500 in the near term Below that, the major “don’t break this” level is still $80,000. If BTC slips under $80,000, the risk of acceleration to the downside increases significantly — not because it’s magic, but because it’s the kind of psychological and structural level that tends to trigger forced de-risking. Indicators: momentum still leans bearish(h3) The intraday indicators aren’t offering much comfort yet: Hourly MACD is losing pace in the bearish zone. Hourly RSI remains below 50, suggesting sellers still have the upper hand on short timeframes. So while the $85,000 defense held for now, the market hasn’t flipped bullish — it’s just stopped bleeding.
goTop
quote