

Polygon Price Forecast: POL rebounds on ERC-8004 standard adoption, largest token burn
- Polygon holds above $0.1100 on Tuesday after an 11% rebound from a critical support the previous day.
- On-chain data show a positive outlook with the largest monthly token burn, net inflows, and increased stablecoin supply.
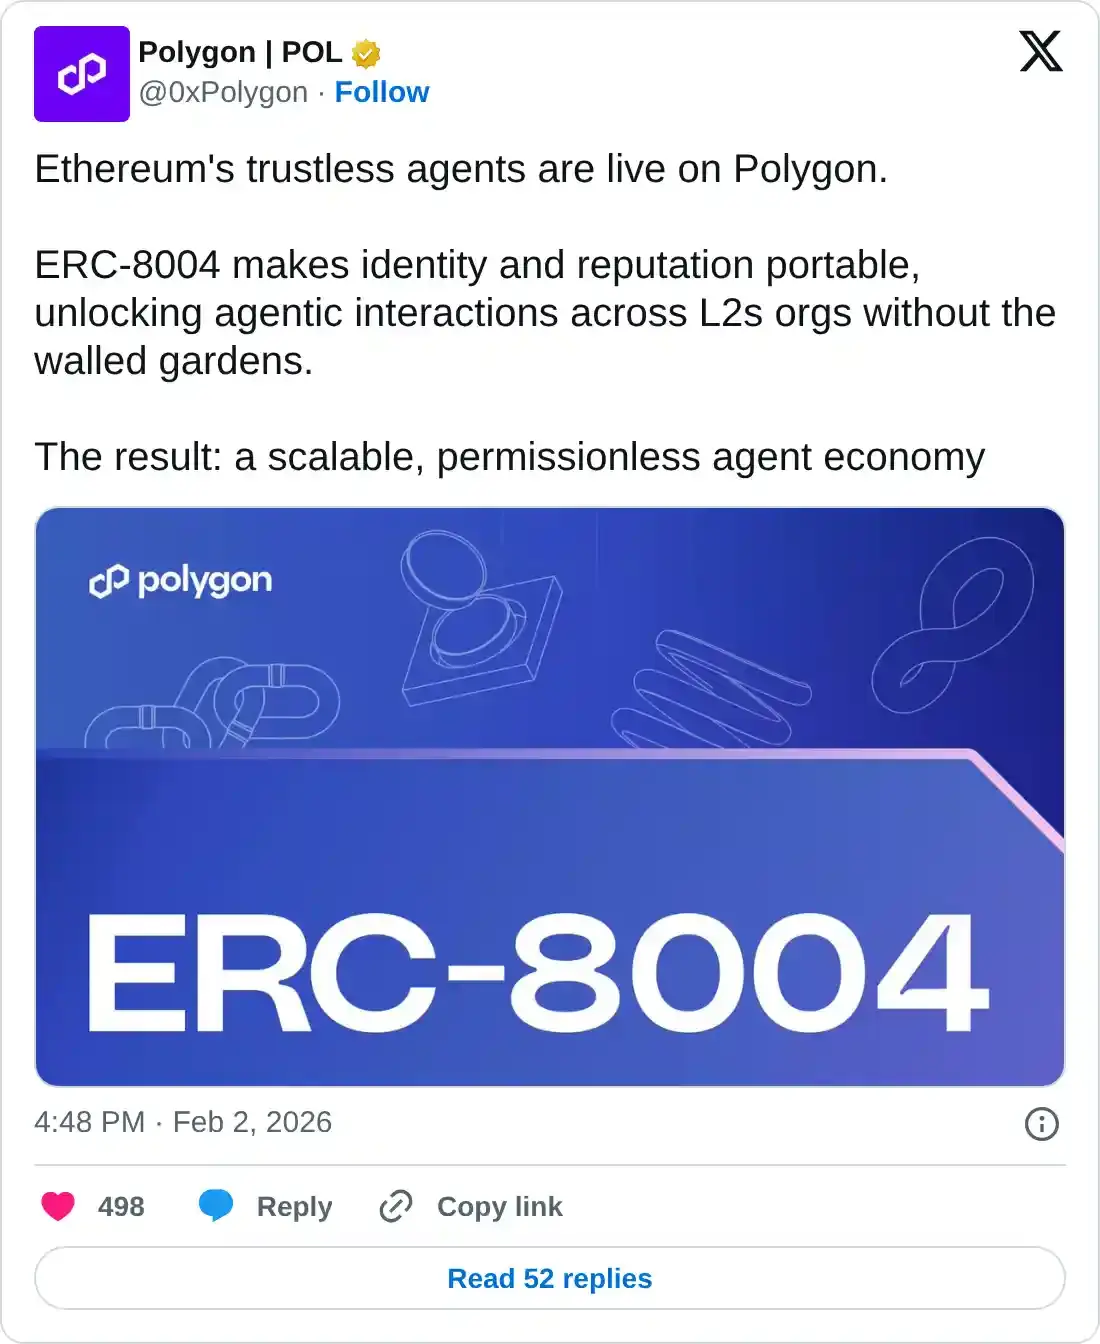
- Ethereum’s ERC-8004 is live on Polygon, expanding into the budding permissionless agent economy.
Polygon (POL) takes a breather above $0.1100 at press time on Tuesday, following an 11% recovery from a critical psychological support at $0.1000 the previous day. The purple chain is warming up as it recorded its largest monthly burn of more than 25 million POL tokens in January, while bridged net inflows and stablecoin supply rise amid the launch of Ethereum’s trustless agents through ERC-8004 on Polygon. Technically, POL remains under pressure due to a prevailing downtrend evidenced by declining moving averages on the daily chart.
Polygon adopts ERC-8004 amid recovery network health
On-chain data show Polygon is heating up, with an expansion into the agent economy driving increased liquidity and inflows. Polygon announced the adoption of Ethereum’s trustless agent standard (ERC-8004), which allows agents on layer-2 networks to have portable identity and reputation. With the growing ecosystem of AI agents, Polygon’s bet on the agent economy could lead to renewed network effects, developer adoption, real-world use cases, and actual agent-to-agent economic value creation.
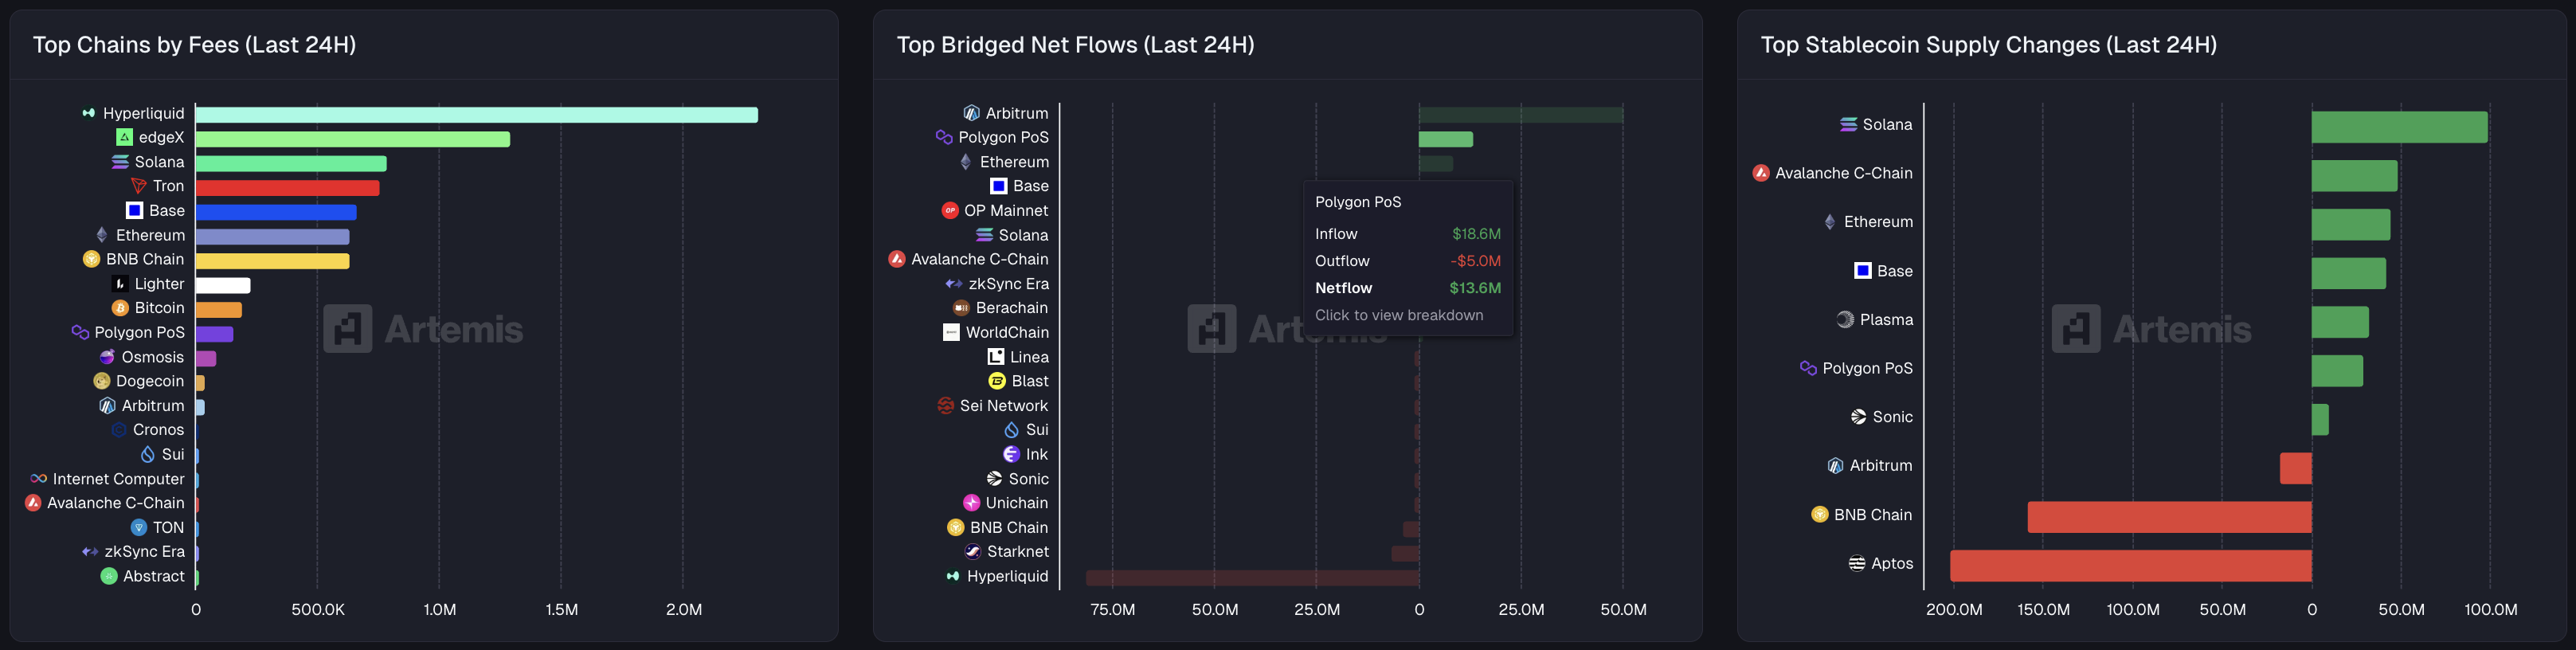
Artemis data shows Polygon recorded bridged net flows of $13.6 million over the last 24 hours, second only to Arbitrum, which recorded $50.4 million in net flows. Consistent with these inflows, Polygon's stablecoin supply has increased by $29 million over the same period.
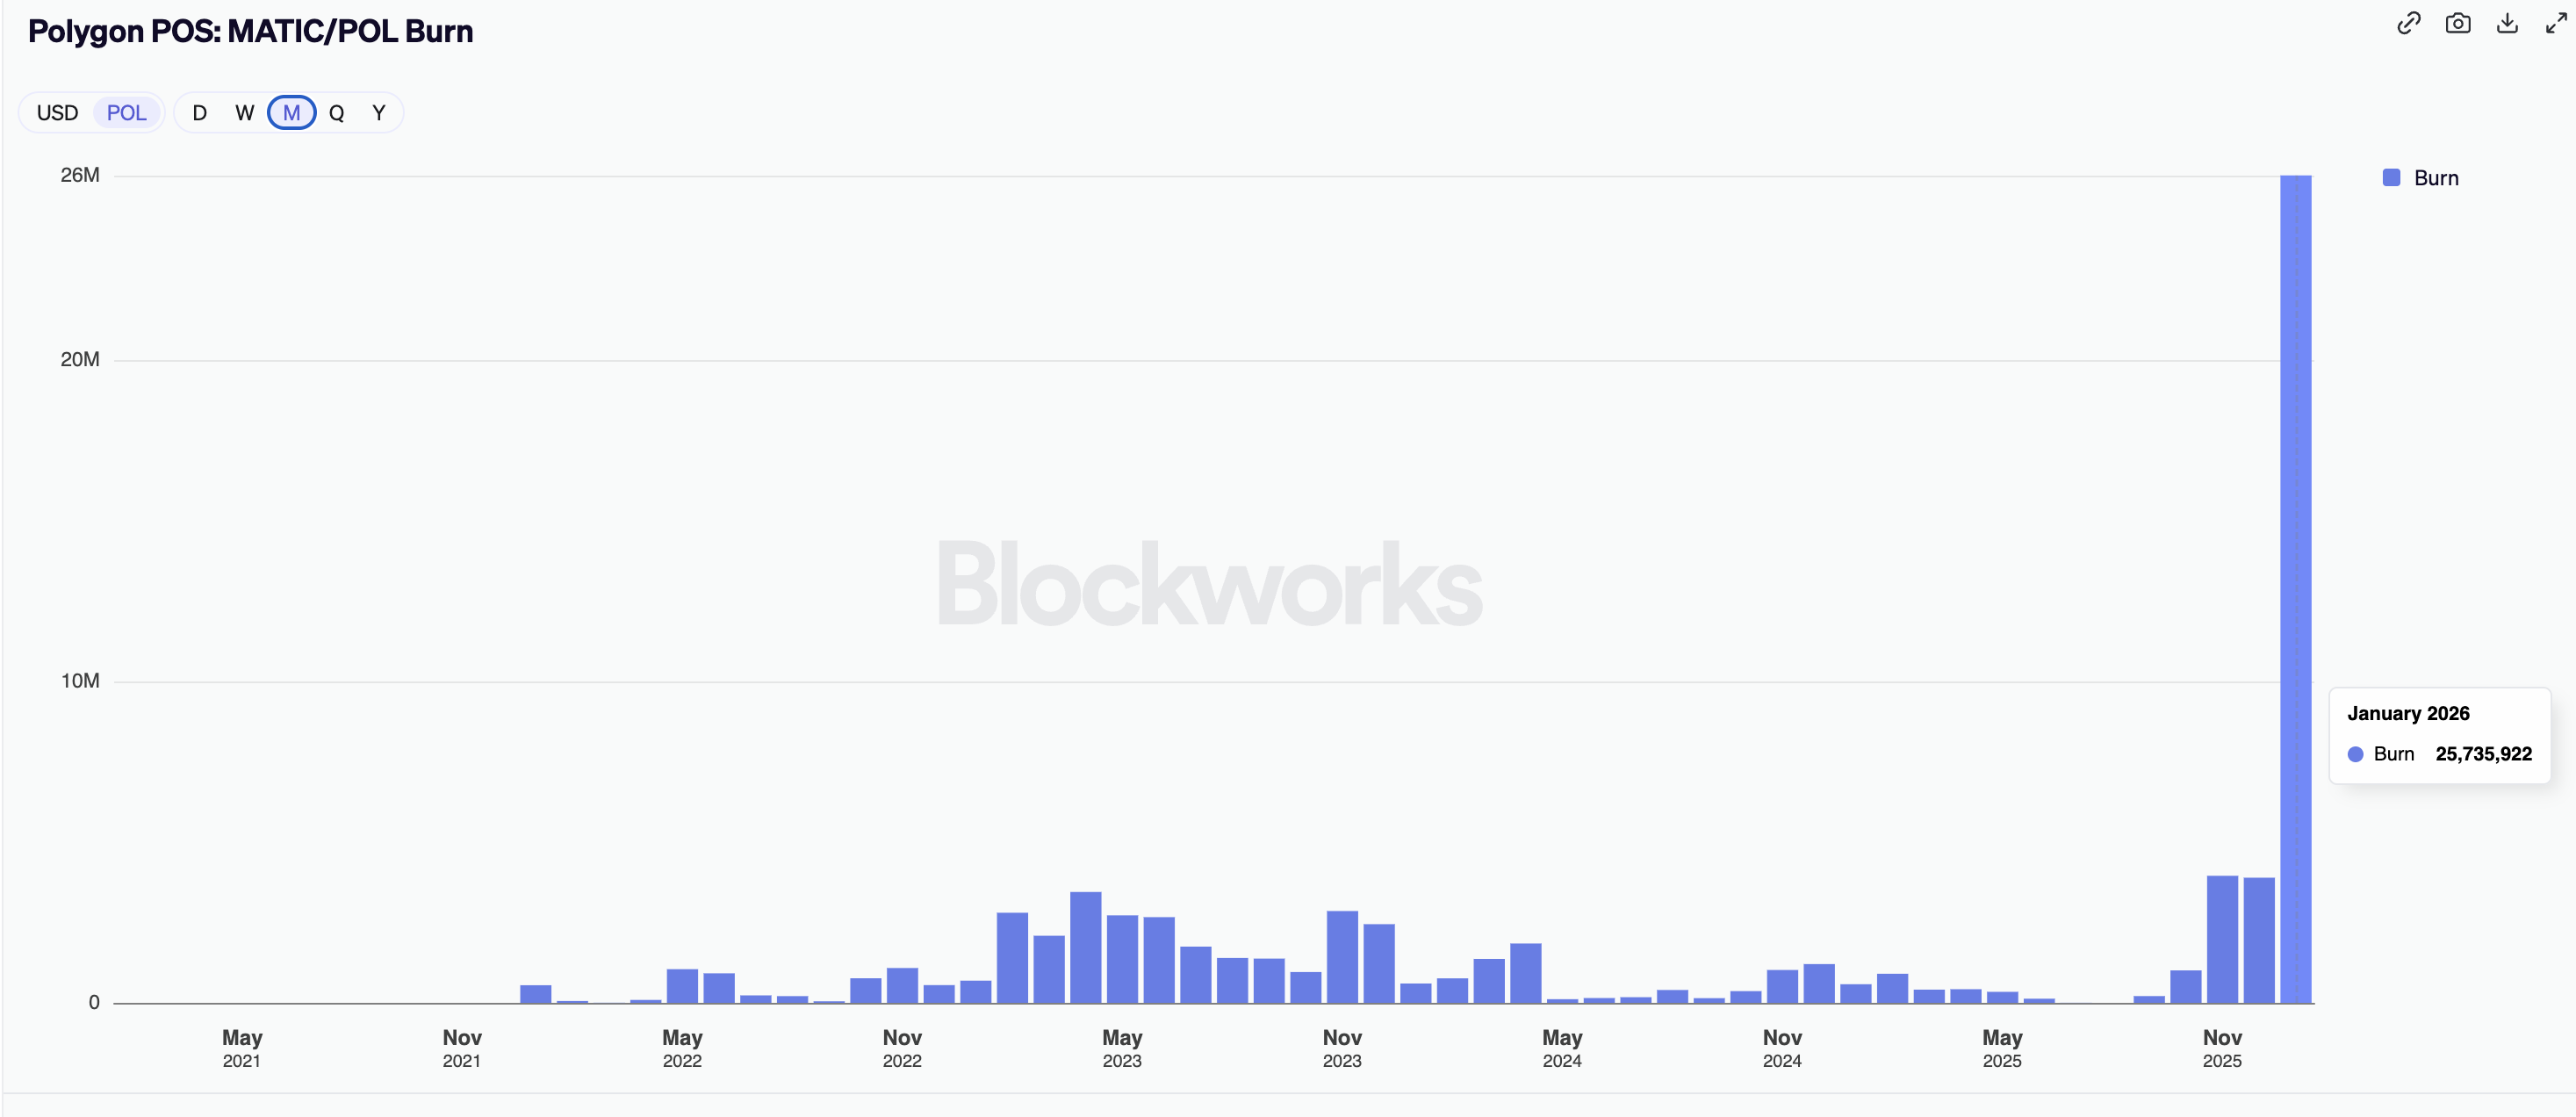
Meanwhile, Blockworks data shows 25.73 million tokens were removed from circulation in January. Typically, a reduction in circulation leads to increased demand.
Technical outlook: Will POL extend the bounce back?
Polygon bounced back from the $0.1000 level and rose by 11% on Monday after a steady decline of 21% over the past three weeks, marking a bullish start to the week. However, the downward slope of the 50-, 100-, and 200-day Exponential Moving Averages (EMAs) reinforces a strong bearish trend.
For a sustained recovery, POL should surpass the 50-day EMA at $0.1273, which would open doors to the 100-day and 200-day EMAs at $0.1422 and $0.1743, respectively.
The momentum indicators on the daily chart suggest cooling in selling pressure. The Moving Average Convergence Divergence (MACD) line approaches the signal line while both remain below zero, suggesting the possibility of a bullish crossover. Meanwhile, the Relative Strength Index (RSI) at 40 bounces off the oversold boundary, indicating reduced selling pressure.
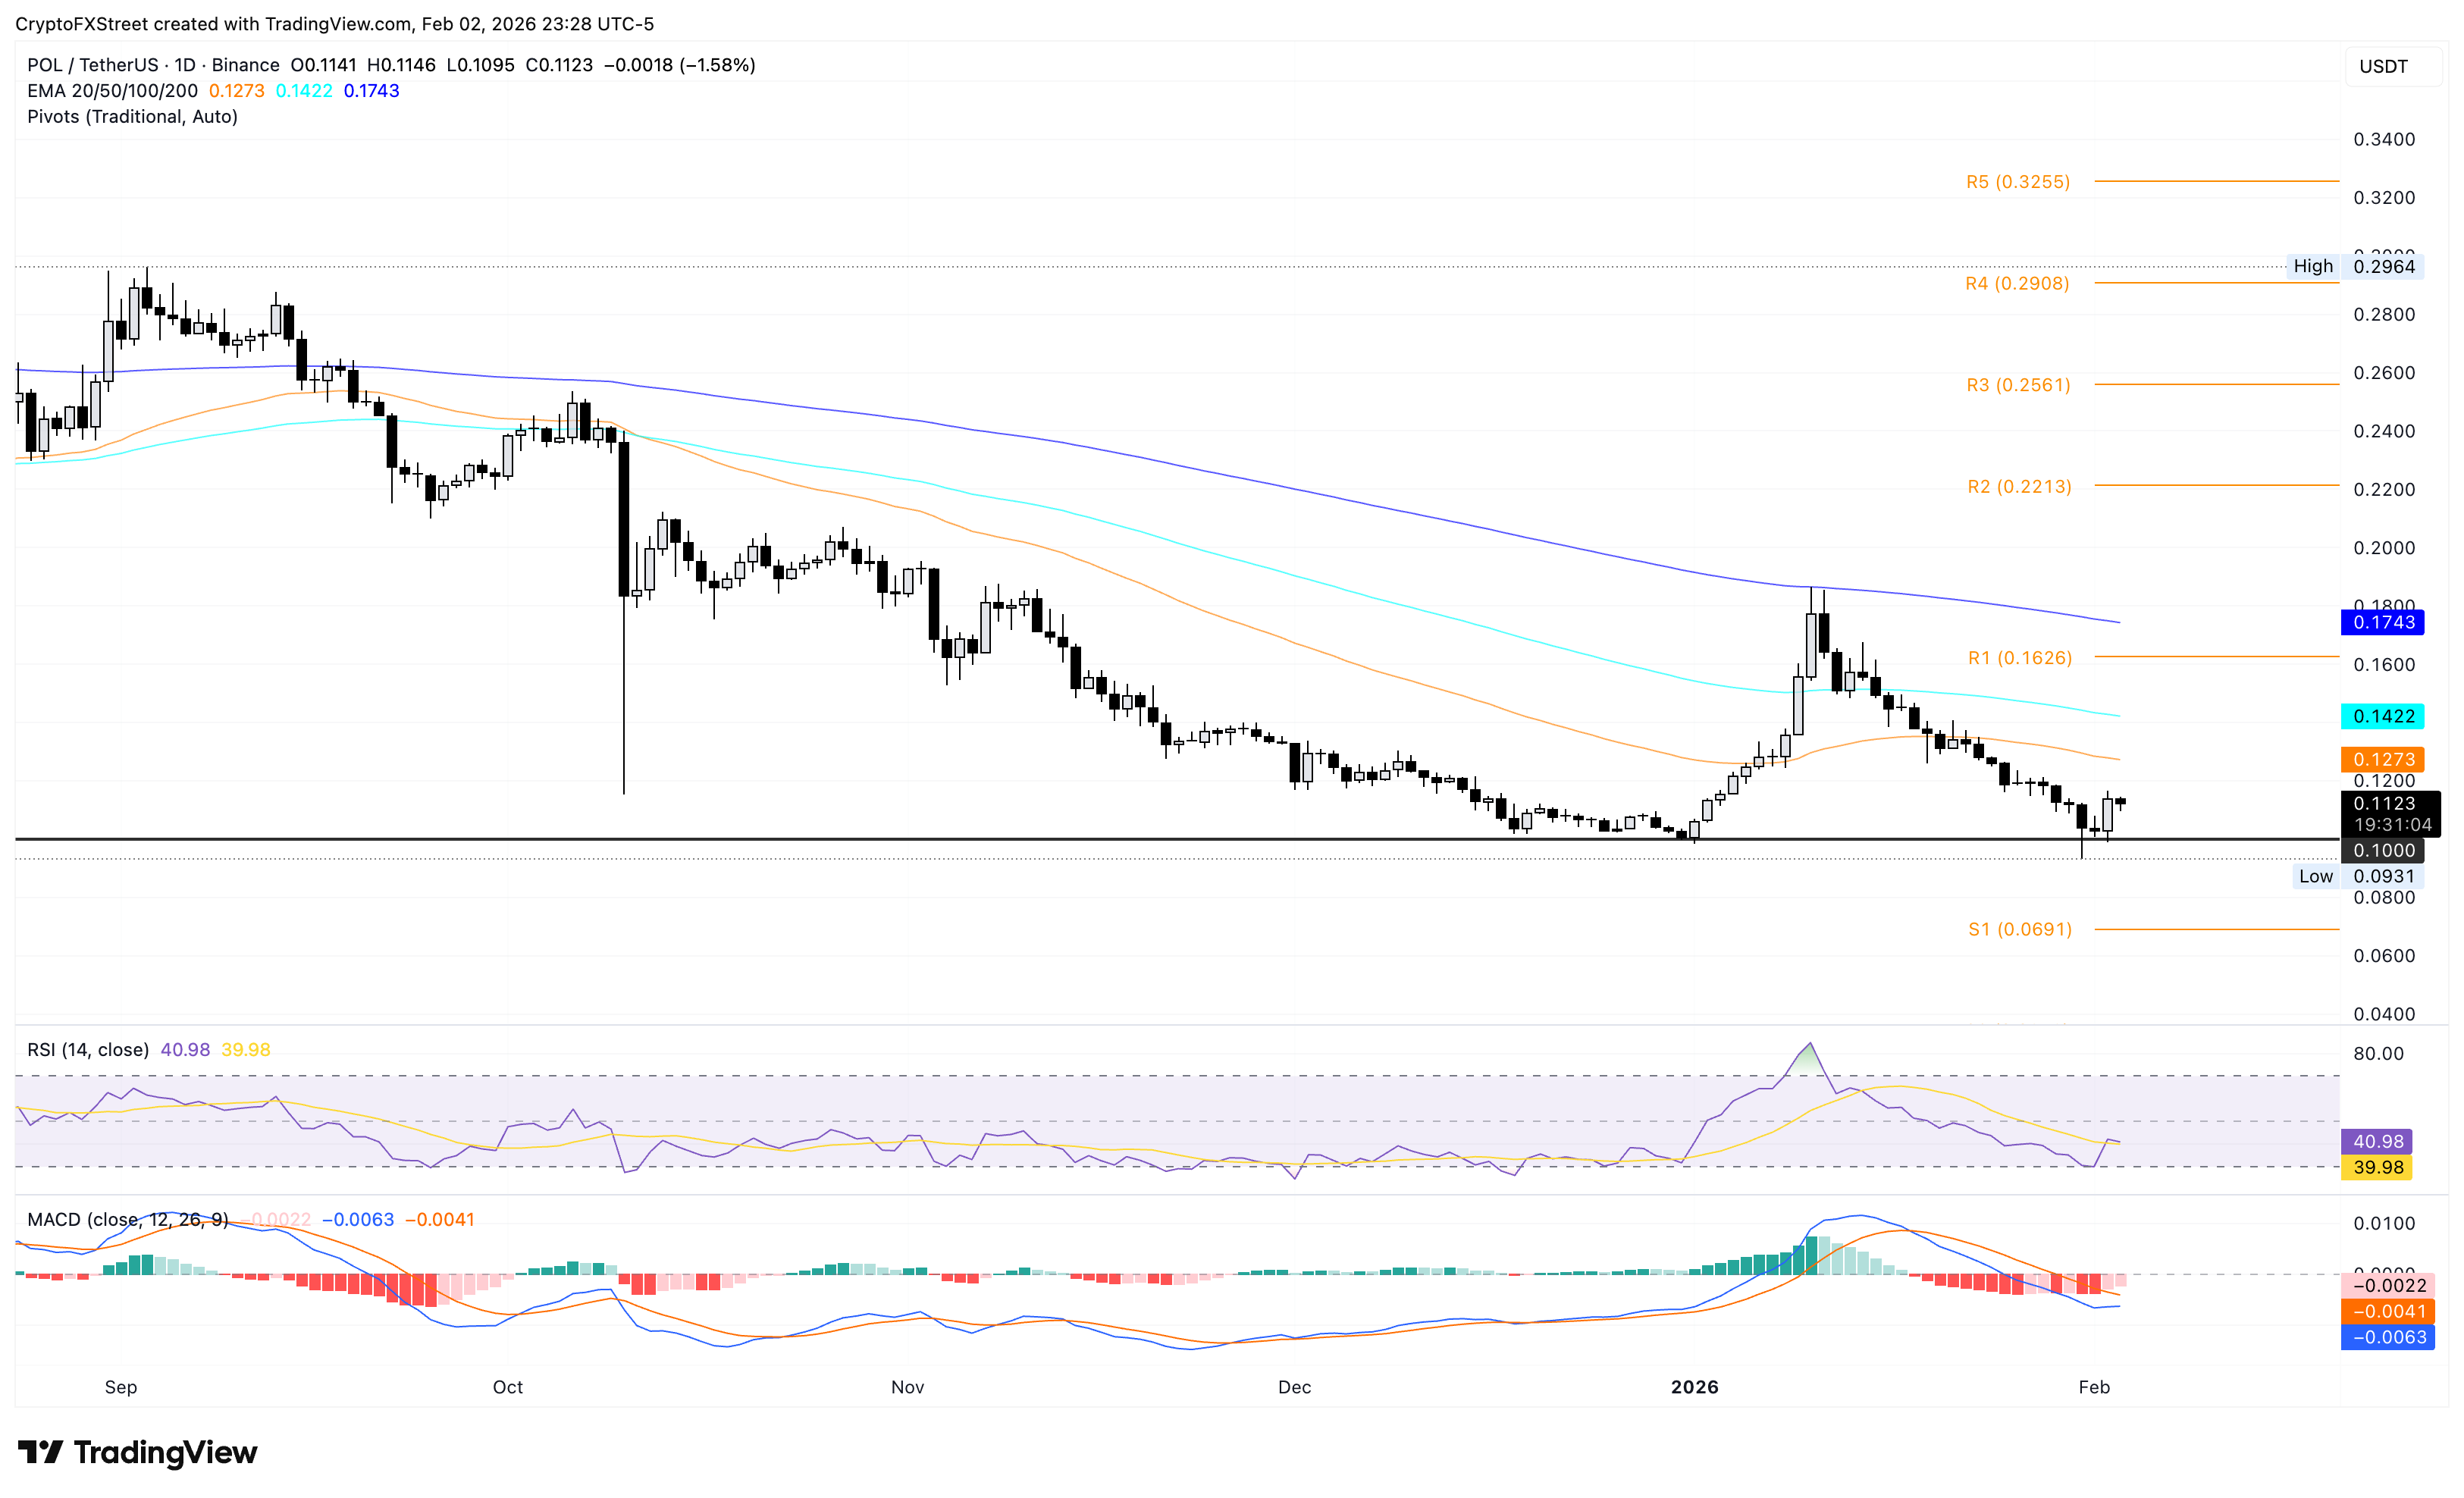
Looking down, a reversal below $0.1100 could threaten the $0.1000 psychological support with a deeper zone at $0.0691, coinciding with the S1 Pivot Point.
Recommended Articles


