


Onyxcoin Holders Sold in Panic, But Technical Charts Show Breakout Potential
Onyxcoin price has declined in recent sessions, prompting concern among short-term holders. The drop appeared bearish on the surface, yet underlying signals tell a different story.
Instead of confirming weakness, the pullback created a potential accumulation window. Many investors failed to recognize this shift and sold into declining prices.
Onyxcoin Holders Make An Early Exit
Investor behavior turned sharply bearish over the past week. Exchange balances for Onyxcoin increased by roughly 350 million XCN during this period. At current prices, the inflow is valued at nearly $2 million. Such movements typically reflect growing sell intent rather than long-term positioning.
The selling followed a 12% decline in XCN price over several days. That drop triggered panic among holders, especially short-term participants. Rather than waiting for confirmation, many chose to exit positions early. This reaction added supply to the market and intensified short-term volatility.
Want more token insights like this? Sign up for Editor Harsh Notariya’s Daily Crypto Newsletter here.
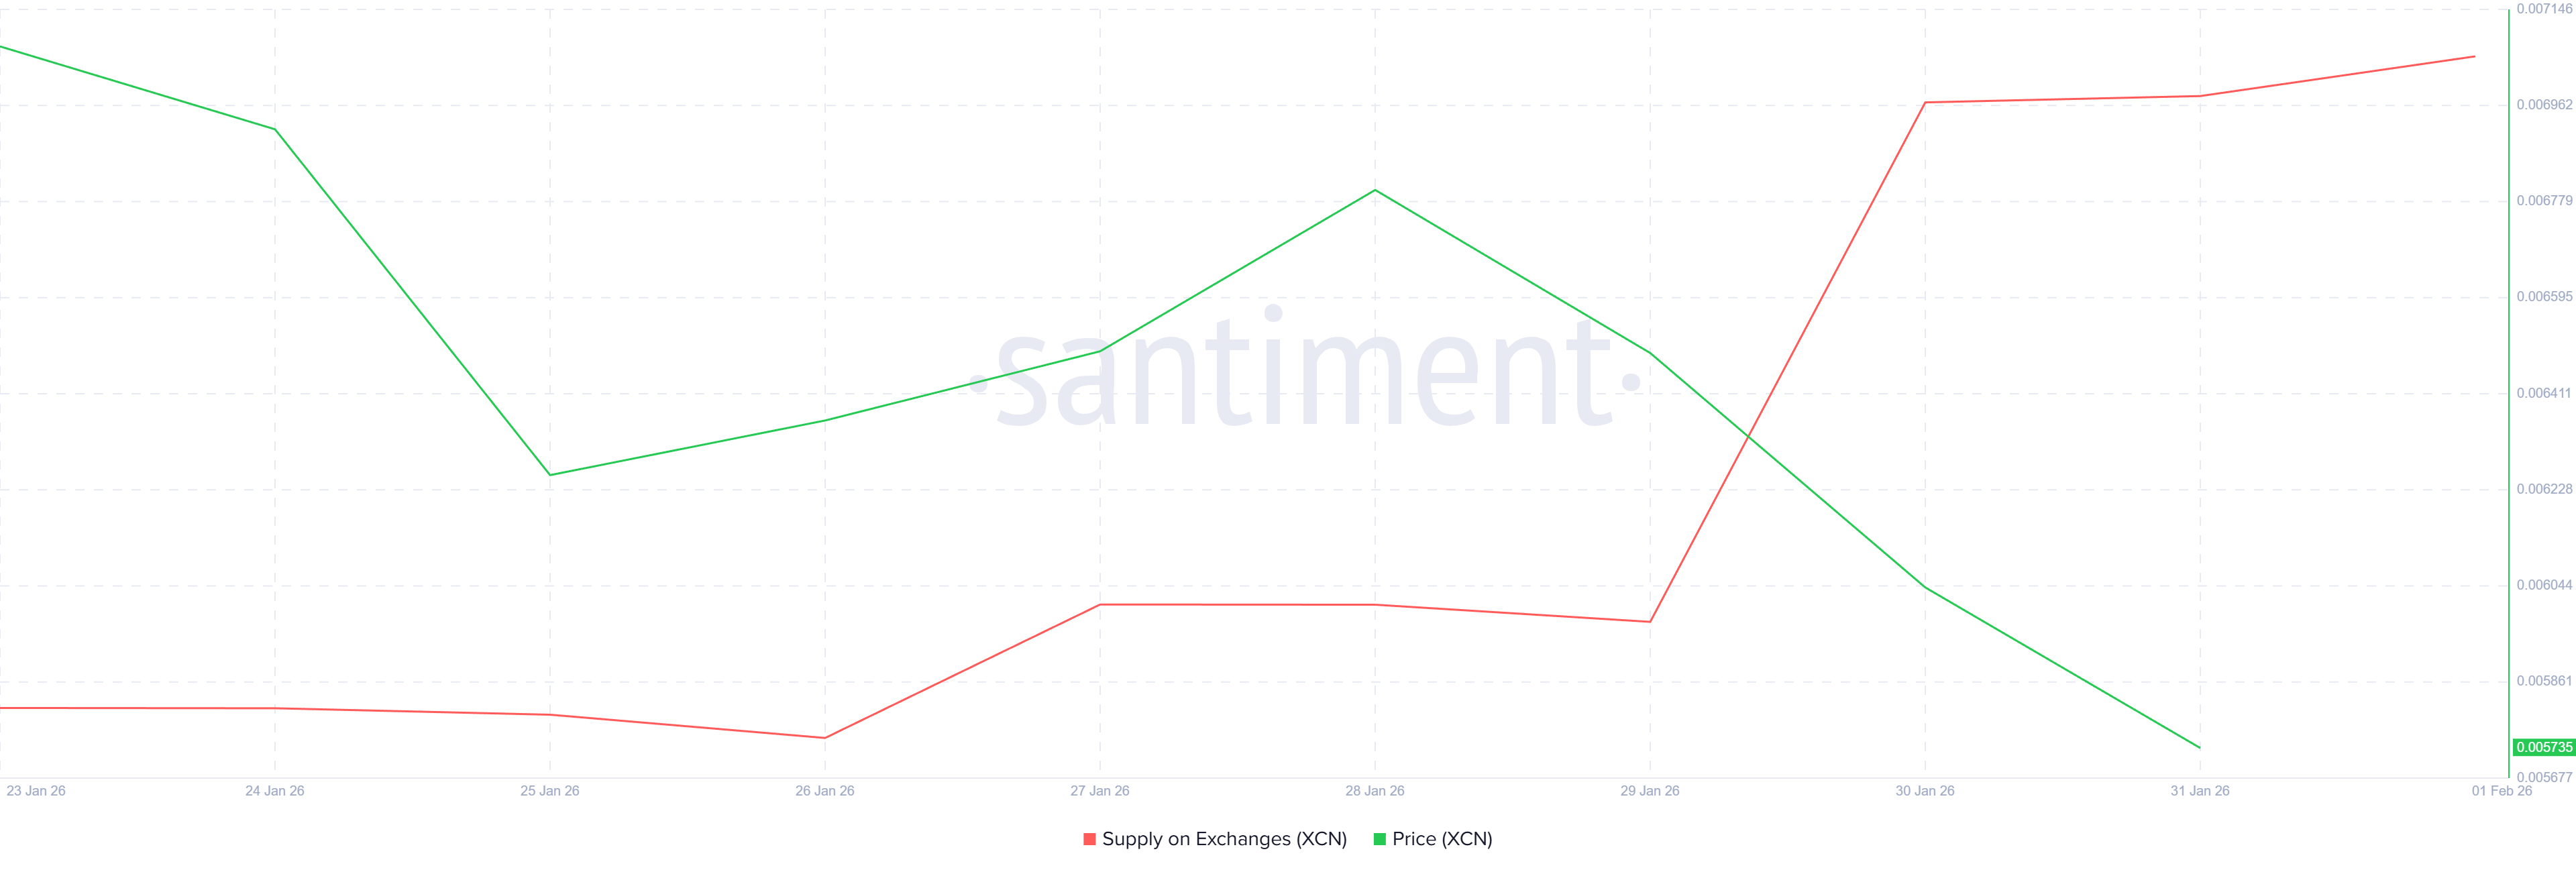 XCN Exchange Balance. Source: Santiment
Despite visible selling, macro indicators suggest improving conditions beneath the surface. The MVRV Long/Short Difference has been trending higher. This metric tracks how profits and losses shift between long-term and short-term holders. Rising values indicate reduced profitability for short-term traders.
When short-term holders lose profits, selling pressure often fades. These traders are more likely to exit quickly when gains shrink. As their incentive to sell declines, price stabilization becomes more likely.
This dynamic gives Onyxcoin a clearer path toward recovery once excess supply is absorbed.
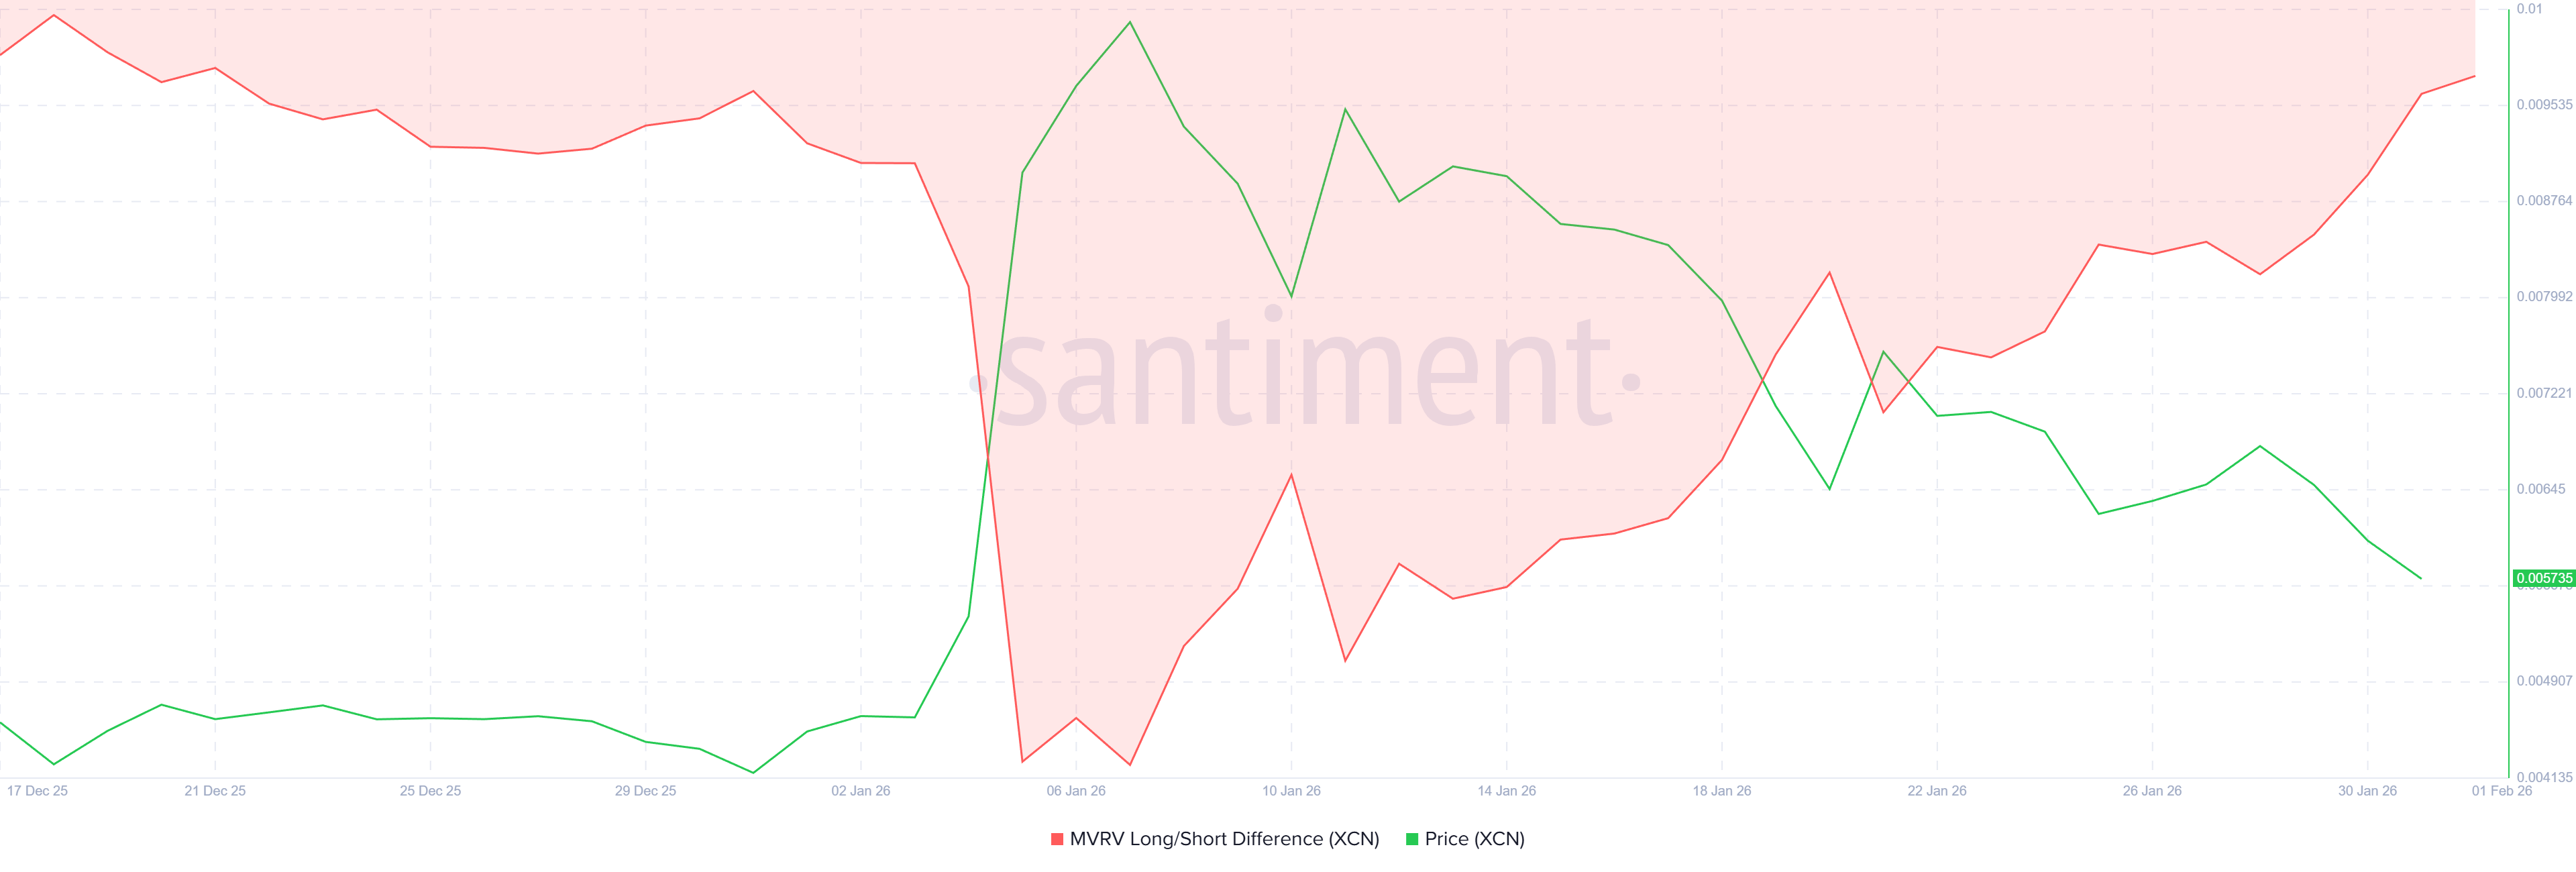 XCN MVRV Long/Short Difference. Source: Santiment
XCN Price Has a Bullish Target
Onyxcoin is trading near $0.0057 at the time of writing. The token remains above the $0.0054 support level, which has held during recent volatility. Over the past month, XCN has formed a flag pattern. This structure often signals continuation following consolidation.
The measured move from the flag projects a potential 150% rally. That target places XCN near $0.0156 if the breakout fully develops. Such outcomes typically require broader market support and sustained demand. While ambitious, the setup reflects strong upside potential if conditions align.
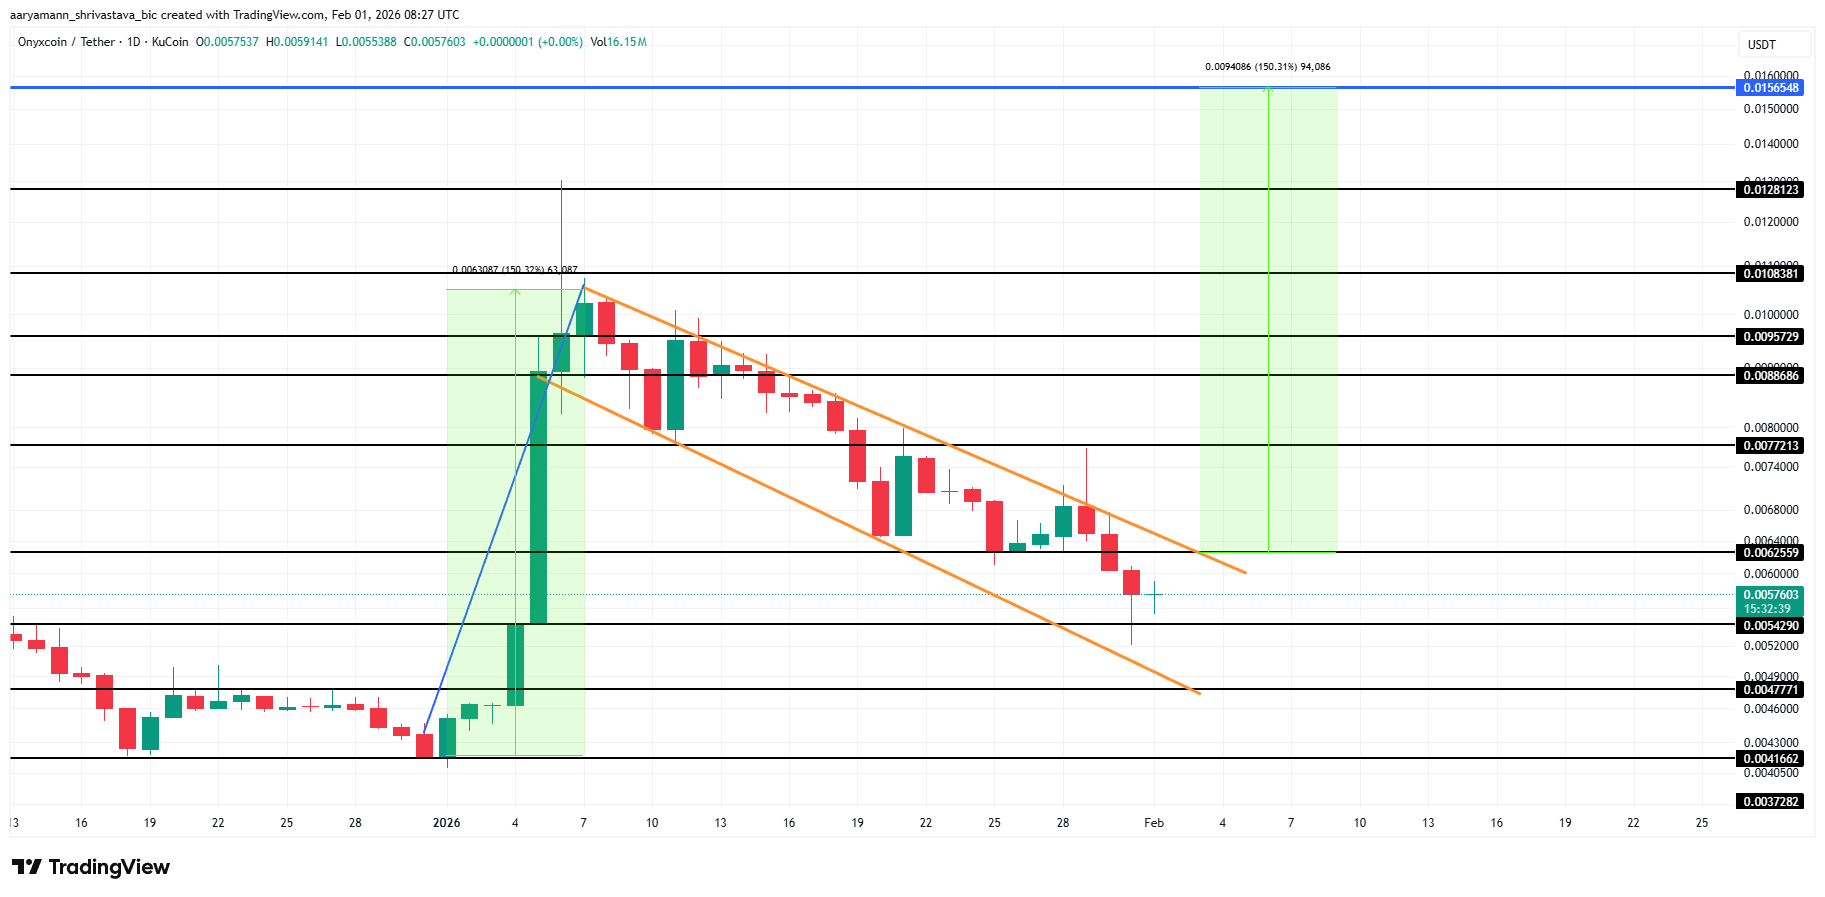 XCN Price Analysis. Source: TradingView
A more conservative outlook focuses on nearer resistance levels. Reclaiming $0.0077 would confirm bullish intent and validate the breakout structure. From there, XCN could advance toward $0.0095. Crossing that level would bring the $0.0100 psychological mark into focus, often a trigger for momentum-driven buying.
Downside risk remains if sentiment deteriorates again. Failure to hold current levels could push XCN toward $0.0047. A breakdown below that support would expose $0.0041 as the next downside target. Such a move would invalidate the bullish thesis and delay any recovery attempt.
Recommended Articles


