


Hedera Price Faces 20% Risk as Bearish Metrics Stack Up — Can HBAR Bounce Back?
Hedera is down more than 10% over the past seven days, and the drop is not just a routine pullback. The HBAR price structure is weakening, capital is flowing out, and sentiment has slipped to multi-month lows.
Together, these signals point to a rising risk of a deeper correction. At the same time, dip buyers and derivatives positioning offer a narrow path for a rebound. Whether HBAR breaks down or stabilizes now depends on a few key levels.
Head-and-Shoulders Pattern and CMF Breakdown Signal Structural Risk
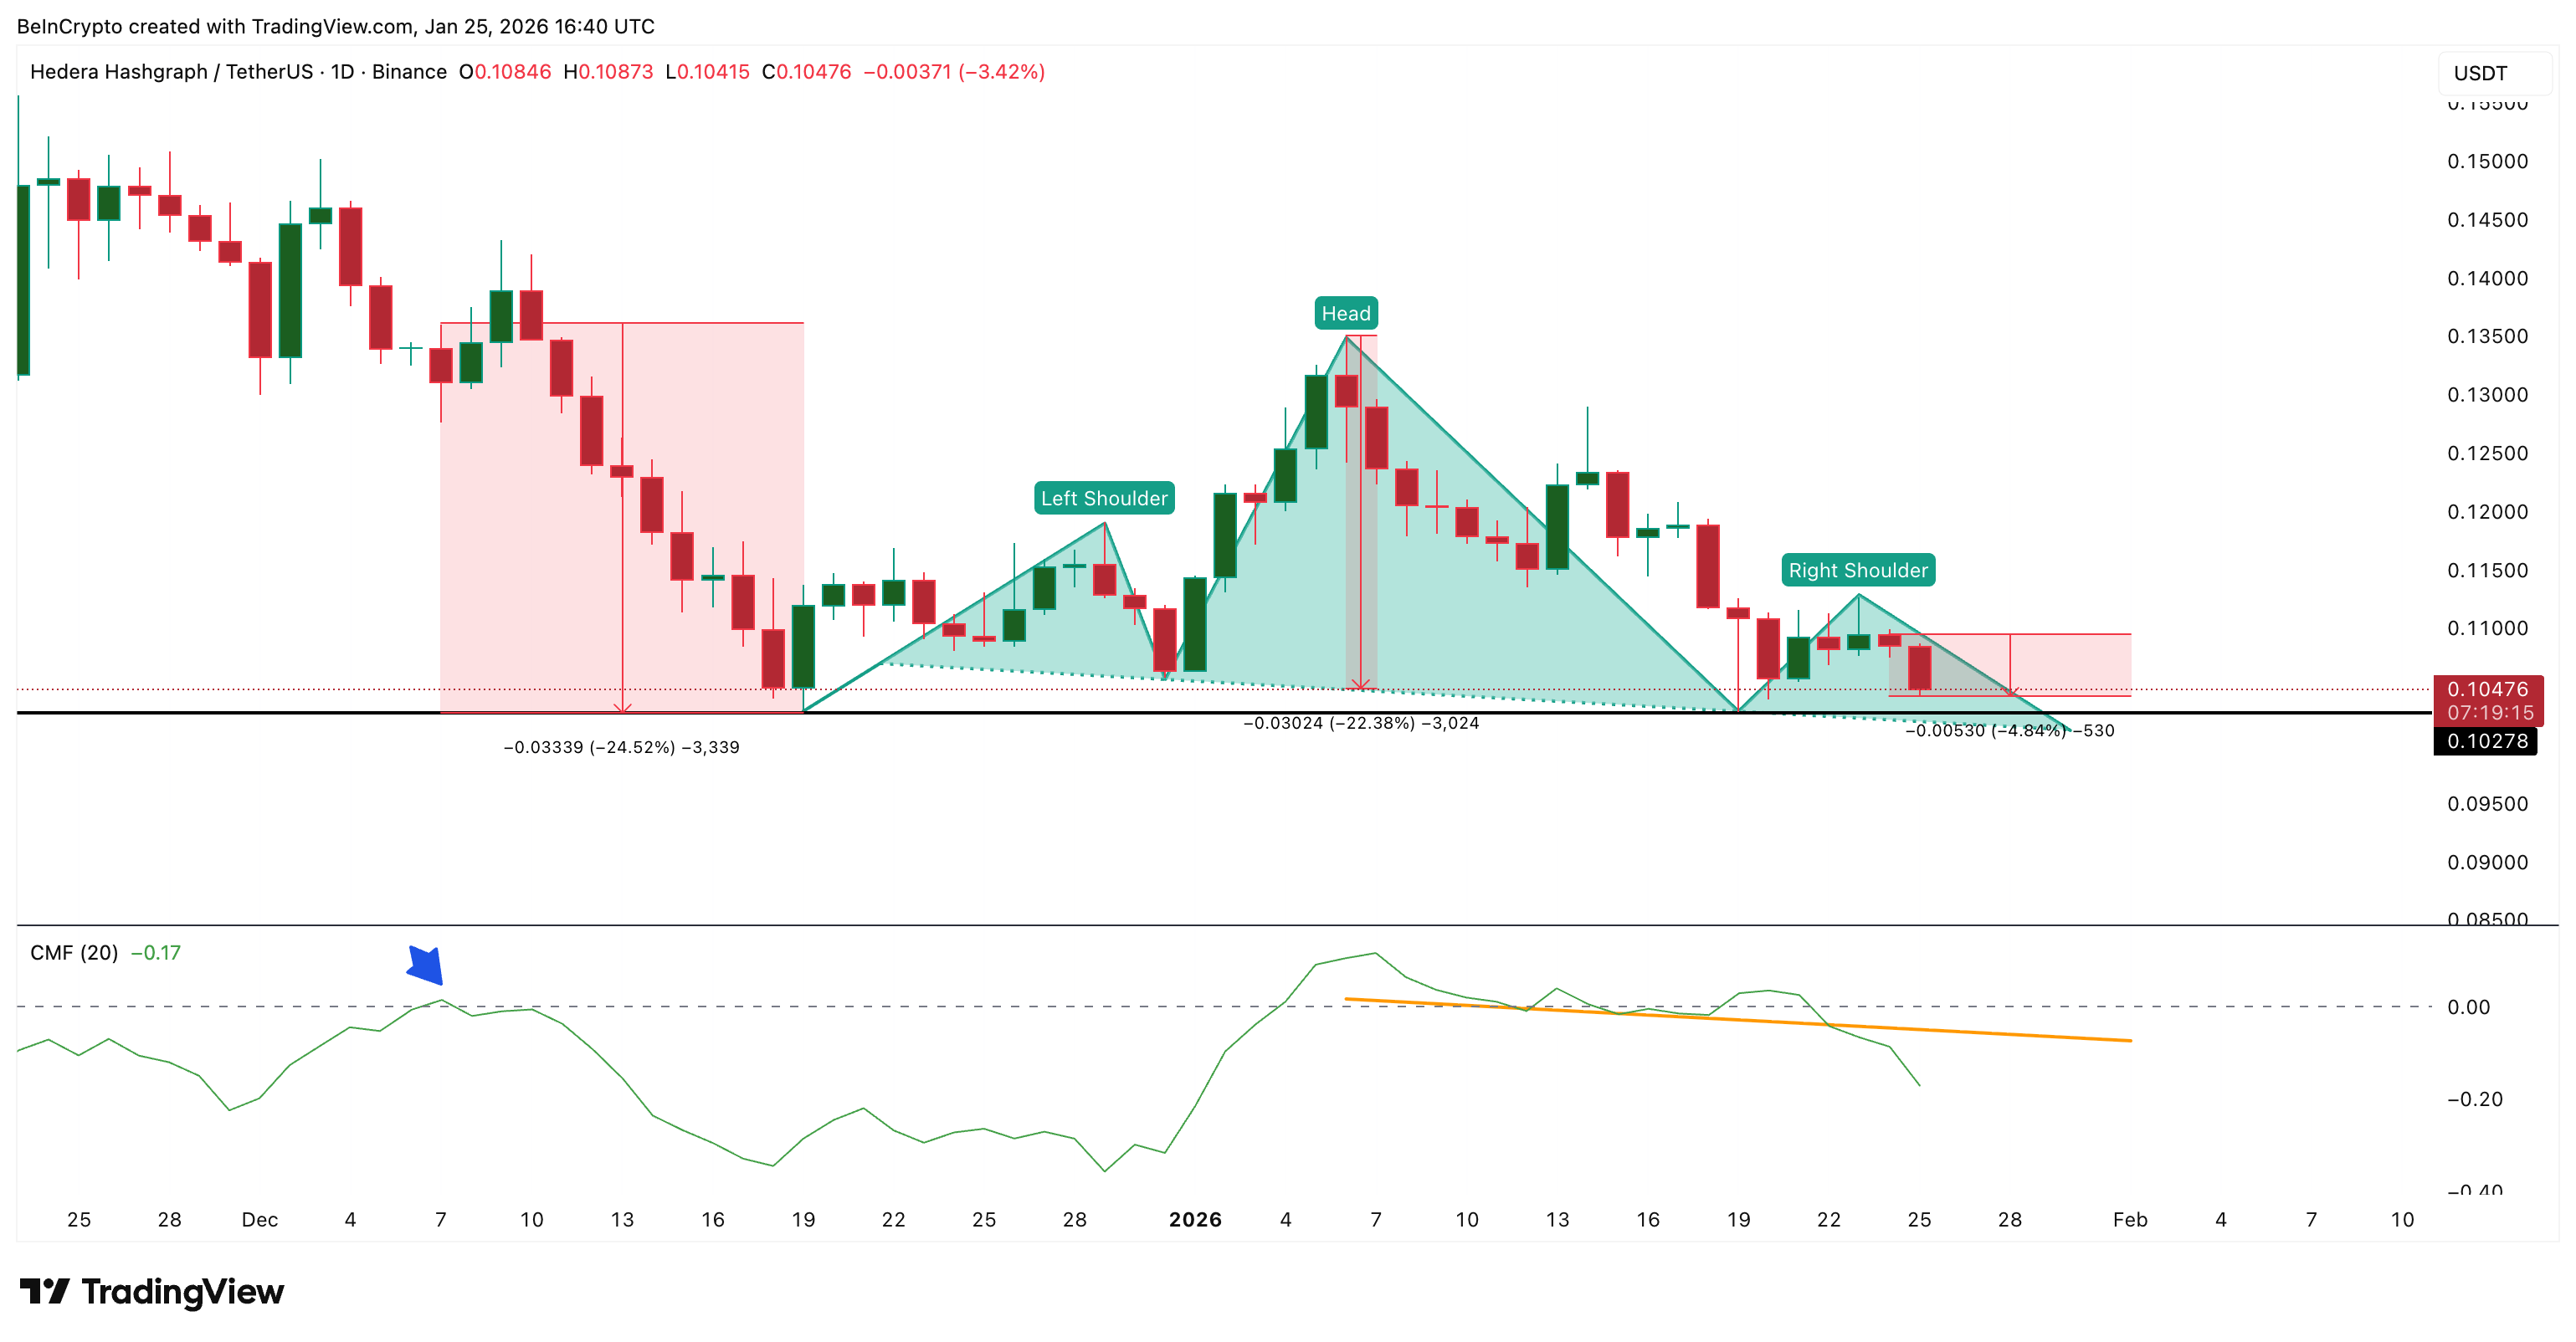
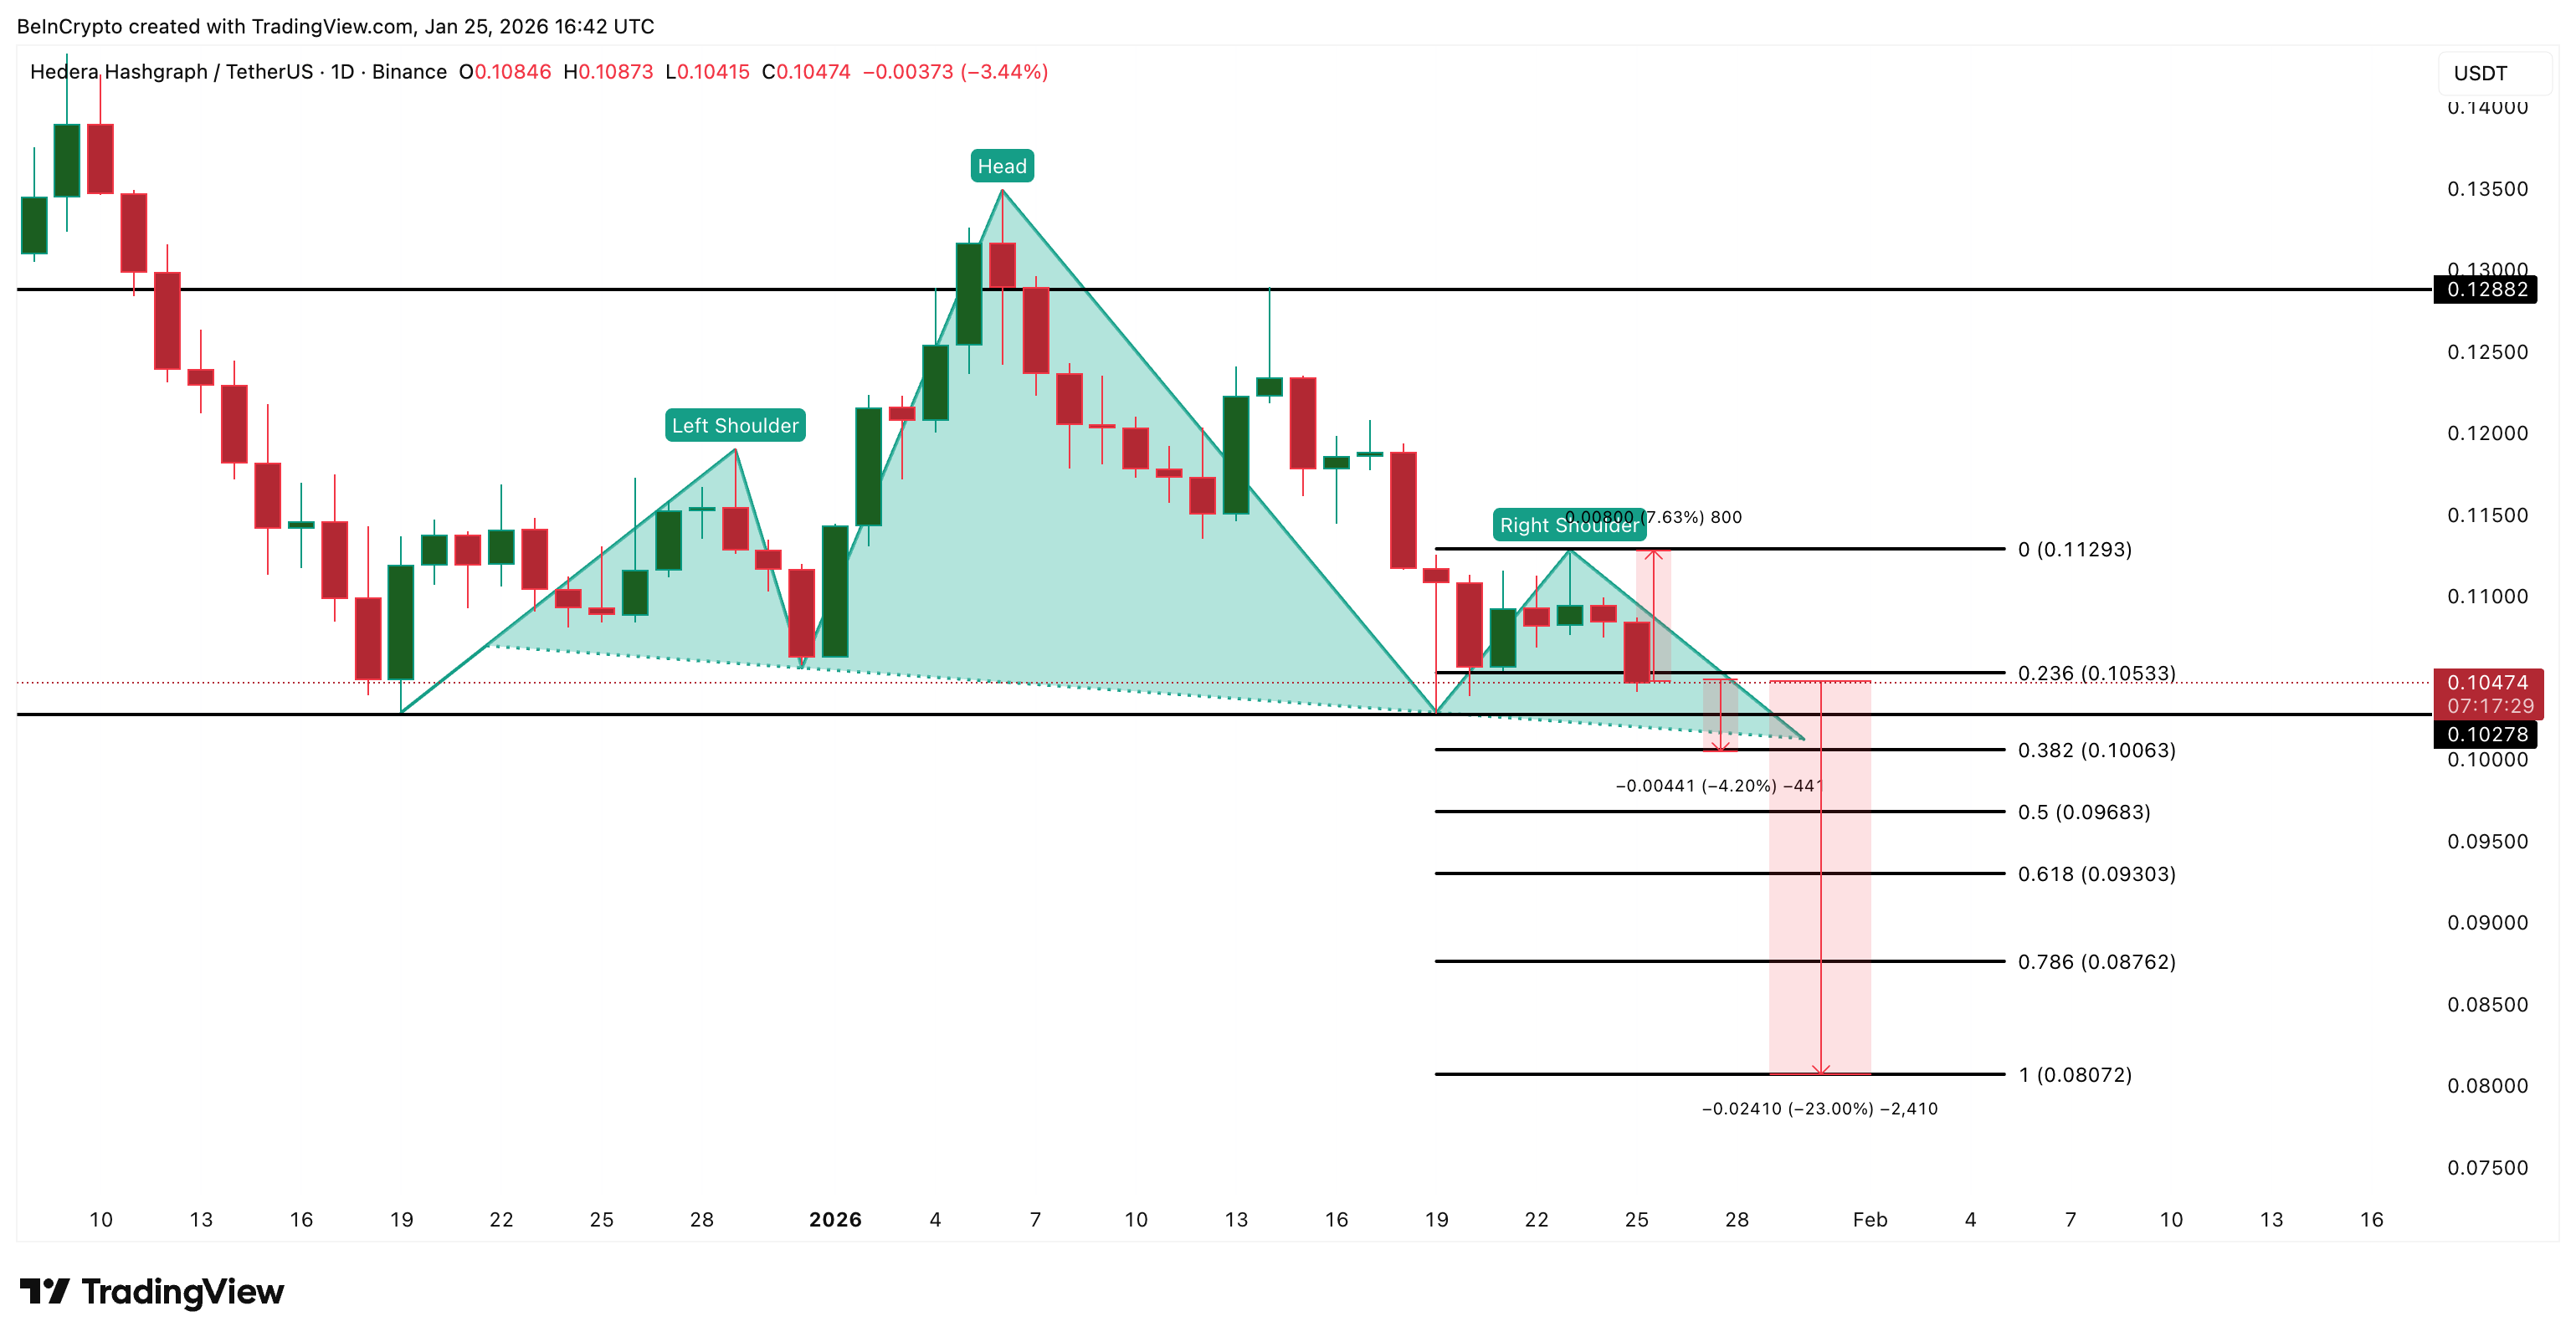
The price chart shows Hedera moving closer to completing a head-and-shoulders pattern. It often signals a bearish reversal once the neckline breaks.
For the HBAR price, the neckline sits near $0.102. A daily close below this level would activate a projected downside move of more than 20%, aligning with prior breakdowns from similar structures.
This risk is reinforced by the Chaikin Money Flow, or CMF. CMF measures whether capital is flowing into or out of an asset by combining price and volume. When CMF falls below zero, it signals net capital outflows.
HBAR’s CMF has now broken below a descending support line and slipped decisively under zero. The last time CMF dropped this sharply was in early December, just before Hedera fell nearly 25%. This tells us the current price weakness is backed by real selling pressure, not just low volume drifting.
 HBAR Price Structure: TradingView
Want more token insights like this? Sign up for Editor Harsh Notariya’s Daily Crypto Newsletter here.
As long as CMF remains negative and the neckline holds under pressure, the bearish structure stays active.
Falling Positive Sentiment Adds a Second Layer of Pressure
Price weakness is now being echoed by sentiment data.
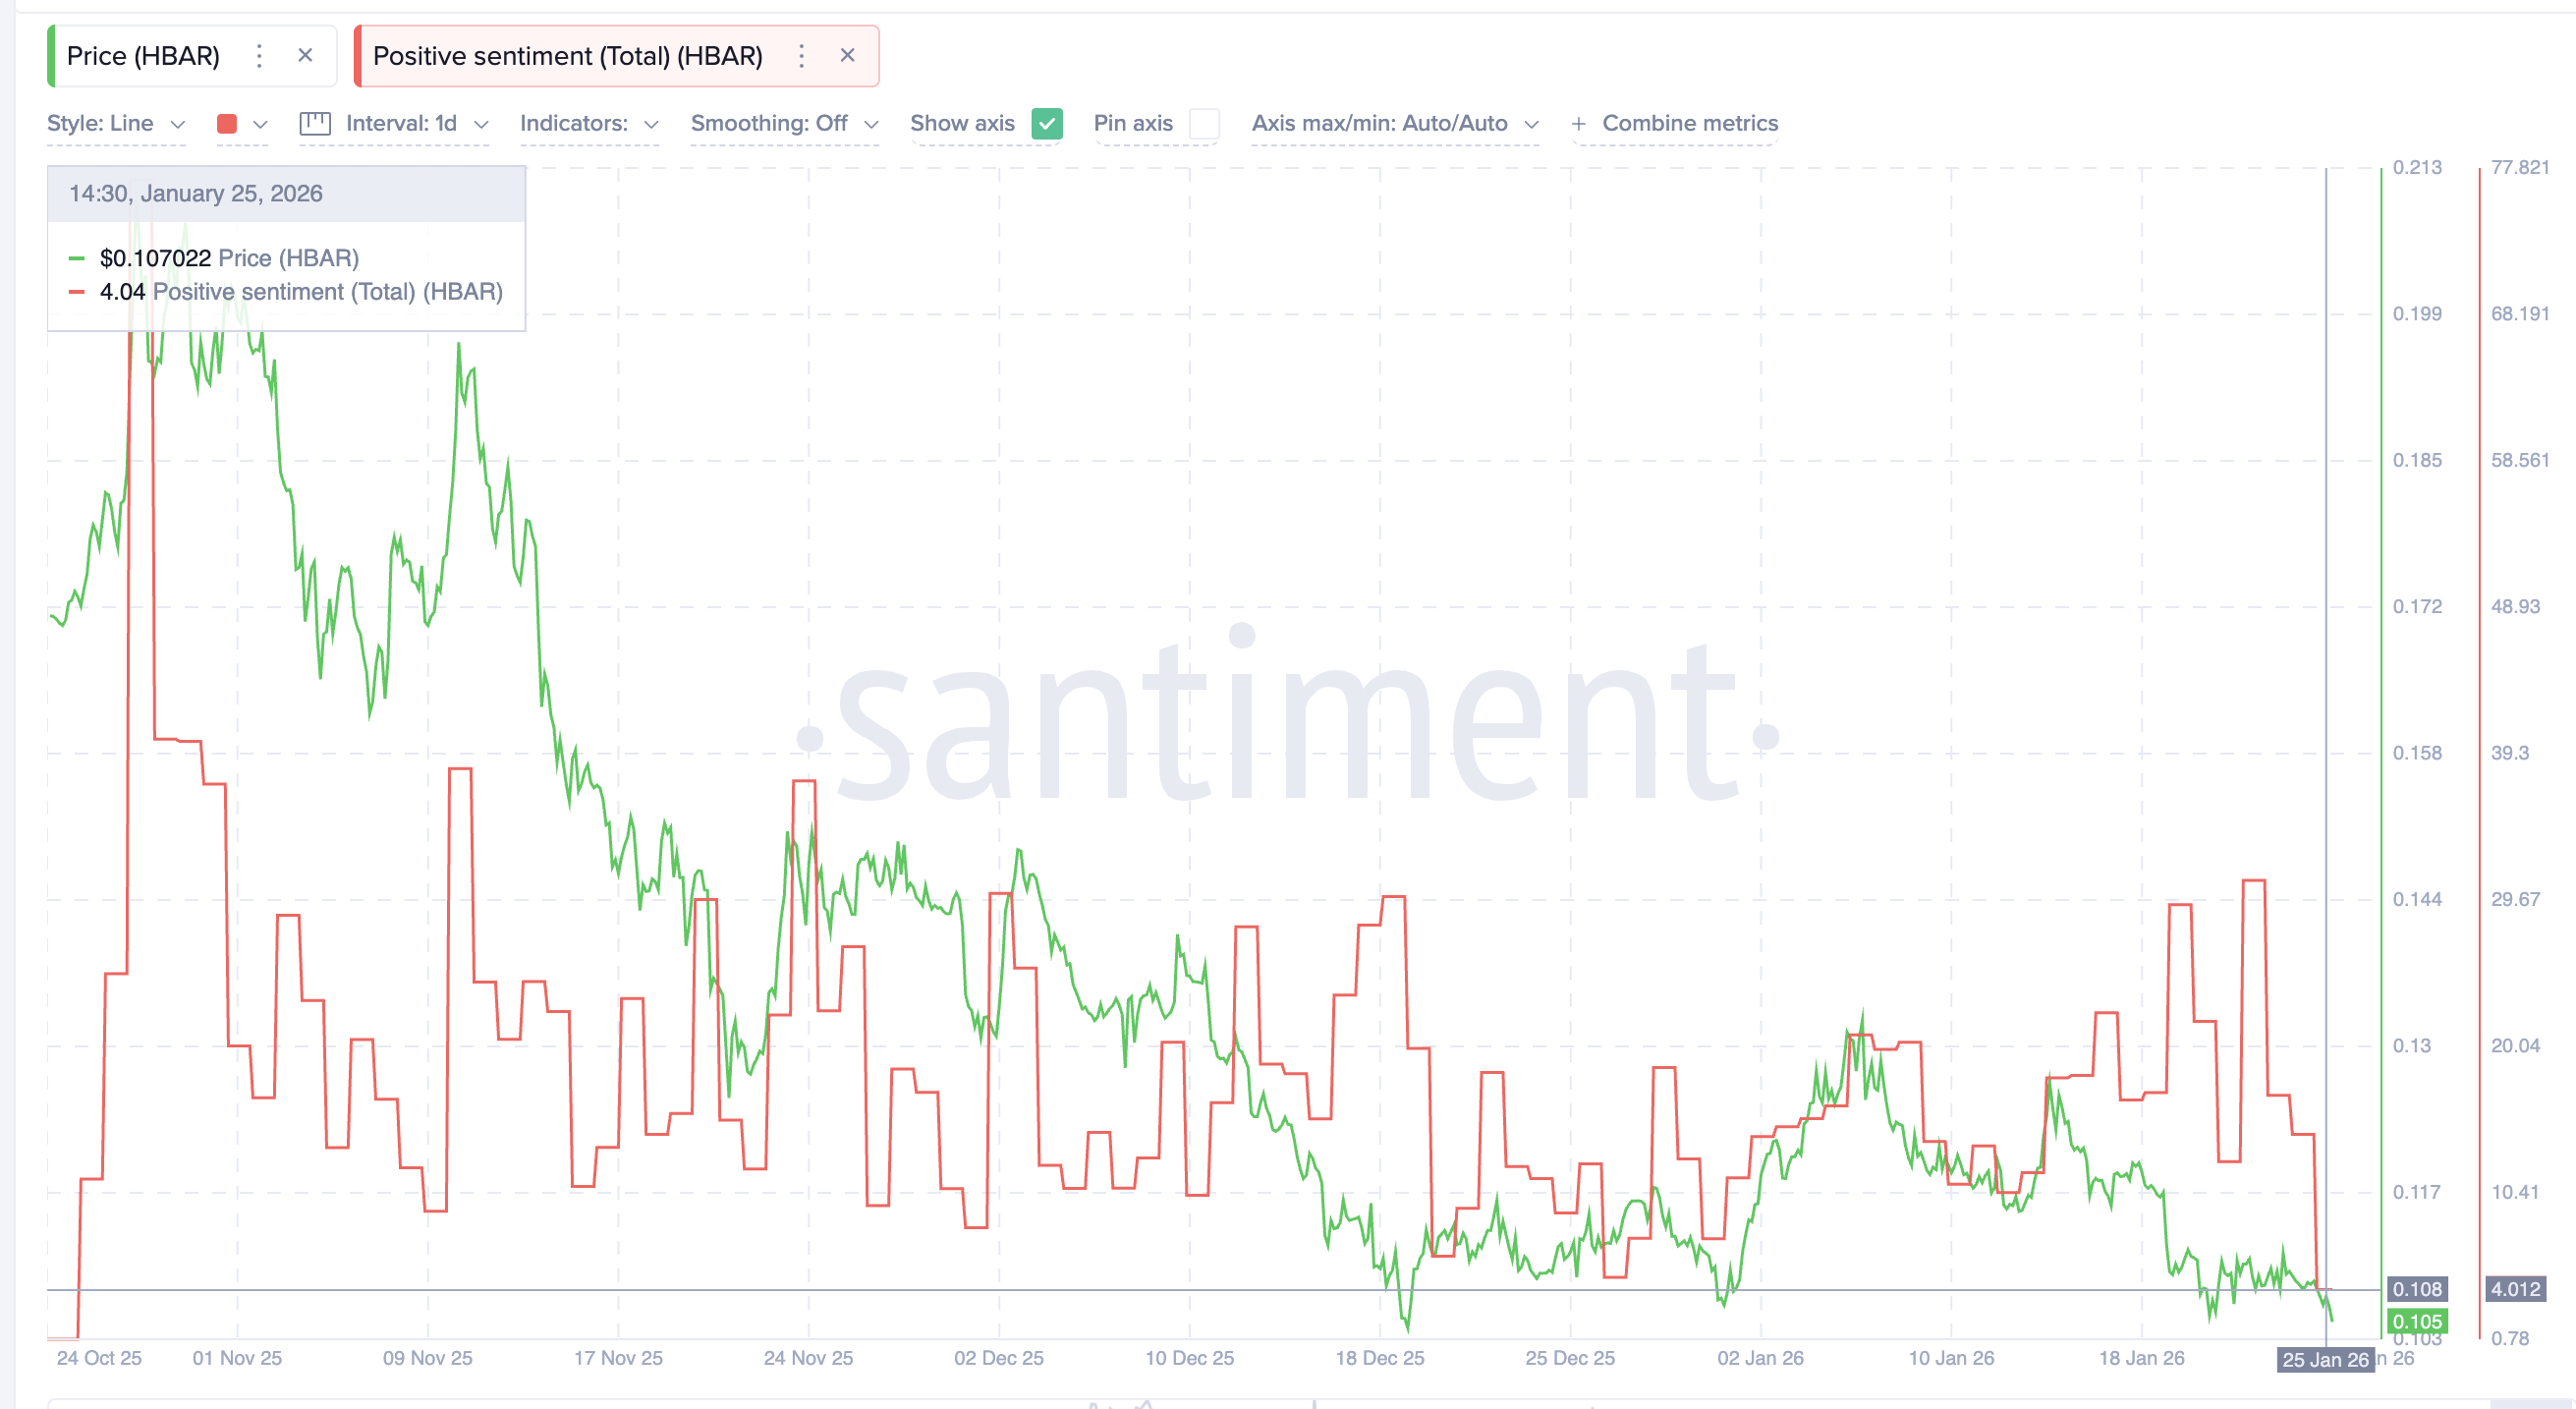
Positive sentiment tracks how much favorable discussion and commentary surround an asset across social and market sources. When positive sentiment falls to local lows, it often reflects fading confidence and reduced willingness to buy dips.
Hedera’s positive sentiment has dropped to its lowest level since late October. Historically, similar sentiment troughs have aligned closely with price declines.
On November 9, sentiment hit a local low while HBAR traded near $0.17. Within two weeks, the price slid to around $0.13.
 Weak Sentiment: Santiment
The current setup looks similar. Sentiment is weakening first, while price is still hovering above key support. This kind of divergence often results in the price moving lower to match confidence levels. With both structure and sentiment pointing down, downside risk is now clearly elevated.
Dip Buying and Derivatives Keep Hedera Reversal Hopes Alive
Despite the bearish signals, there are early signs of support returning beneath the surface.
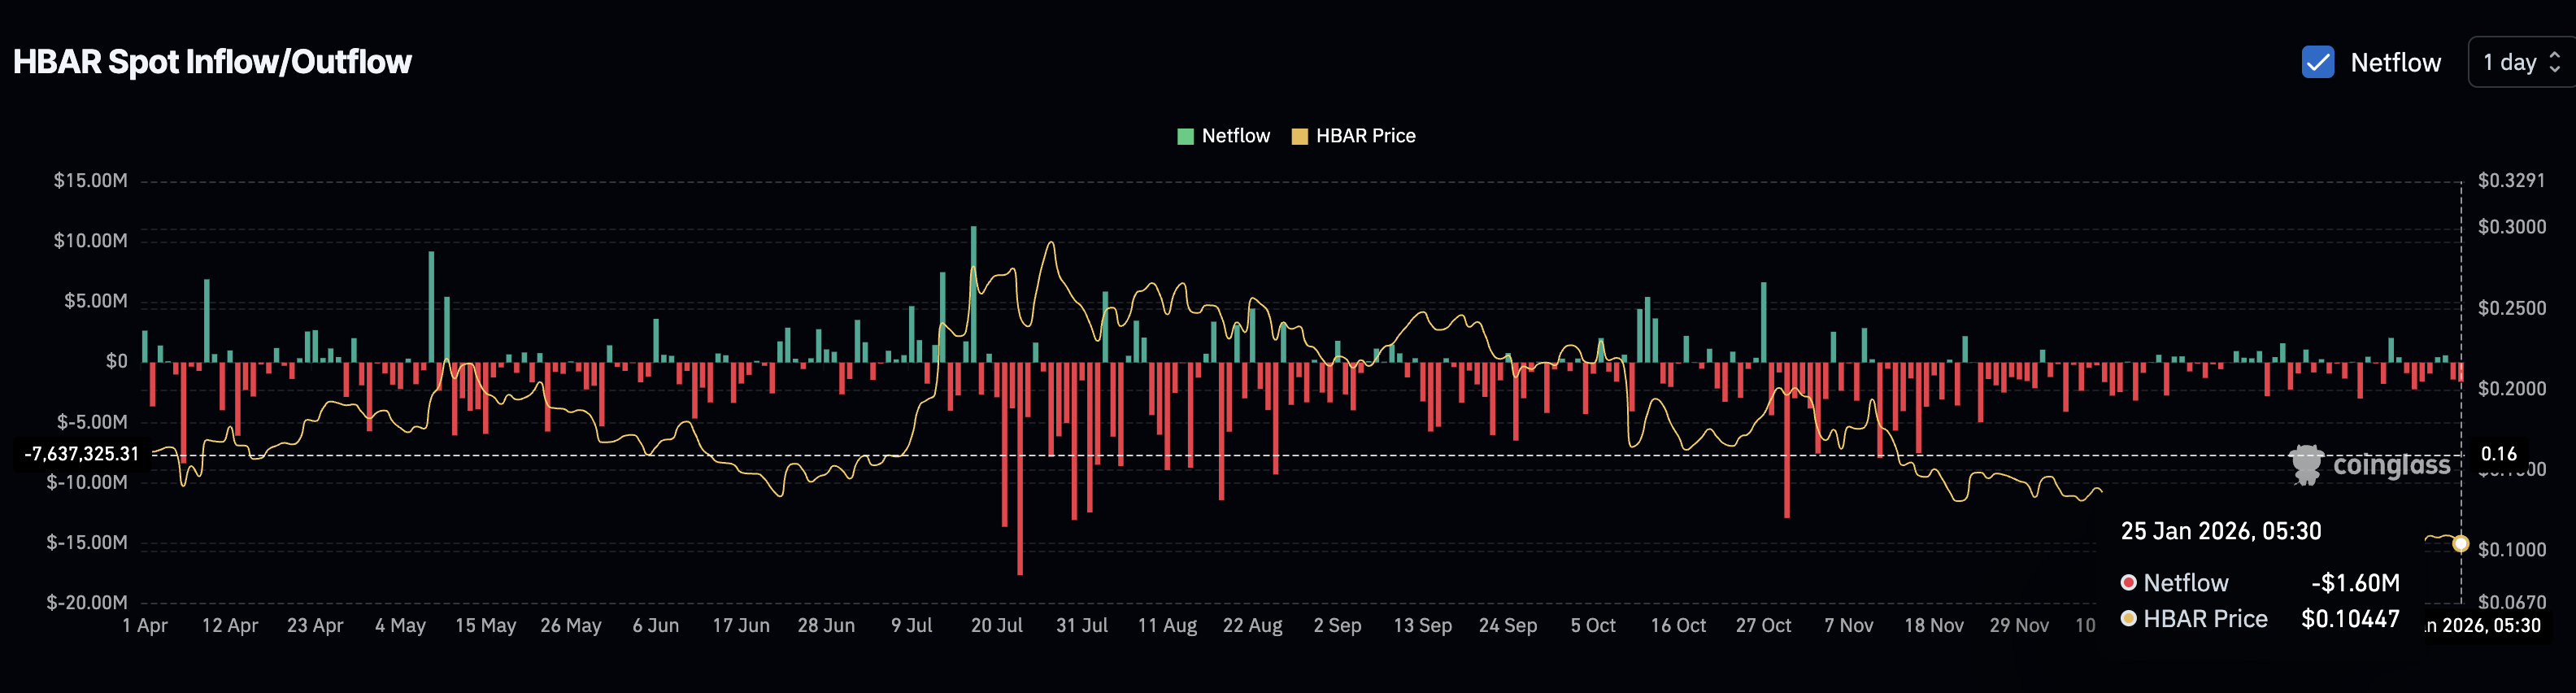
Spot exchange data shows that net outflows have picked up over the past two days as the HBAR price corrected by almost 5%. Net outflows occur when more tokens leave exchanges than enter, which usually signals buying or long-term holding. On January 24, net outflows stood near $1.41 million, rising to roughly $1.60 million on January 25. This suggests dip buyers are stepping in after recent selling.
 HBAR Perps: Coinglass
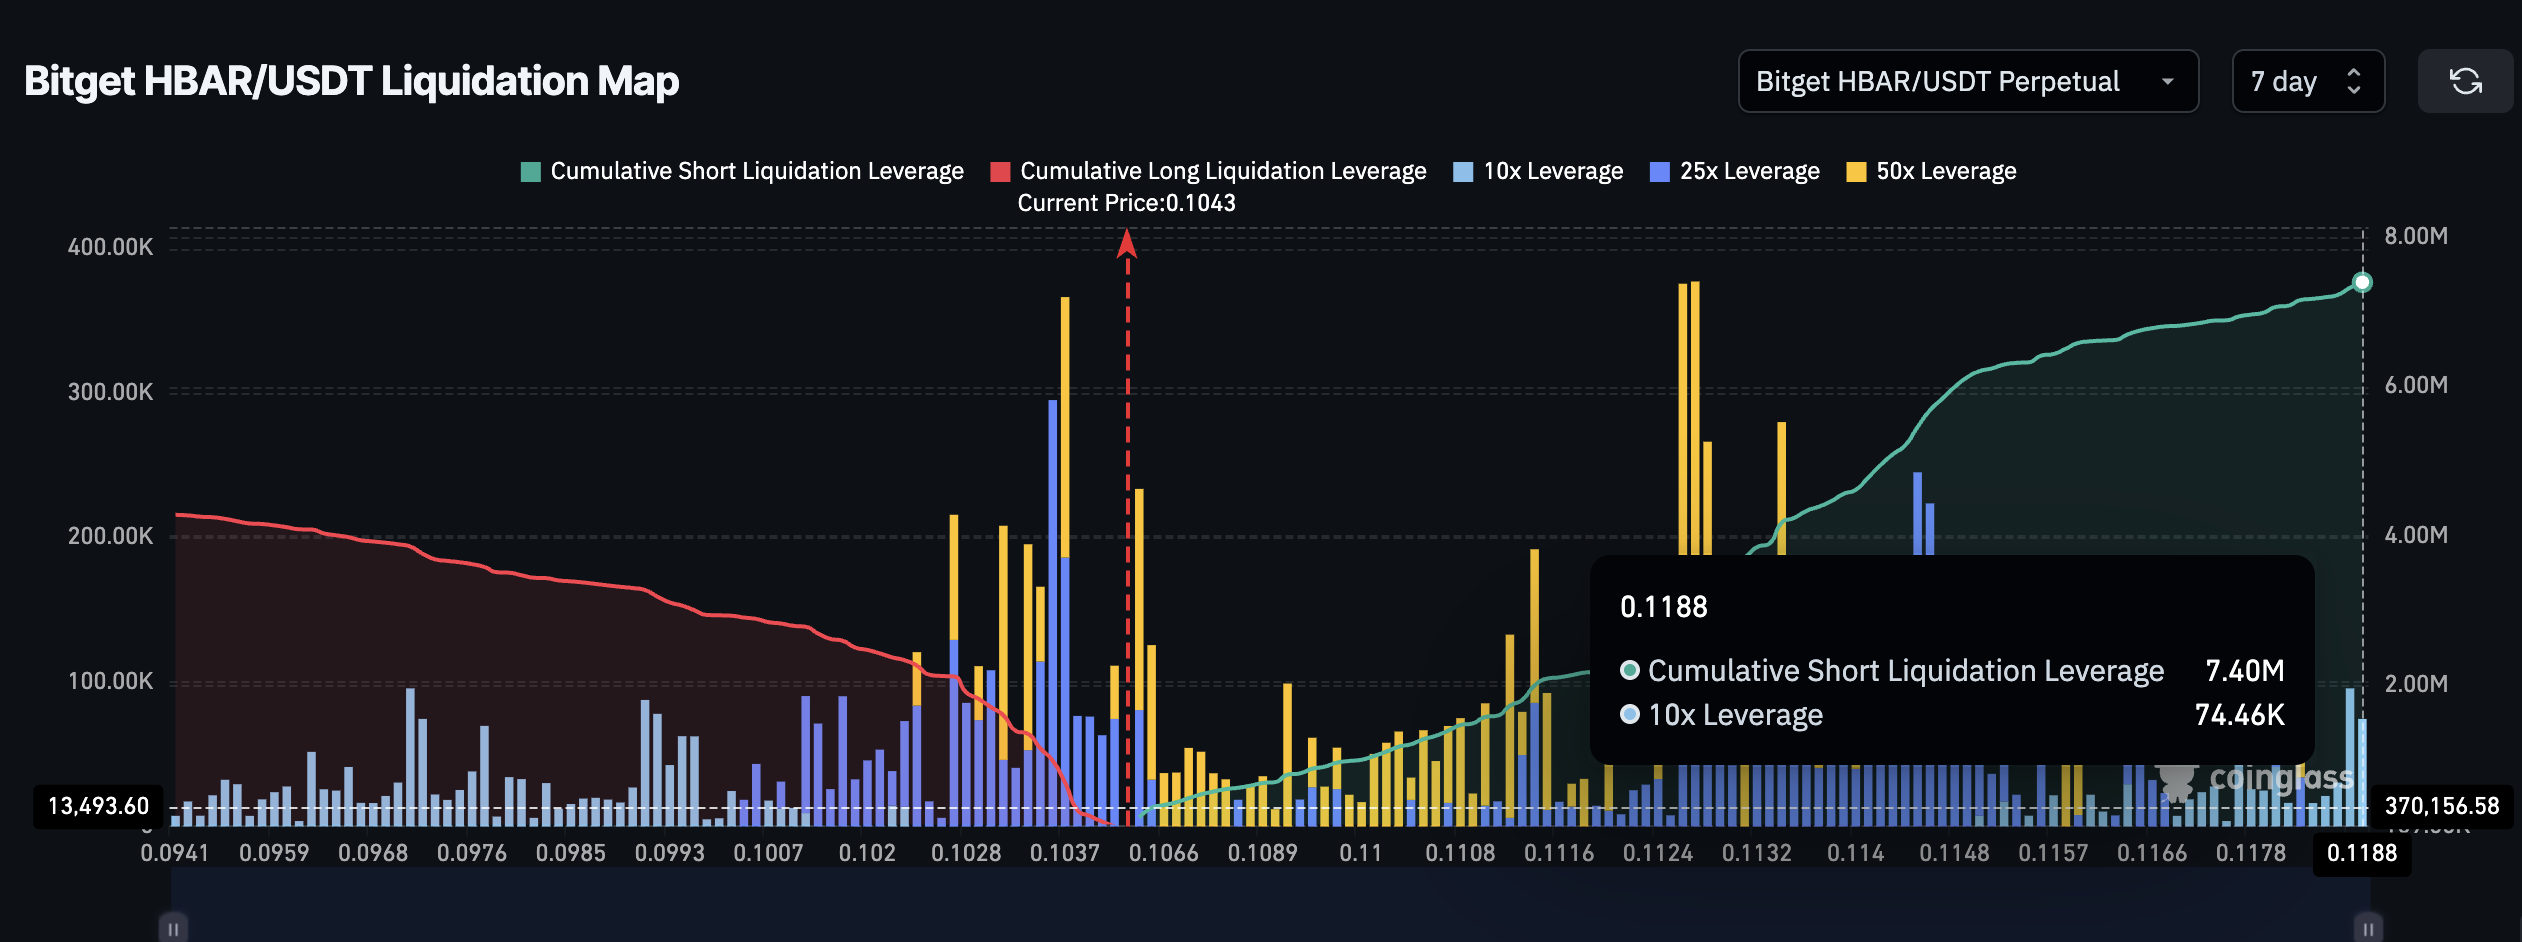
Derivatives data adds another layer. On Bitget’s HBAR perpetual market, cumulative short liquidation exposure over the next seven days sits near $7.40 million, compared with about $4.28 million in long liquidations. This 70% imbalance towards shorts means a large portion of traders are positioned for further downside.
 Liquidation Map: Coinglass
When short exposure outweighs longs by this margin, even a modest price recovery can trigger short liquidations. Those forced-buy orders can accelerate upside moves. This creates a narrow window in which bearish positioning could fuel a bounce.
Critical HBAR Price Levels To Track Now
HBAR price action now holds the final answer.
On the downside, $0.100-$0.102 is the key level. A daily close below it would confirm the head-and-shoulders breakdown and open the path toward $0.080, matching the 20% downside projection.
On the upside, Hedera must first reclaim $0.105 to show short-term stabilization. The real test comes at $0.112, which aligns with a key Fibonacci level and the right-shoulder resistance. A clean move above $0.112 would invalidate the right shoulder, weaken the bearish pattern, and likely trigger a big cluster of short liquidations.
 HBAR Price Analysis: TradingView
If that happens, the HBAR price could extend toward $0.128, where prior supply and resistance sit.
For now, the balance remains fragile. Bearish metrics are building, but dip buying and short positioning leave the door slightly open for a reversal. The next few daily closes will decide which side takes control.
Recommended Articles


