


Ethereum’s Pattern Break Puts $4,000 Back on the Table — But Not Without Risks
Ethereum is showing renewed strength. The price is up nearly 7% over the past 24 hours and has extended its recent recovery, pushing decisively higher on the 12-hour chart.
That move was not random. Ethereum has now broken out of a cup-and-handle pattern, a structure that often signals trend continuation when confirmed with volume.
The breakout places the $4,000 level back into focus. Still, while the structure looks constructive, several momentum and on-chain signals suggest the possible rally might not be risk-free.
Ethereum Confirms Cup-and-Handle Breakout as Volume Supports the Move
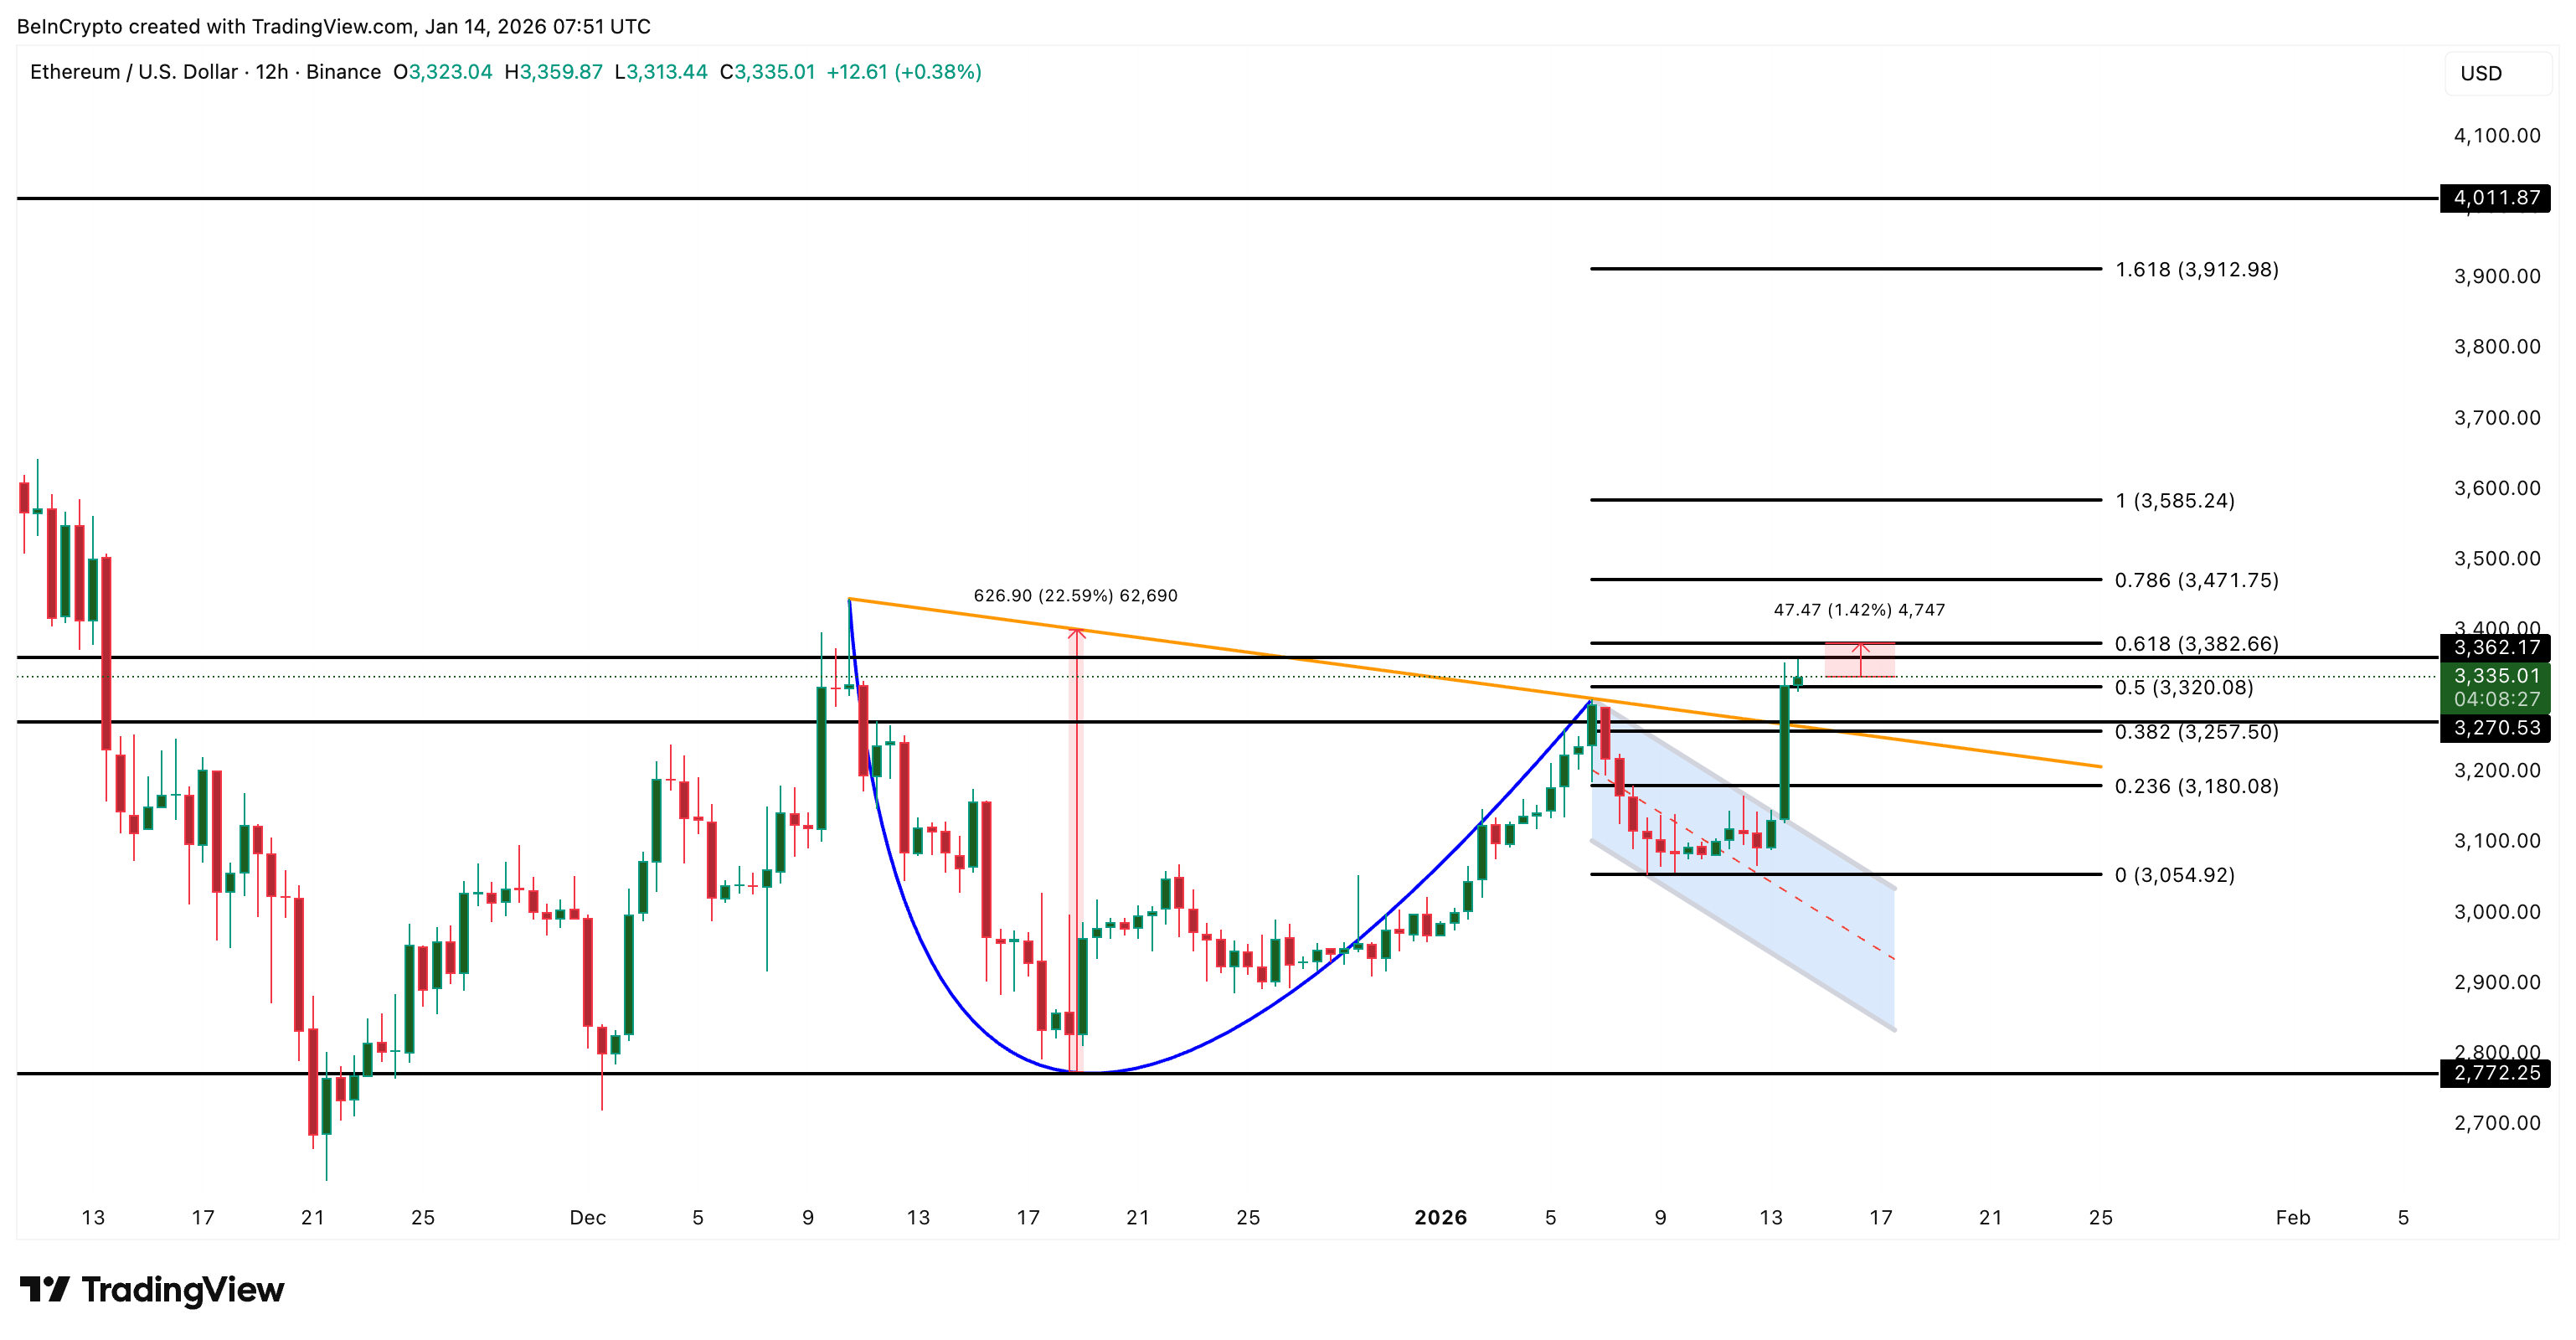
On the 12-hour chart, Ethereum has completed a cup-and-handle formation with a slightly downward-sloping neckline. That slope matters.
A falling neckline means buyers must absorb sell pressure across multiple levels, not just clear a flat resistance in one move. In simple terms, the recovery requires more strength, which is why the price continues to work its way higher instead of breaking out in a single impulse.
On January 13, Ethereum finally pushed through that neckline and followed with a strong bullish candle. Volume is the key confirmation.
The breakout came with expanding green volume, showing that buyers were stepping in with conviction rather than price drifting higher on thin liquidity. That participation reduces the risk of a quick false move, even if the follow-through is gradual rather than explosive.
Want more token insights like this? Sign up for Editor Harsh Notariya’s Daily Crypto Newsletter here.
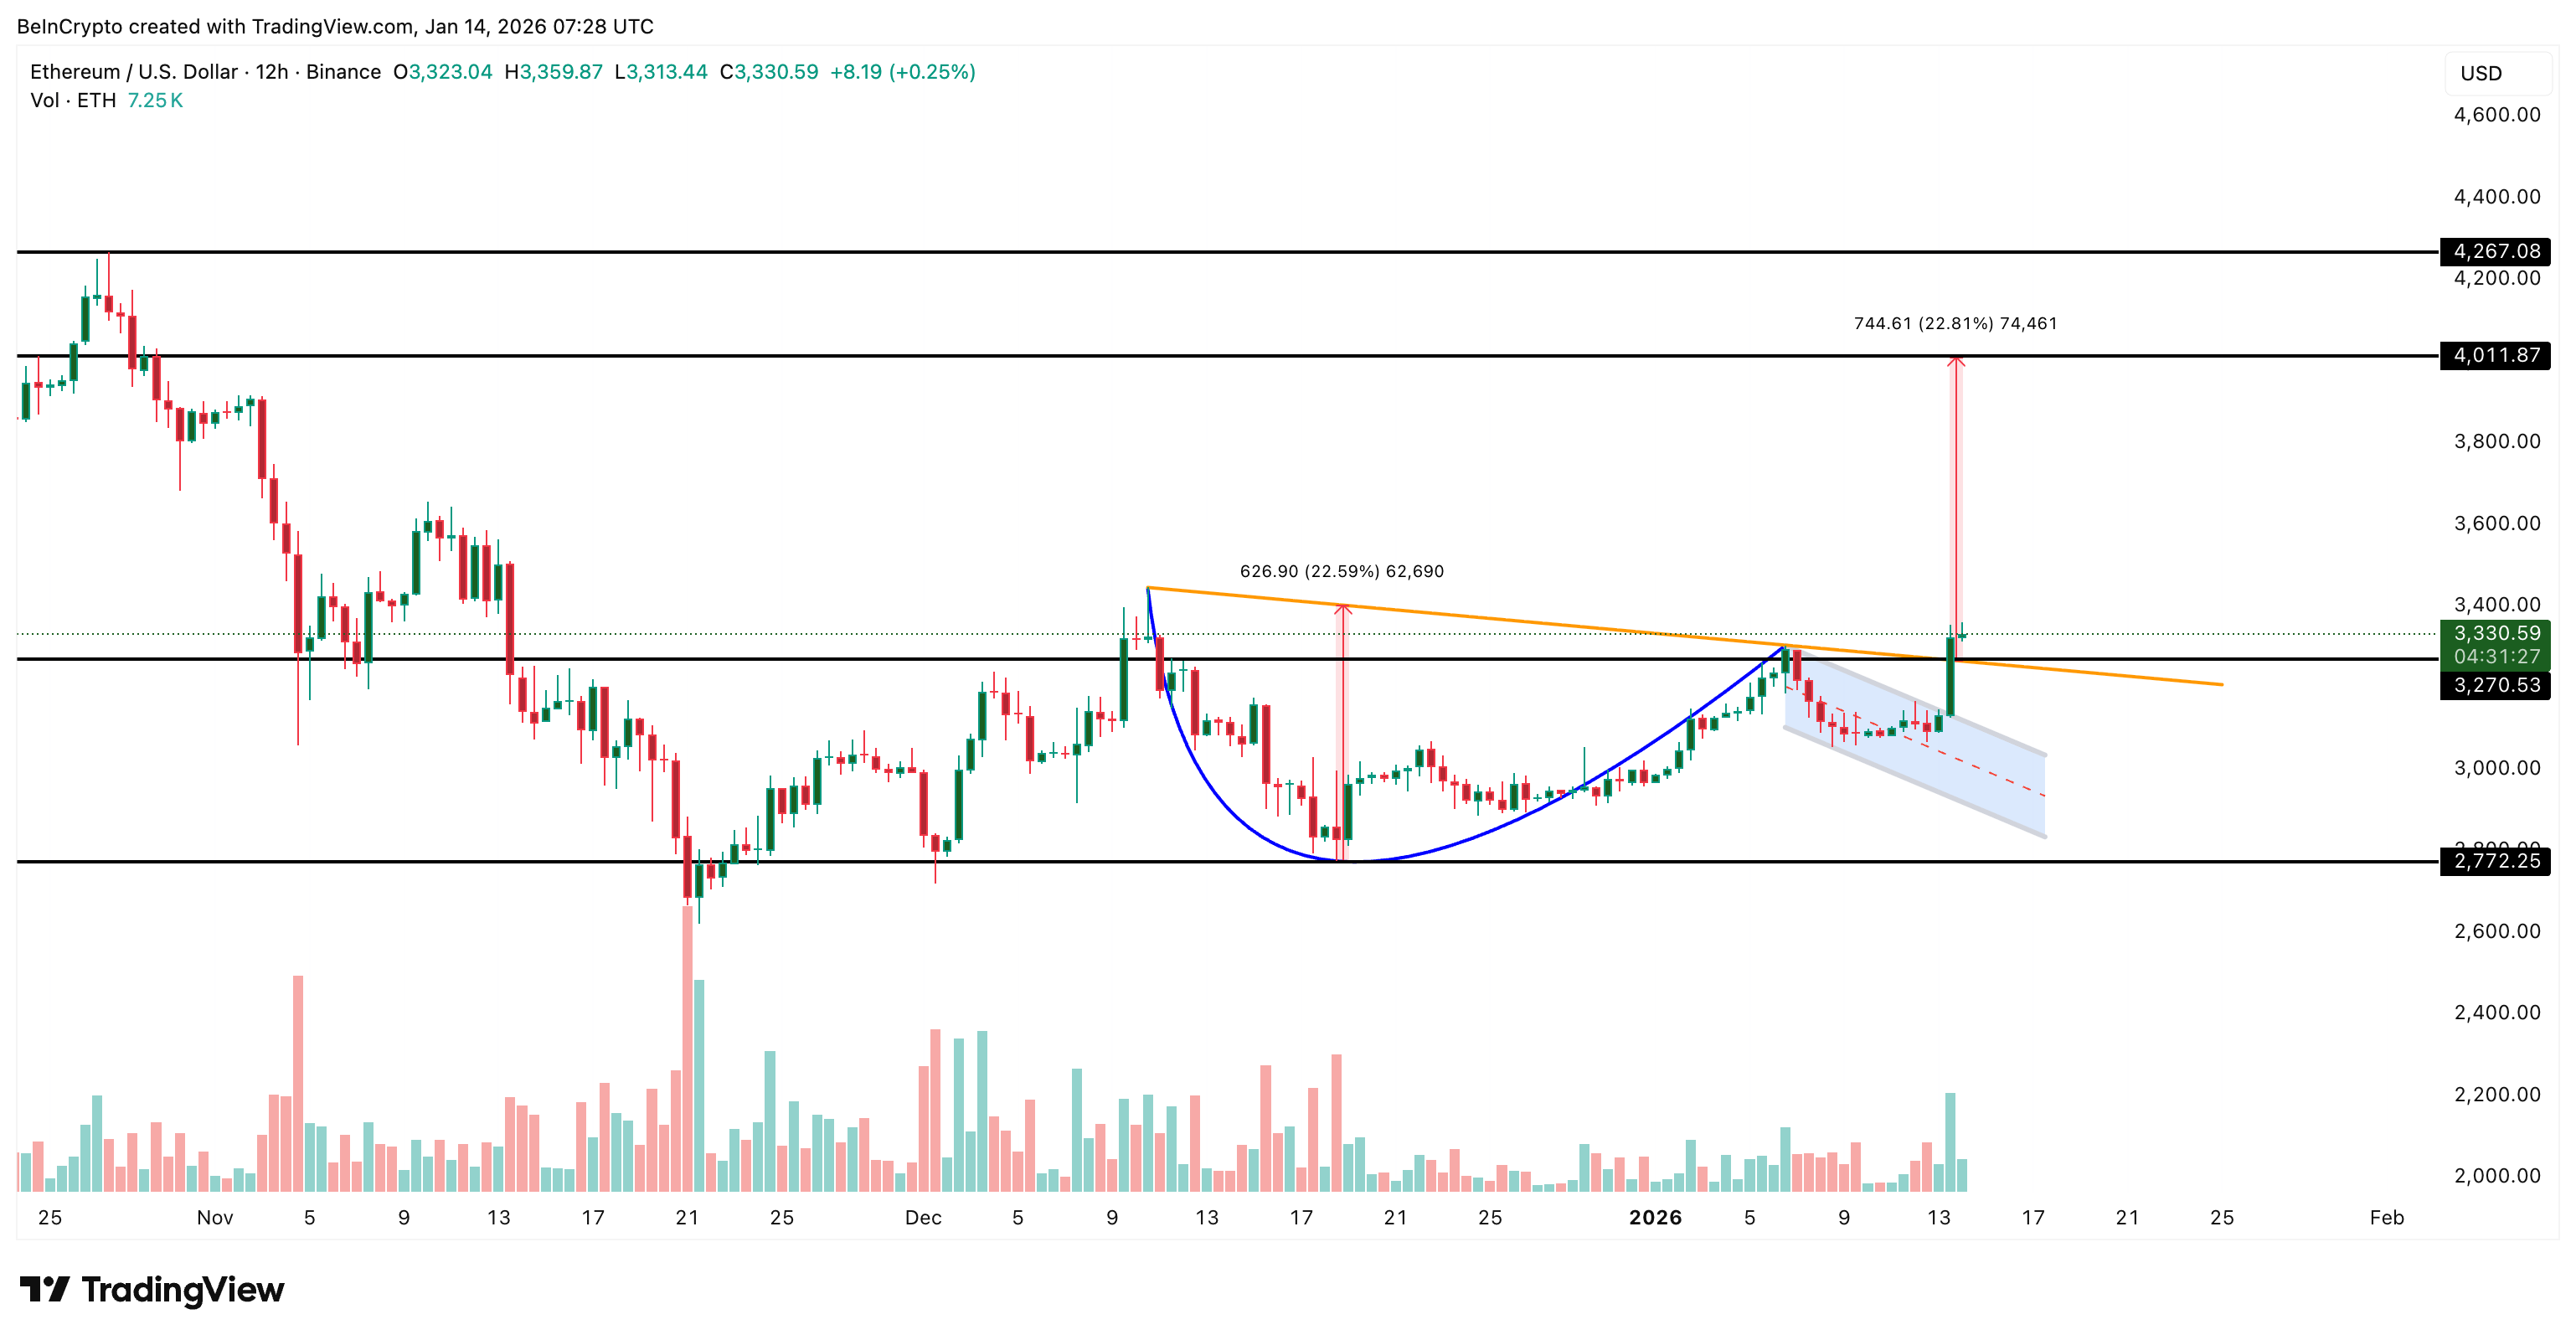 ETH Price Breakout: TradingView
Measured from the base of the cup, the pattern projects toward the $4,010 zone. This does not mean Ethereum must move there in a straight line, but it does put that level back on the technical roadmap for the first time in weeks.
With structure and volume aligned, the bullish case is clear. The next question is whether momentum can keep up.
Momentum Risk Emerges As Short-Term Profits Rise
While the price structure looks healthy, momentum indicators introduce conditional risk. On the same 12-hour timeframe, Ethereum’s Relative Strength Index, or RSI, is showing signs of a potential bearish divergence.
RSI measures momentum by comparing recent gains to recent losses. A bearish divergence forms when price makes higher highs while RSI makes lower highs, often signaling weakening momentum. On the 12-hour chart, that might result in a dip.
Between January 6 and January 14, Ethereum’s price pushed higher, but RSI has not yet confirmed that strength. This divergence is still forming, not confirmed. It would likely stay unconfirmed if Ethereum sustains a move above the $3,360 area, with rising RSI. Until then, it remains a risk, not a verdict.
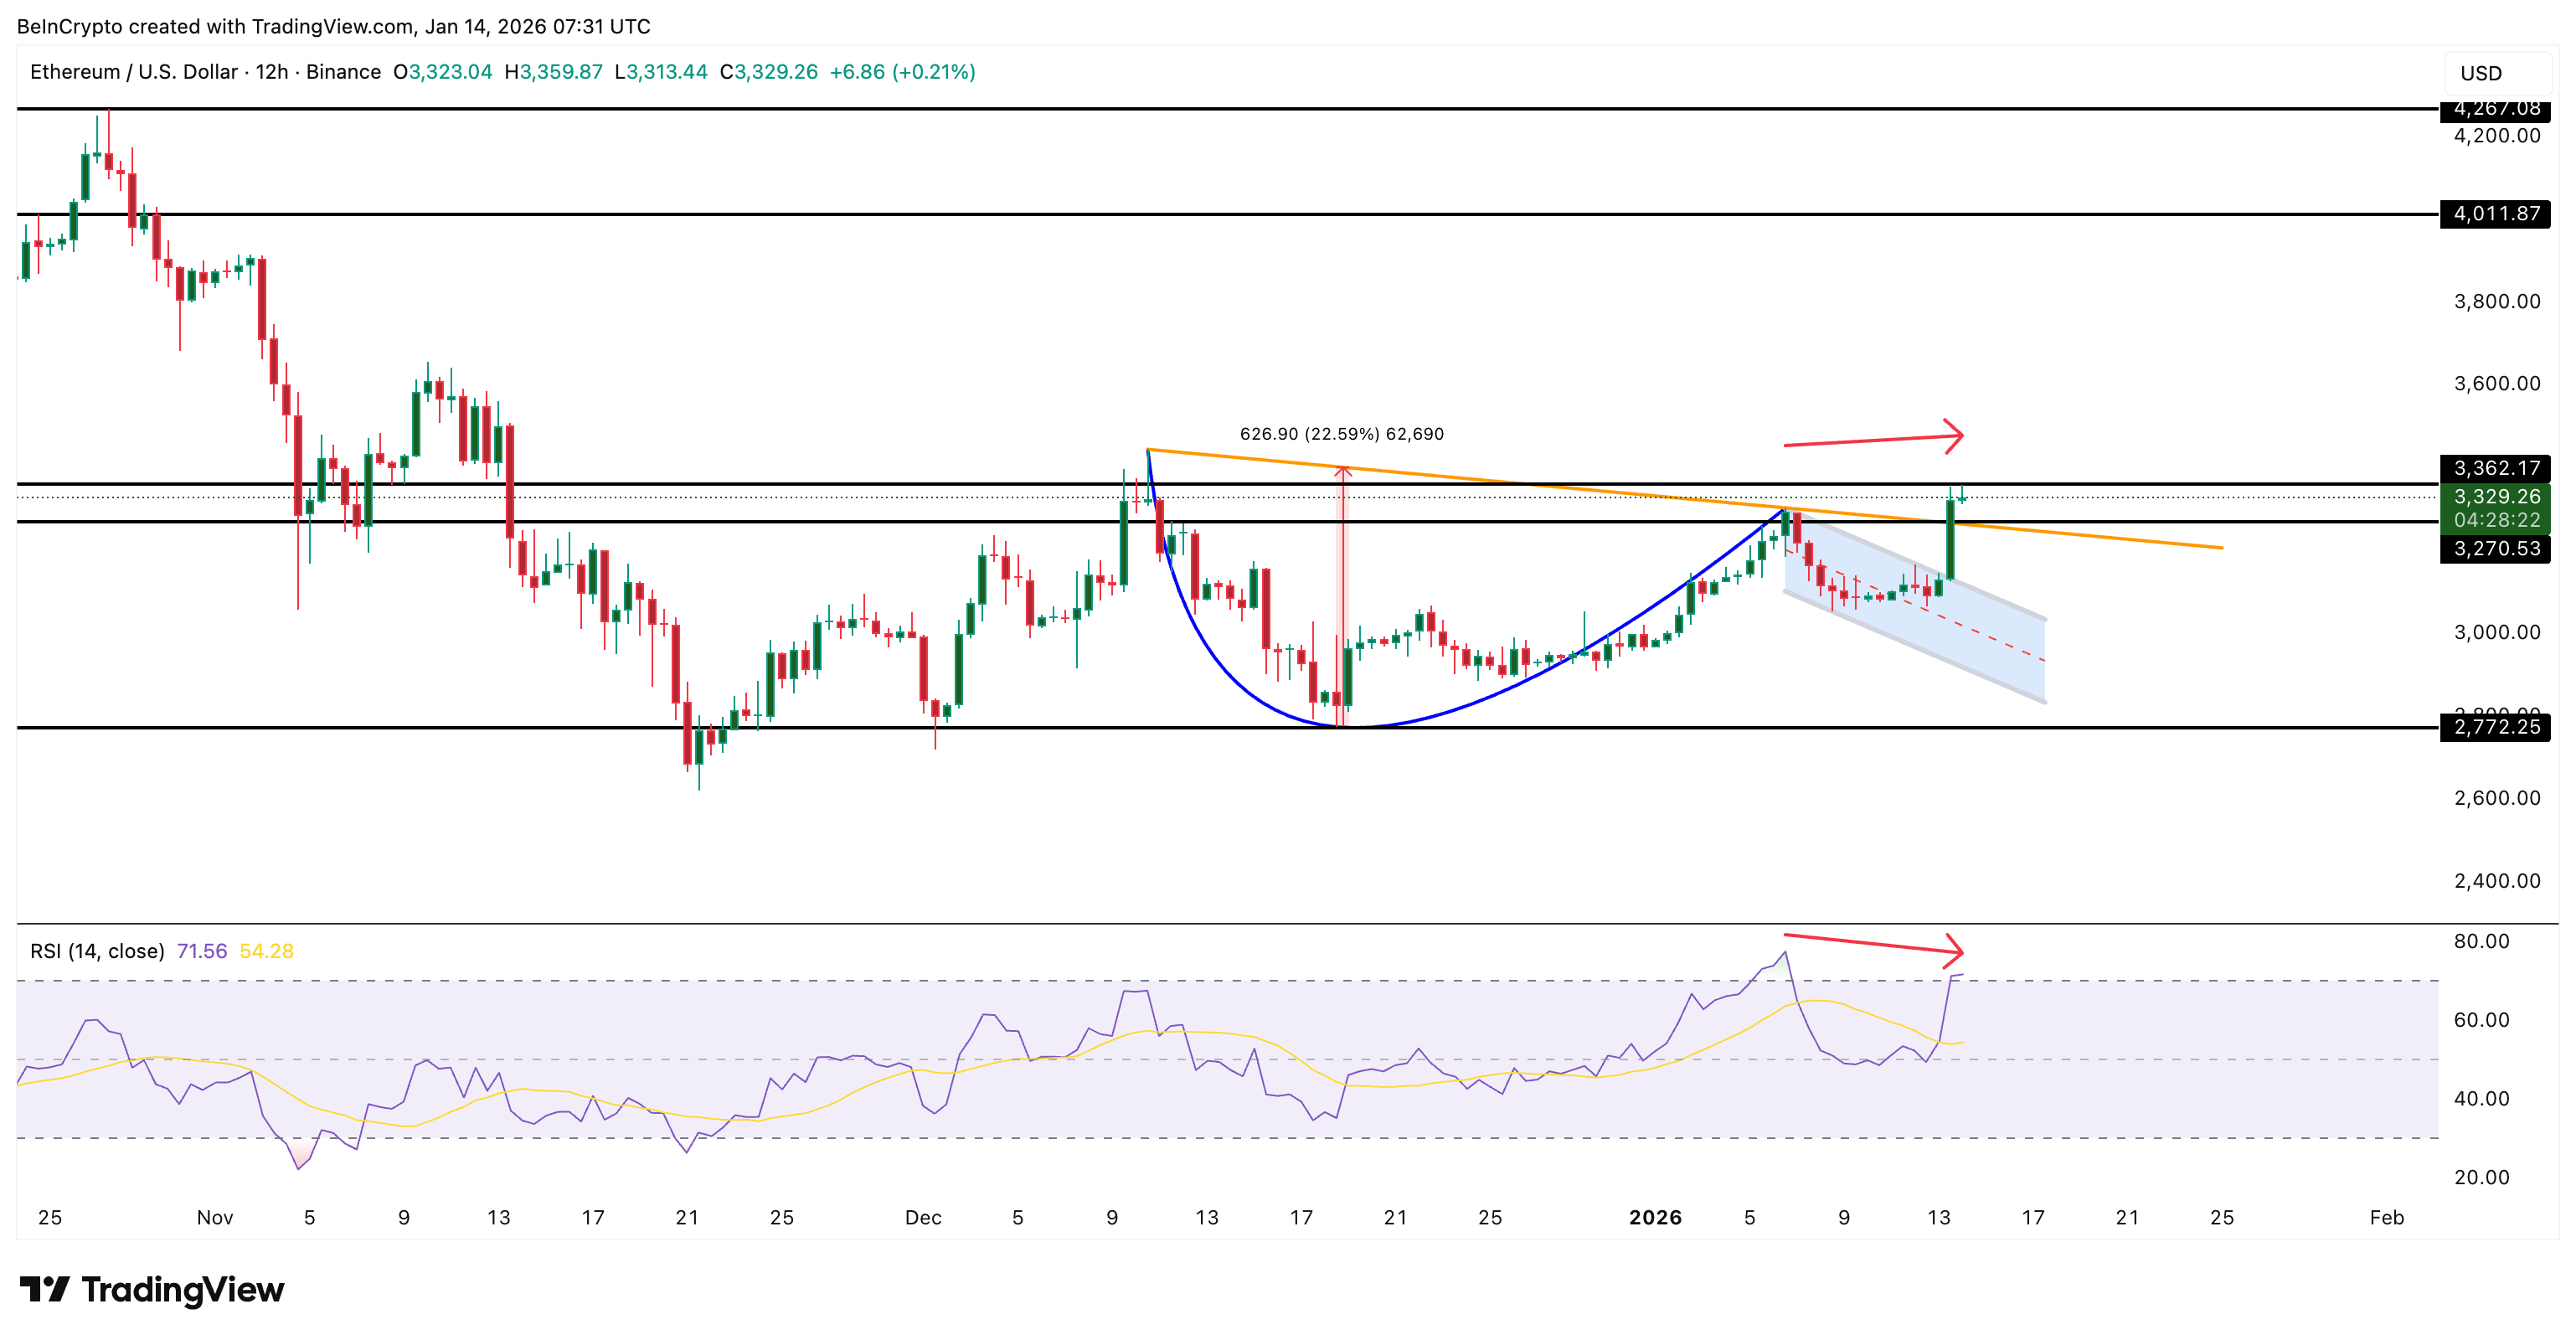 ETH RSI Divergence Develops: TradingView
On-chain data adds more context. Short-term holder NUPL, which stands for Net Unrealized Profit/Loss, has risen to its highest level in roughly two months, despite still being in the capitulation zone. NUPL measures whether holders are sitting on profits or losses. Rising NUPL means more short-term holders are in profit, increasing the temptation to sell.
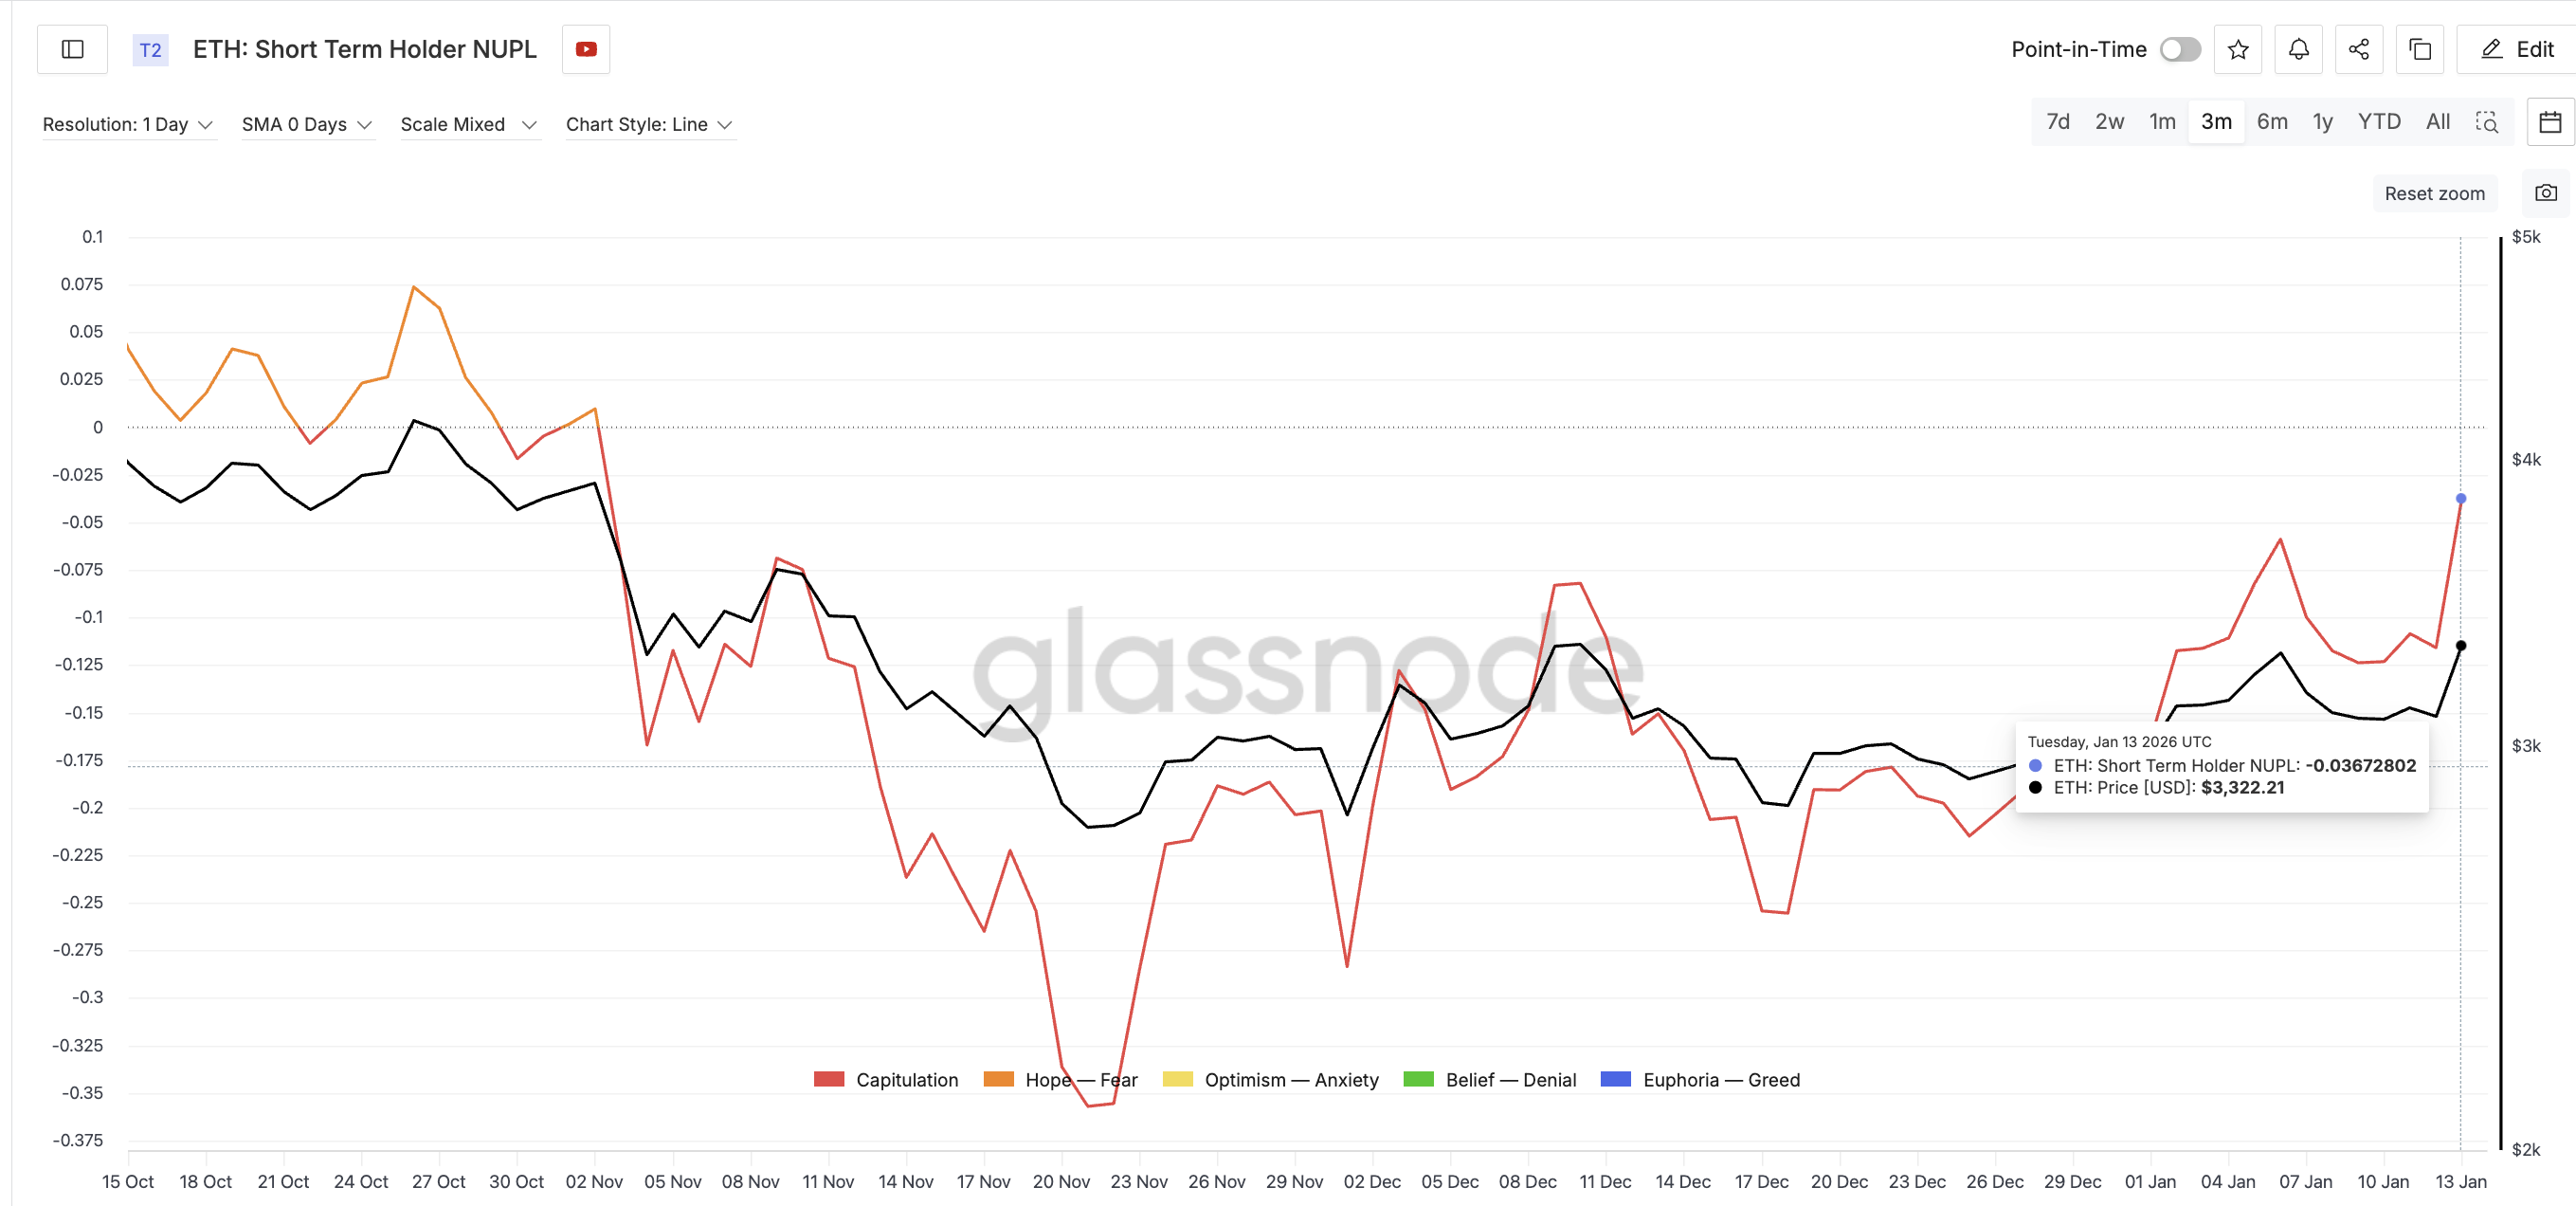 NUPL Rises: Glassnode
This matters because the last time short-term holder NUPL made a local peak, Ethereum pulled back sharply. In early January, as NUPL peaked, Ethereum dropped from around $3,295 to roughly $3,090, a decline of about 6%. That historical reaction makes the current NUPL rise worth watching.
However, there is an important difference this time. Spent coins activity, which tracks whether recently acquired coins are actually being moved and sold, remains muted. Over the past 24 hours, coins in the 30–60 day age band being spent have dropped by nearly 80% from their recent peak, showing that even as unrealized profits rise, short-term holders are not rushing to move or sell their coins yet.
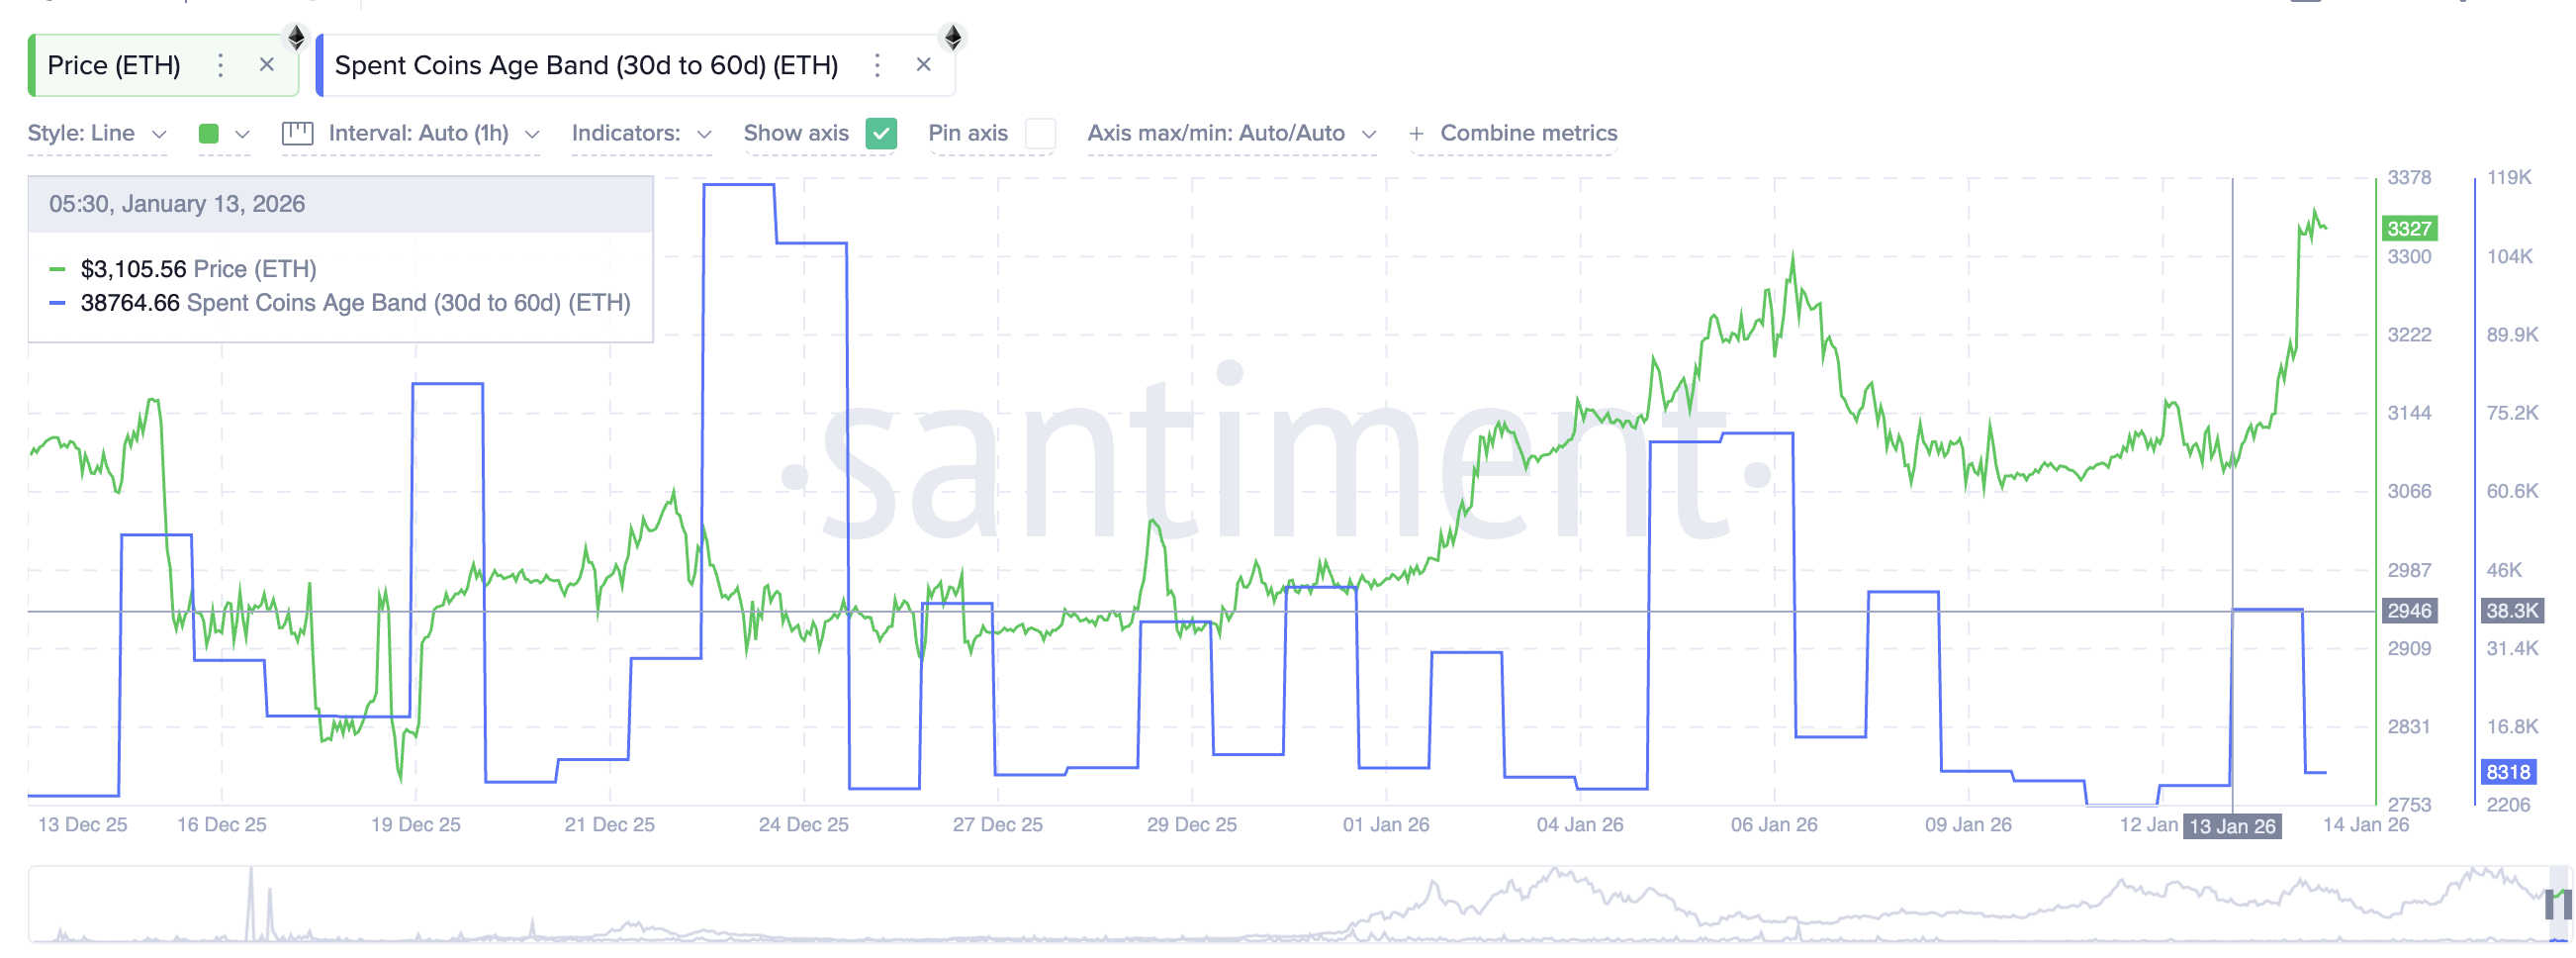 Coin Activity Drops Despite The Risk: Santiment
Even as NUPL rises, short-term holders are not actively distributing. That suggests profit exists, but conviction has not broken.
Ethereum Price Levels To Watch Now
With structure bullish and momentum risk conditional, Ethereum’s next move comes down to key price levels. Holding above the $3,250-$3,270 region keeps the breakout intact. A sustained move above $3,360-$3,380 would likely nullify the RSI divergence risk for a while and allow momentum to rebuild.
A clean close above this zone would strengthen the case for continuation toward $3,580, then $3,910, and eventually the psychological $4,000–$4,010 area.
 Ethereum Price Analysis: TradingView
If momentum risk takes over instead (with the next candle forming lower than $3,360), downside levels come into focus. Losing $3,250 would weaken the short-term structure. Below that, $3,180 and then $3,050 become relevant as potential support zones, especially if short-term holders begin acting on unrealized profits.
Ethereum does not need perfect conditions to move higher. It needs volume to hold, momentum risk to fade, and short-term holders to remain patient. If those conditions align, the $4,000 target stops being aspirational and starts becoming structural.
Recommended Articles


