Cardano Price Forecast: ADA bulls bet on rising DEX trading volume

Source Fxstreet
  • Cardano gains nearly 4% on Monday, extending the rally after a bullish RSI divergence.
  • Derivatives data signals a rise in bullish bets as traders increase their capital exposure in ADA futures.
  • On-chain data shows a steady rise in DEX trading volume on Cardano, indicating increased user demand.

Cardano (ADA) ticks higher by almost 4% at press time on Monday, approaching the $0.40 mark. Derivatives data suggests a risk-on sentiment among traders as ADA futures Open Interest and bullish bets surge. The technical outlook remains bullish, with ADA targeting an overhead resistance trendline amid a positive shift in momentum. 

Bullish bets rise on Cardano’s steady DEX volume

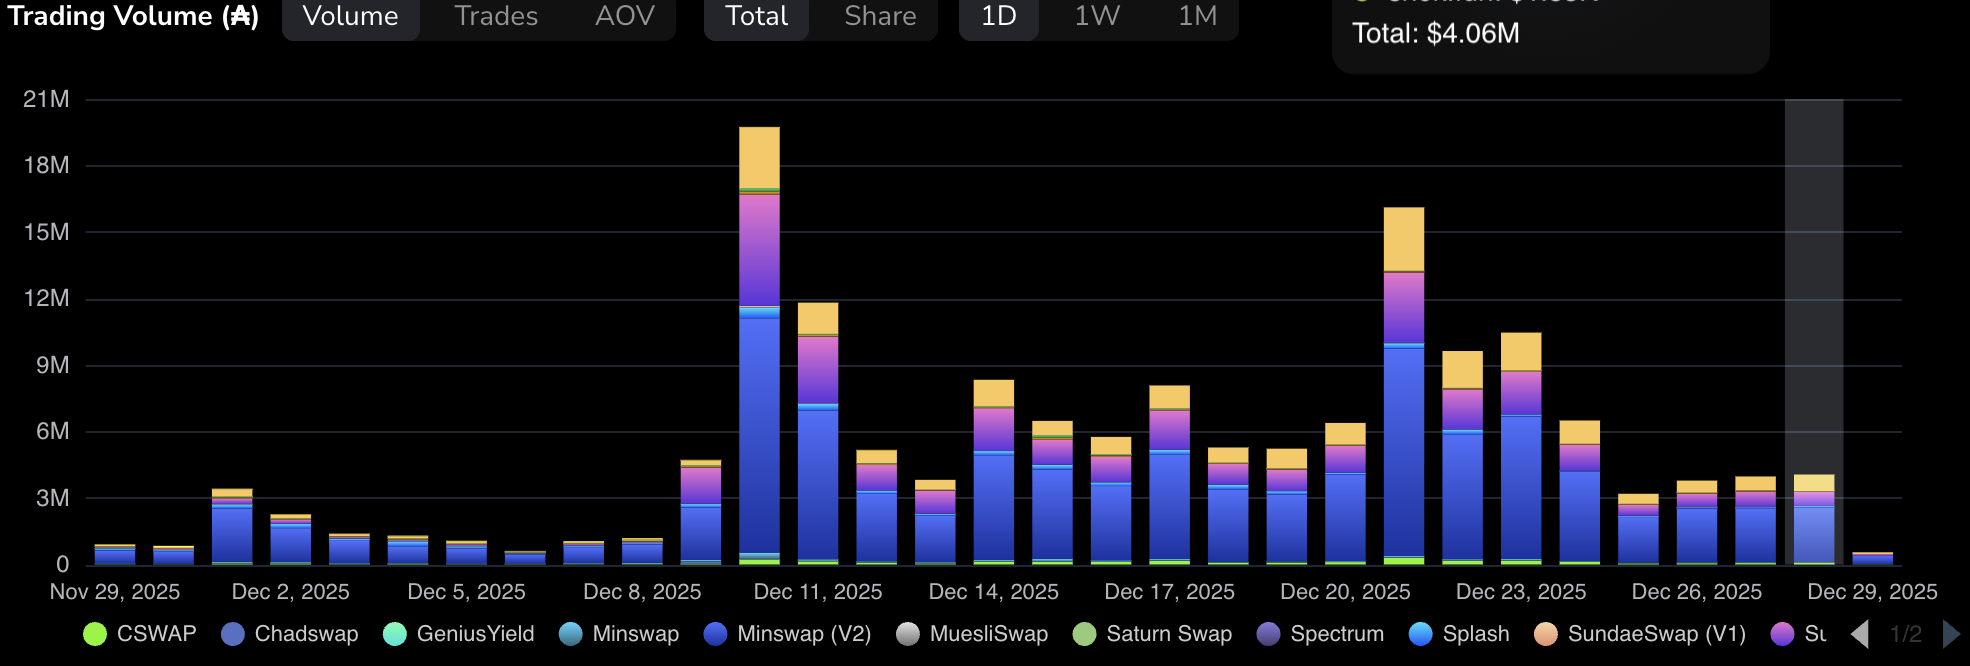
Taptools data shows a surge in trading volume on Cardano’s ecosystem, rising to $4.06 million on Sunday, from $3.19 million on Thursday. This indicates a recovery in user interest, which has held steady since the launch of Cardano’s privacy-focused sidechain, Midnight.

Cardano trading volume. Source: Taptools

On the derivatives side, CoinGlass data shows that the Cardano futures Open Interest (OI) is up 2.33% in the last 24 hours, reaching $729.41 million. This indicates a buildup in positions as traders increase their risk exposure.

Cardano derivatives. Source: CoinGlass

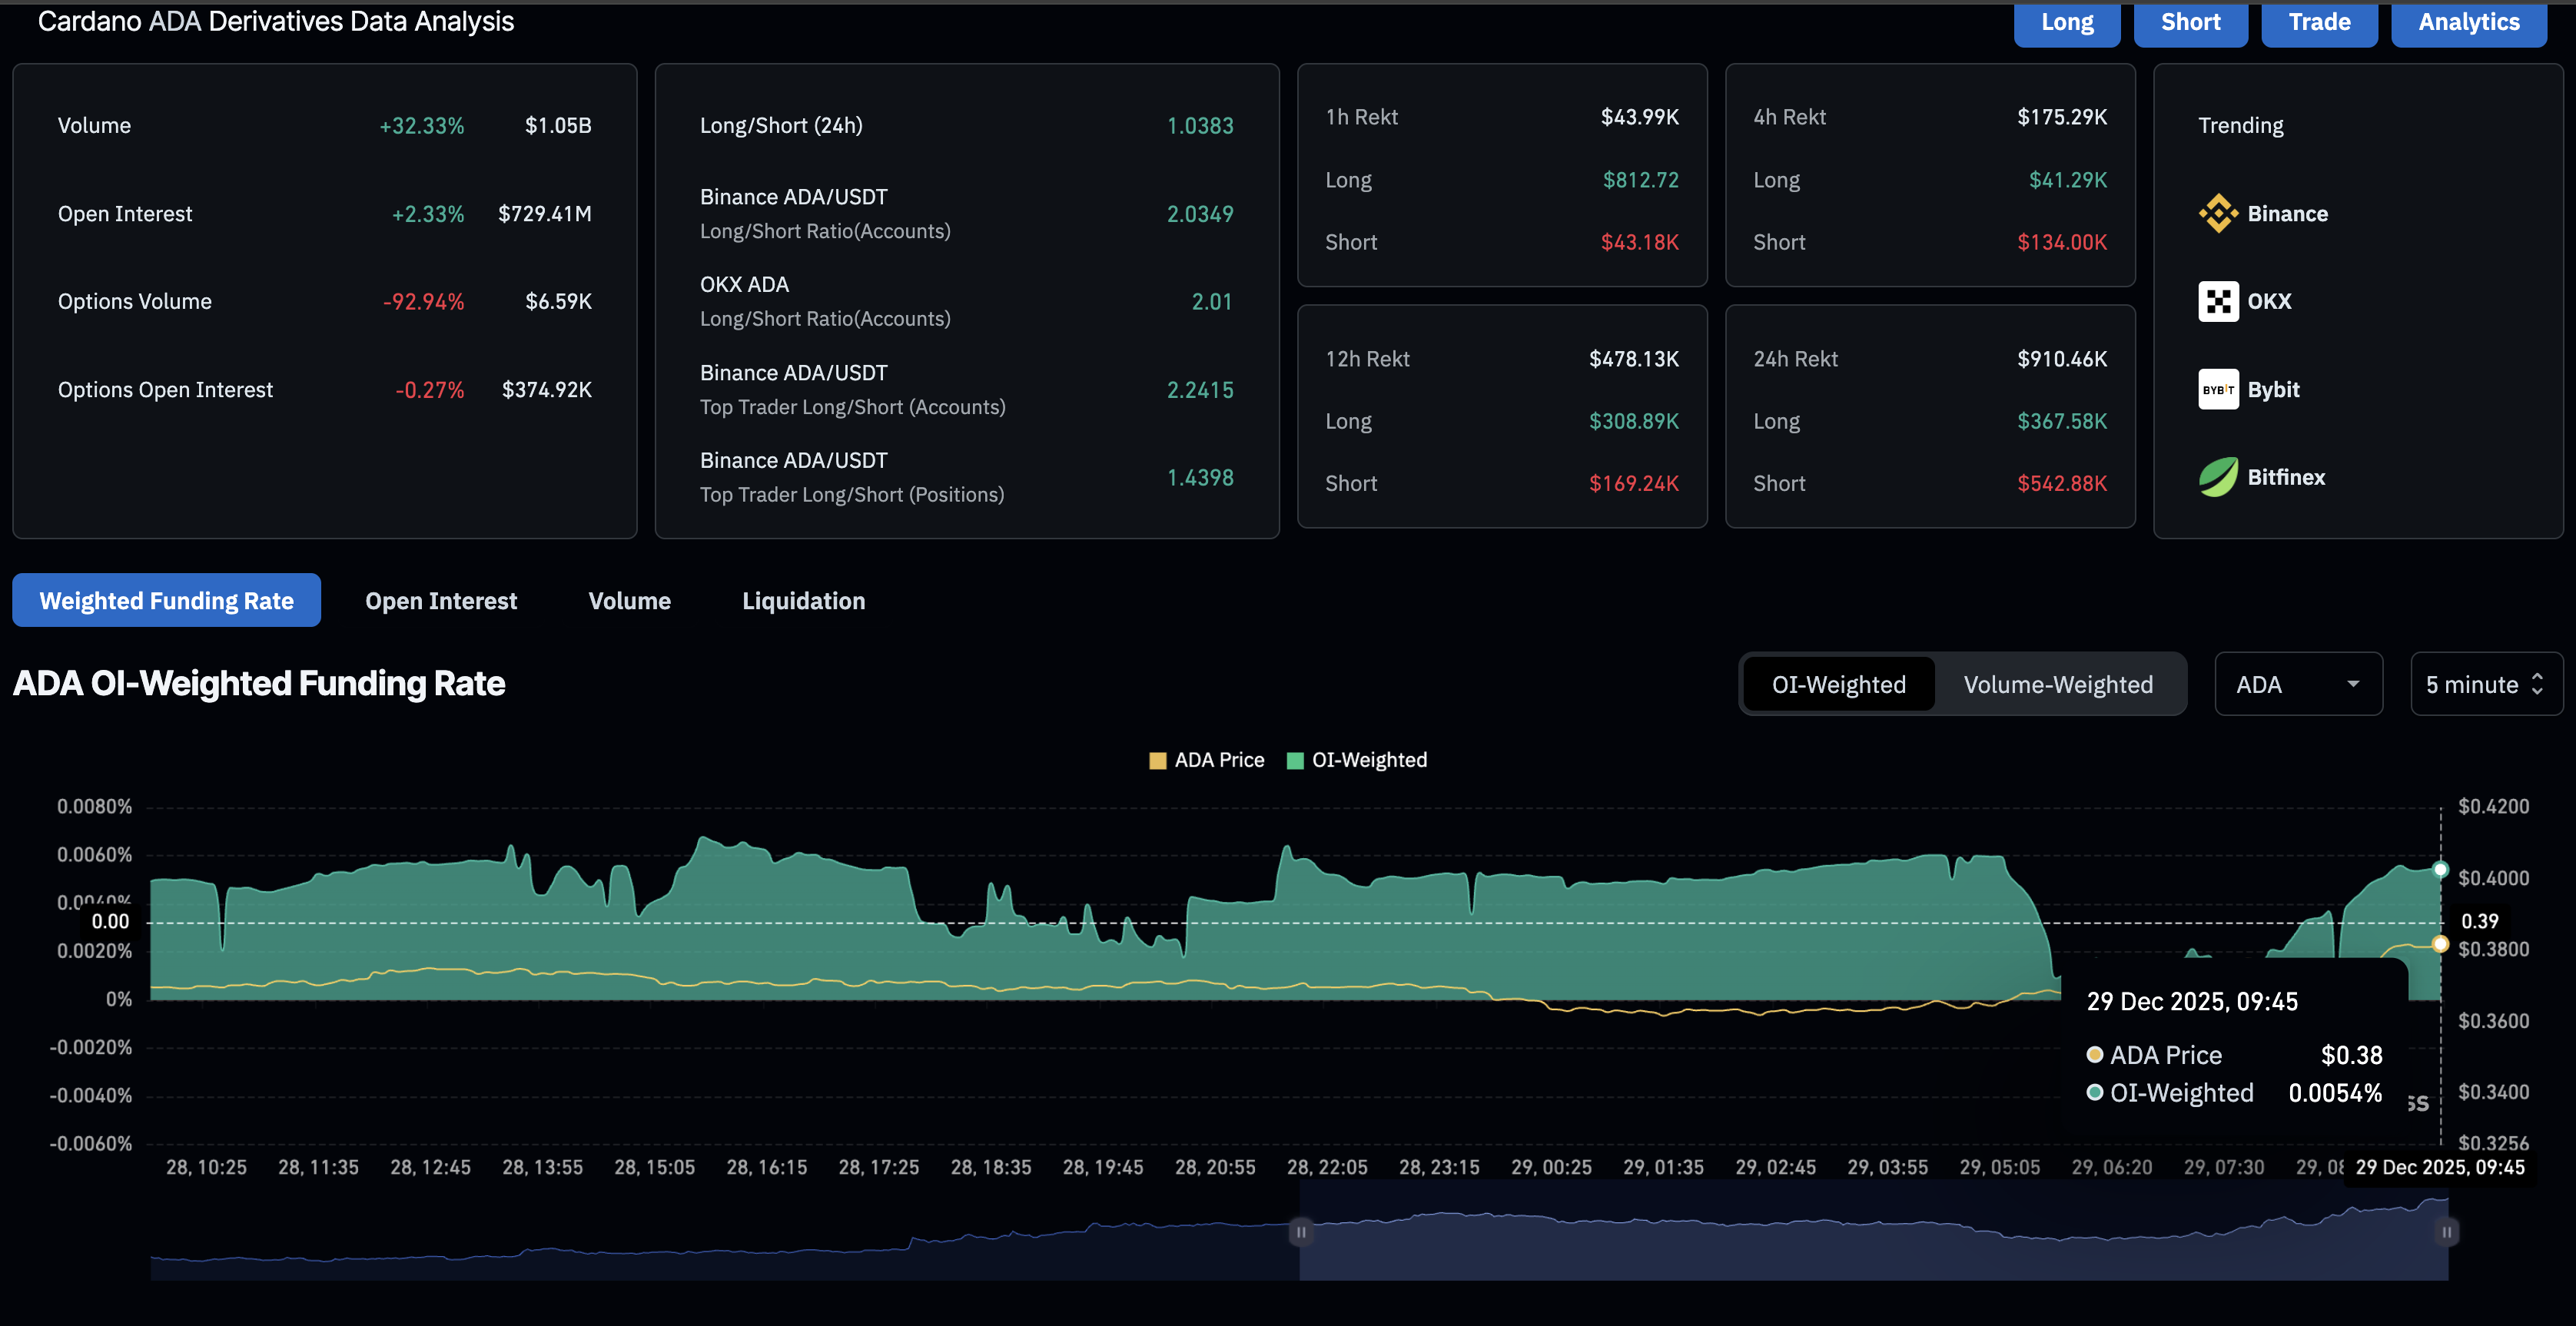
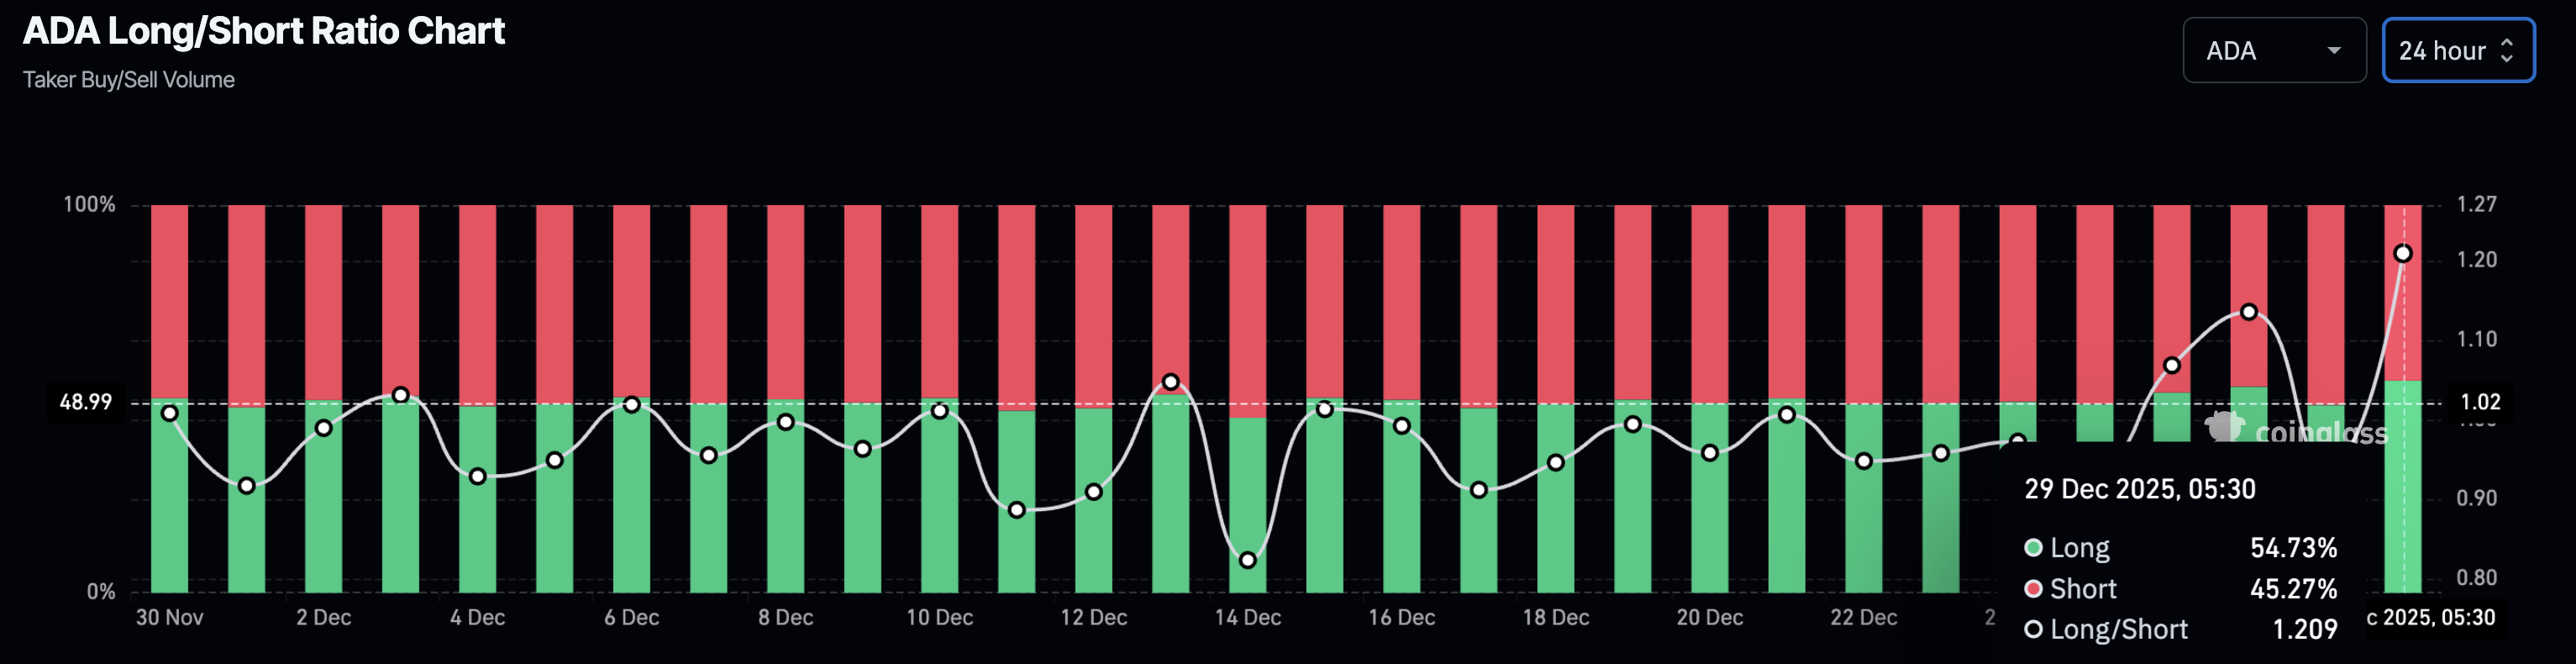
On a more positive note, the OI-weighted funding rate of 0.0054% reflects a bullish tilt in derivatives sentiment, as traders are paying a premium to hold long positions. Additionally, the long-to-short ratio indicates that long positions account for 54.73% on Monday, up from 48.42% on Sunday. A potential leverage-driven rally in Cardano could be seen as the long positional buildup strengthens.

Cardano long-to-short ratio chart.

Technical outlook: Will Cardano cross above $0.40?

Cardano edges higher by nearly 4% at press time on Monday, further extending the rebound from a bullish Relative Strength Index (RSI) divergence formed between December 18 and 25 lows. The recovery in ADA targets an overhead resistance trendline connecting the October 28 and December 9 highs, near $0.40, on the daily logarithmic chart.

If ADA successfully clears above $0.40, it could aim for the 50-day Exponential Moving Average (EMA) at $0.4379.

The technical indicators on the daily chart indicate a gradual shift to neutral and bullish momentum. The RSI is at 46, pointing upward toward the halfway line, as selling pressure wanes. Meanwhile, the Moving Average Convergence Divergence (MACD) steadies toward the zero line after crossing above the signal line on Saturday, indicating a rise in bullish momentum.

ADA/USDT daily logarithmic chart.

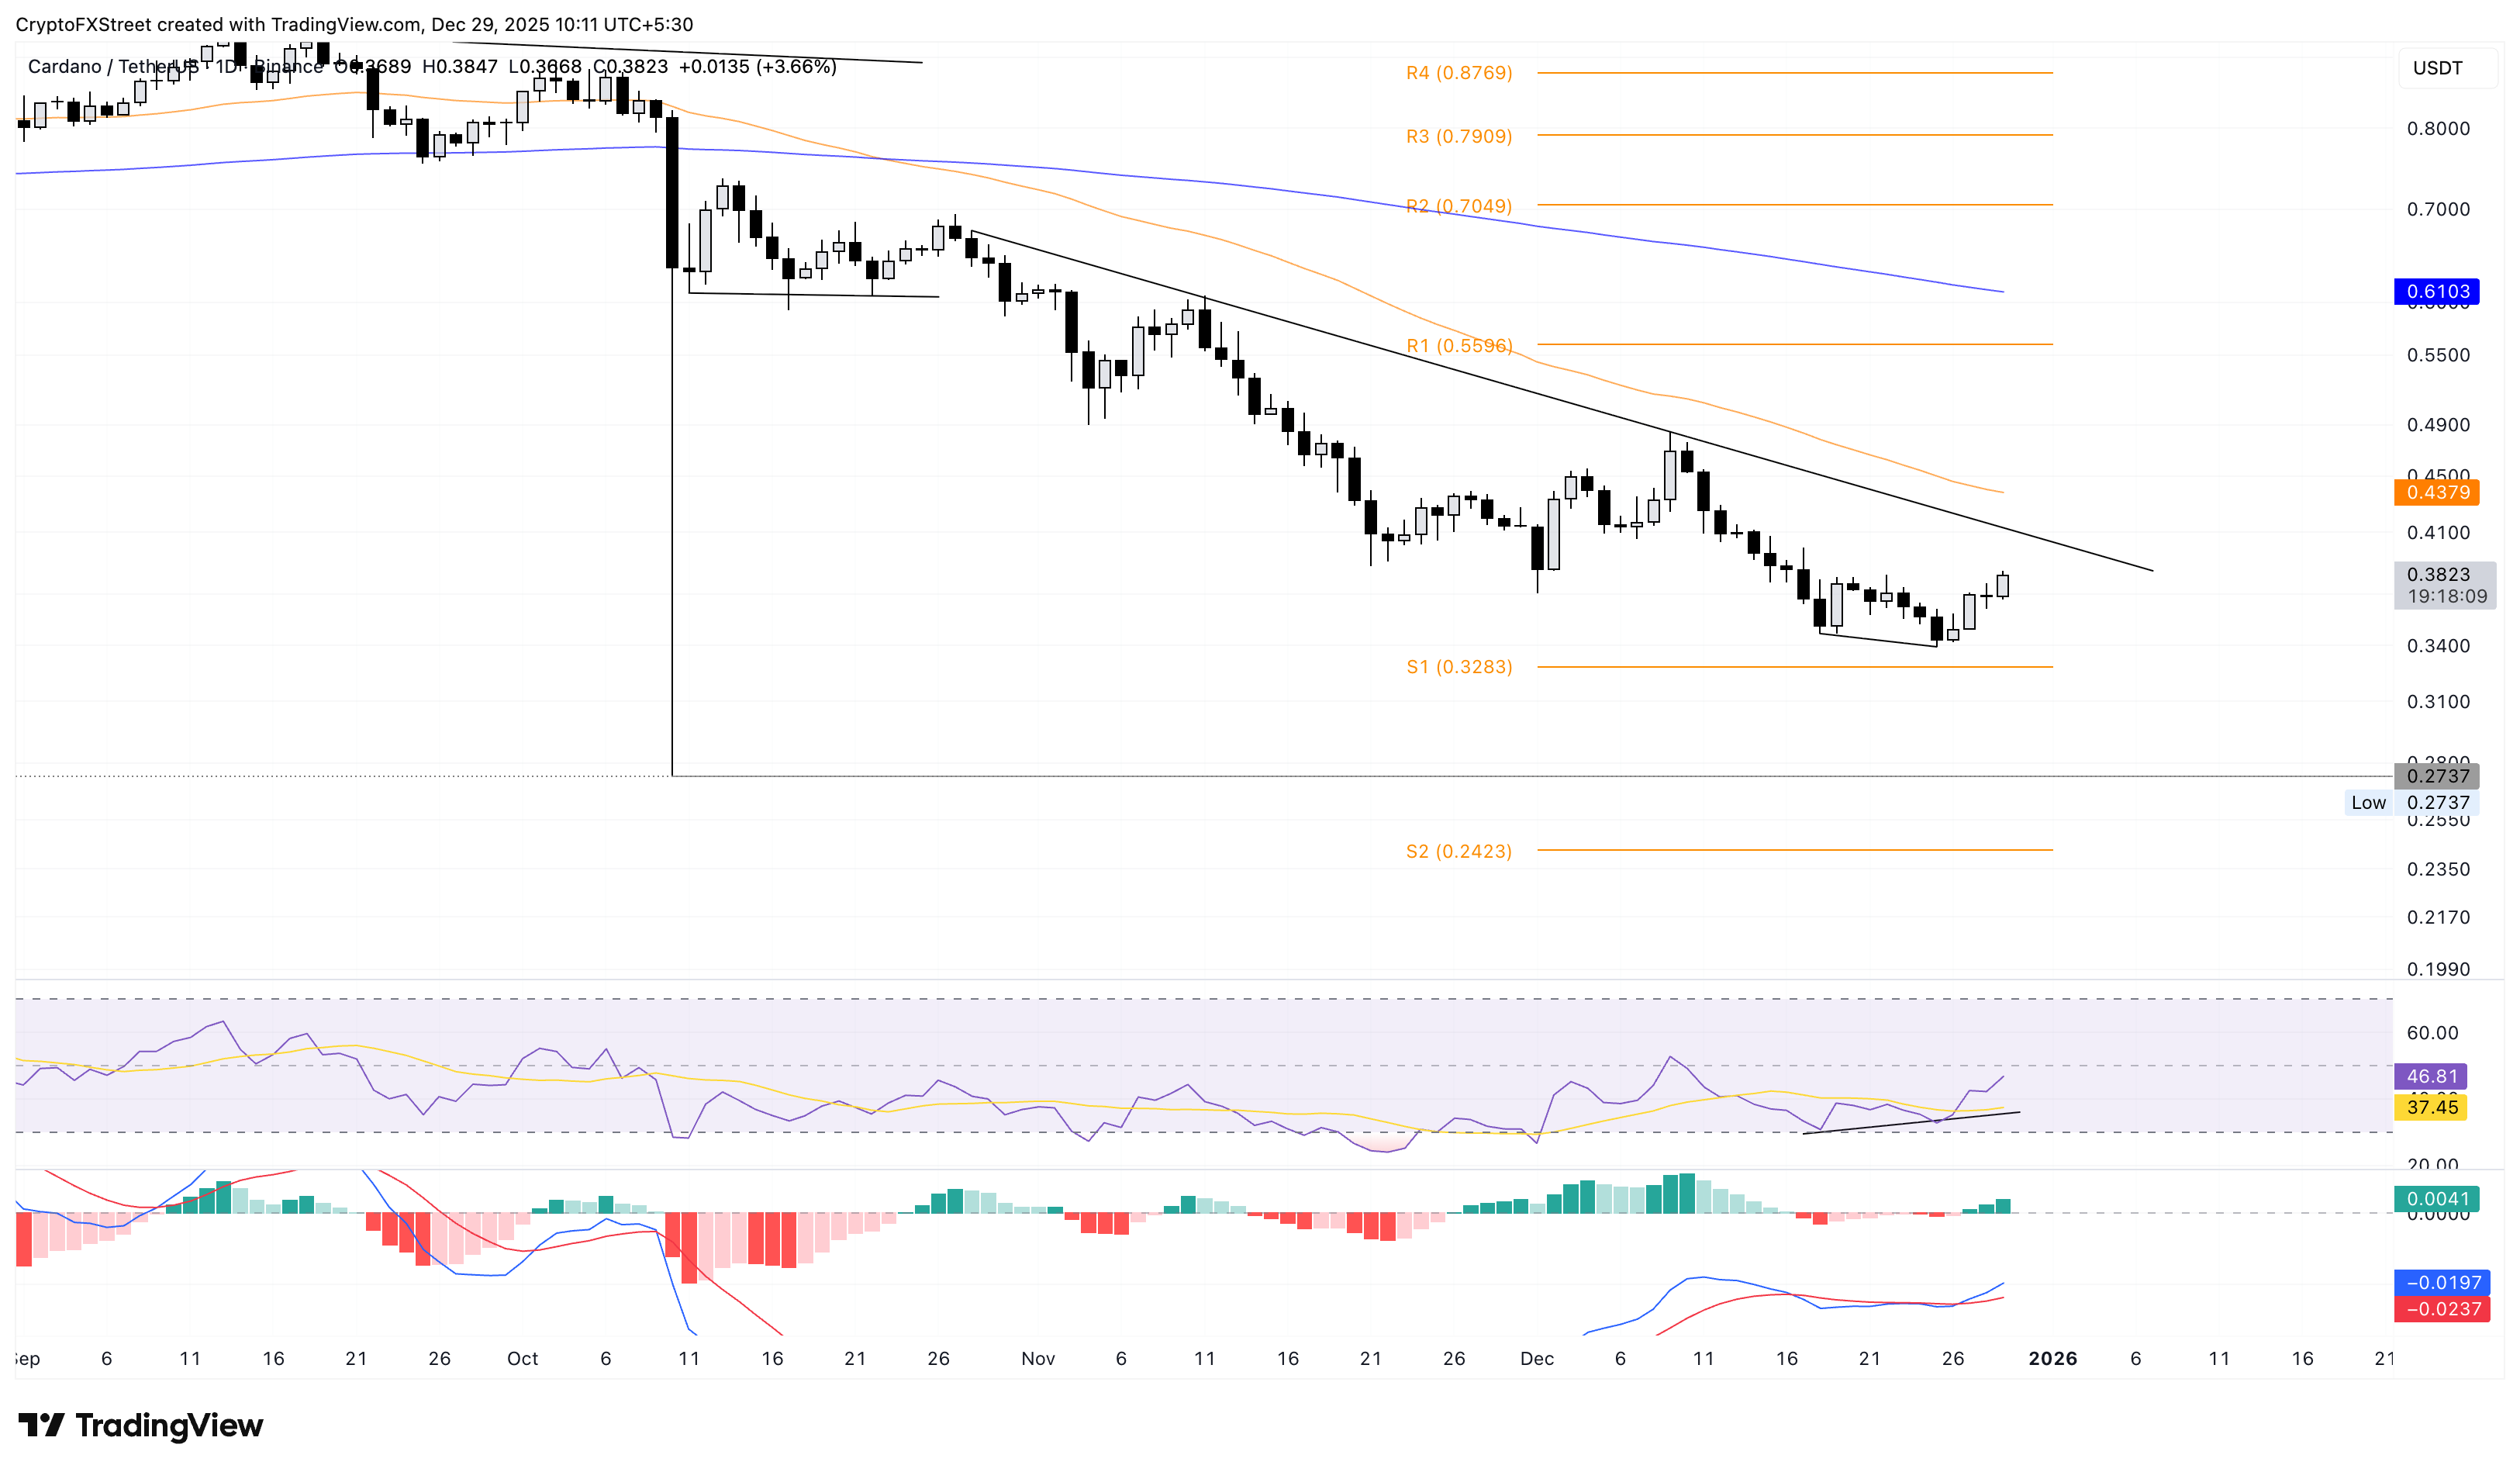
Looking down, if ADA reverses, the S1 Pivot Point at $0.3283 could serve as support. 

Disclaimer: For information purposes only. Past performance is not indicative of future results.
placeholder
How Is the Crypto Market Structure Bill Progressing? Advancing or Hindering the Future of Cryptocurrency?The crypto market structure bill has encountered opposition led by Coinbase and is currently stalled, but it is expected to eventually pass and propel the crypto market forward.According
Author  TradingKey
Jan 16, Fri
The crypto market structure bill has encountered opposition led by Coinbase and is currently stalled, but it is expected to eventually pass and propel the crypto market forward.According
placeholder
Bitcoin breaks above $97,000 as crypto kicks off first major rally of 2026Cryptocurrency markets are experiencing the first major rally of 2026. Bitcoin reached a high of over $97,000, and Ethereum edged close to $3,400 on Wednesday afternoon. Some analysts predict this is part of a larger bullish trend. Cryptocurrency markets appear to be coming out of hibernation as Bitcoin and key altcoins reach price levels not […]
Author  Cryptopolitan
Jan 16, Fri
Cryptocurrency markets are experiencing the first major rally of 2026. Bitcoin reached a high of over $97,000, and Ethereum edged close to $3,400 on Wednesday afternoon. Some analysts predict this is part of a larger bullish trend. Cryptocurrency markets appear to be coming out of hibernation as Bitcoin and key altcoins reach price levels not […]
placeholder
XRP ‘Super Cycle’ talk runs into a weekly SuperTrend sell signalXRP “super cycle” chatter faces a weekly SuperTrend sell signal, with XRP down 2% to $2.07 over the past week even as broader crypto markets tick higher.
Author  Mitrade
Jan 16, Fri
XRP “super cycle” chatter faces a weekly SuperTrend sell signal, with XRP down 2% to $2.07 over the past week even as broader crypto markets tick higher.
placeholder
Bitcoin Flashes Classic Bottom Signals as BTC Nears $101K ReclaimBitcoin nears two-month highs with key indicators signaling potential for further gains as it targets $101,000.
Author  Mitrade
Jan 16, Fri
Bitcoin nears two-month highs with key indicators signaling potential for further gains as it targets $101,000.
placeholder
AUD/USD holds ground near 0.6700 due to cautious RBA toneAUD/USD moves little after two days of gains, hovering around 0.6700 during the Asian hours on Friday. The pair steadies as the Australian Dollar (AUD) receives support amid cautious sentiment surrounding the Reserve Bank of Australia’s (RBA) policy outlook.
Author  FXStreet
Jan 16, Fri
AUD/USD moves little after two days of gains, hovering around 0.6700 during the Asian hours on Friday. The pair steadies as the Australian Dollar (AUD) receives support amid cautious sentiment surrounding the Reserve Bank of Australia’s (RBA) policy outlook.
Related Instrument
goTop
quote