

Pi Network Price Forecast: PI declines as core team offloads 2 million tokens
- Pi Network trades at $0.20, recording a 3% loss so far on Thursday.
- The Pi core team moved 2 million PI tokens from its liquidity reserve, which could add to the supply pressure.
- The technical outlook for PI remains bearish amid increasing selling pressure.
Pi Network (PI) edges lower by 3% at press time on Thursday, marking its fifth consecutive day of losses. A transfer of 2 million PI tokens from the liquidity reserve, part of the Pi core team wallets, bolsters the bearish sentiment. The technical outlook for PI targets the October 11 low at $0.1919 as the immediate support level.
Pi core team shifts 2 million tokens amid broader market sell-off
PiScan data shows an outflow of 2 million PI tokens from the Pi core team's liquidity reserve wallet. Typically, such transfers are a strategic distribution of supply for rewards or operations.
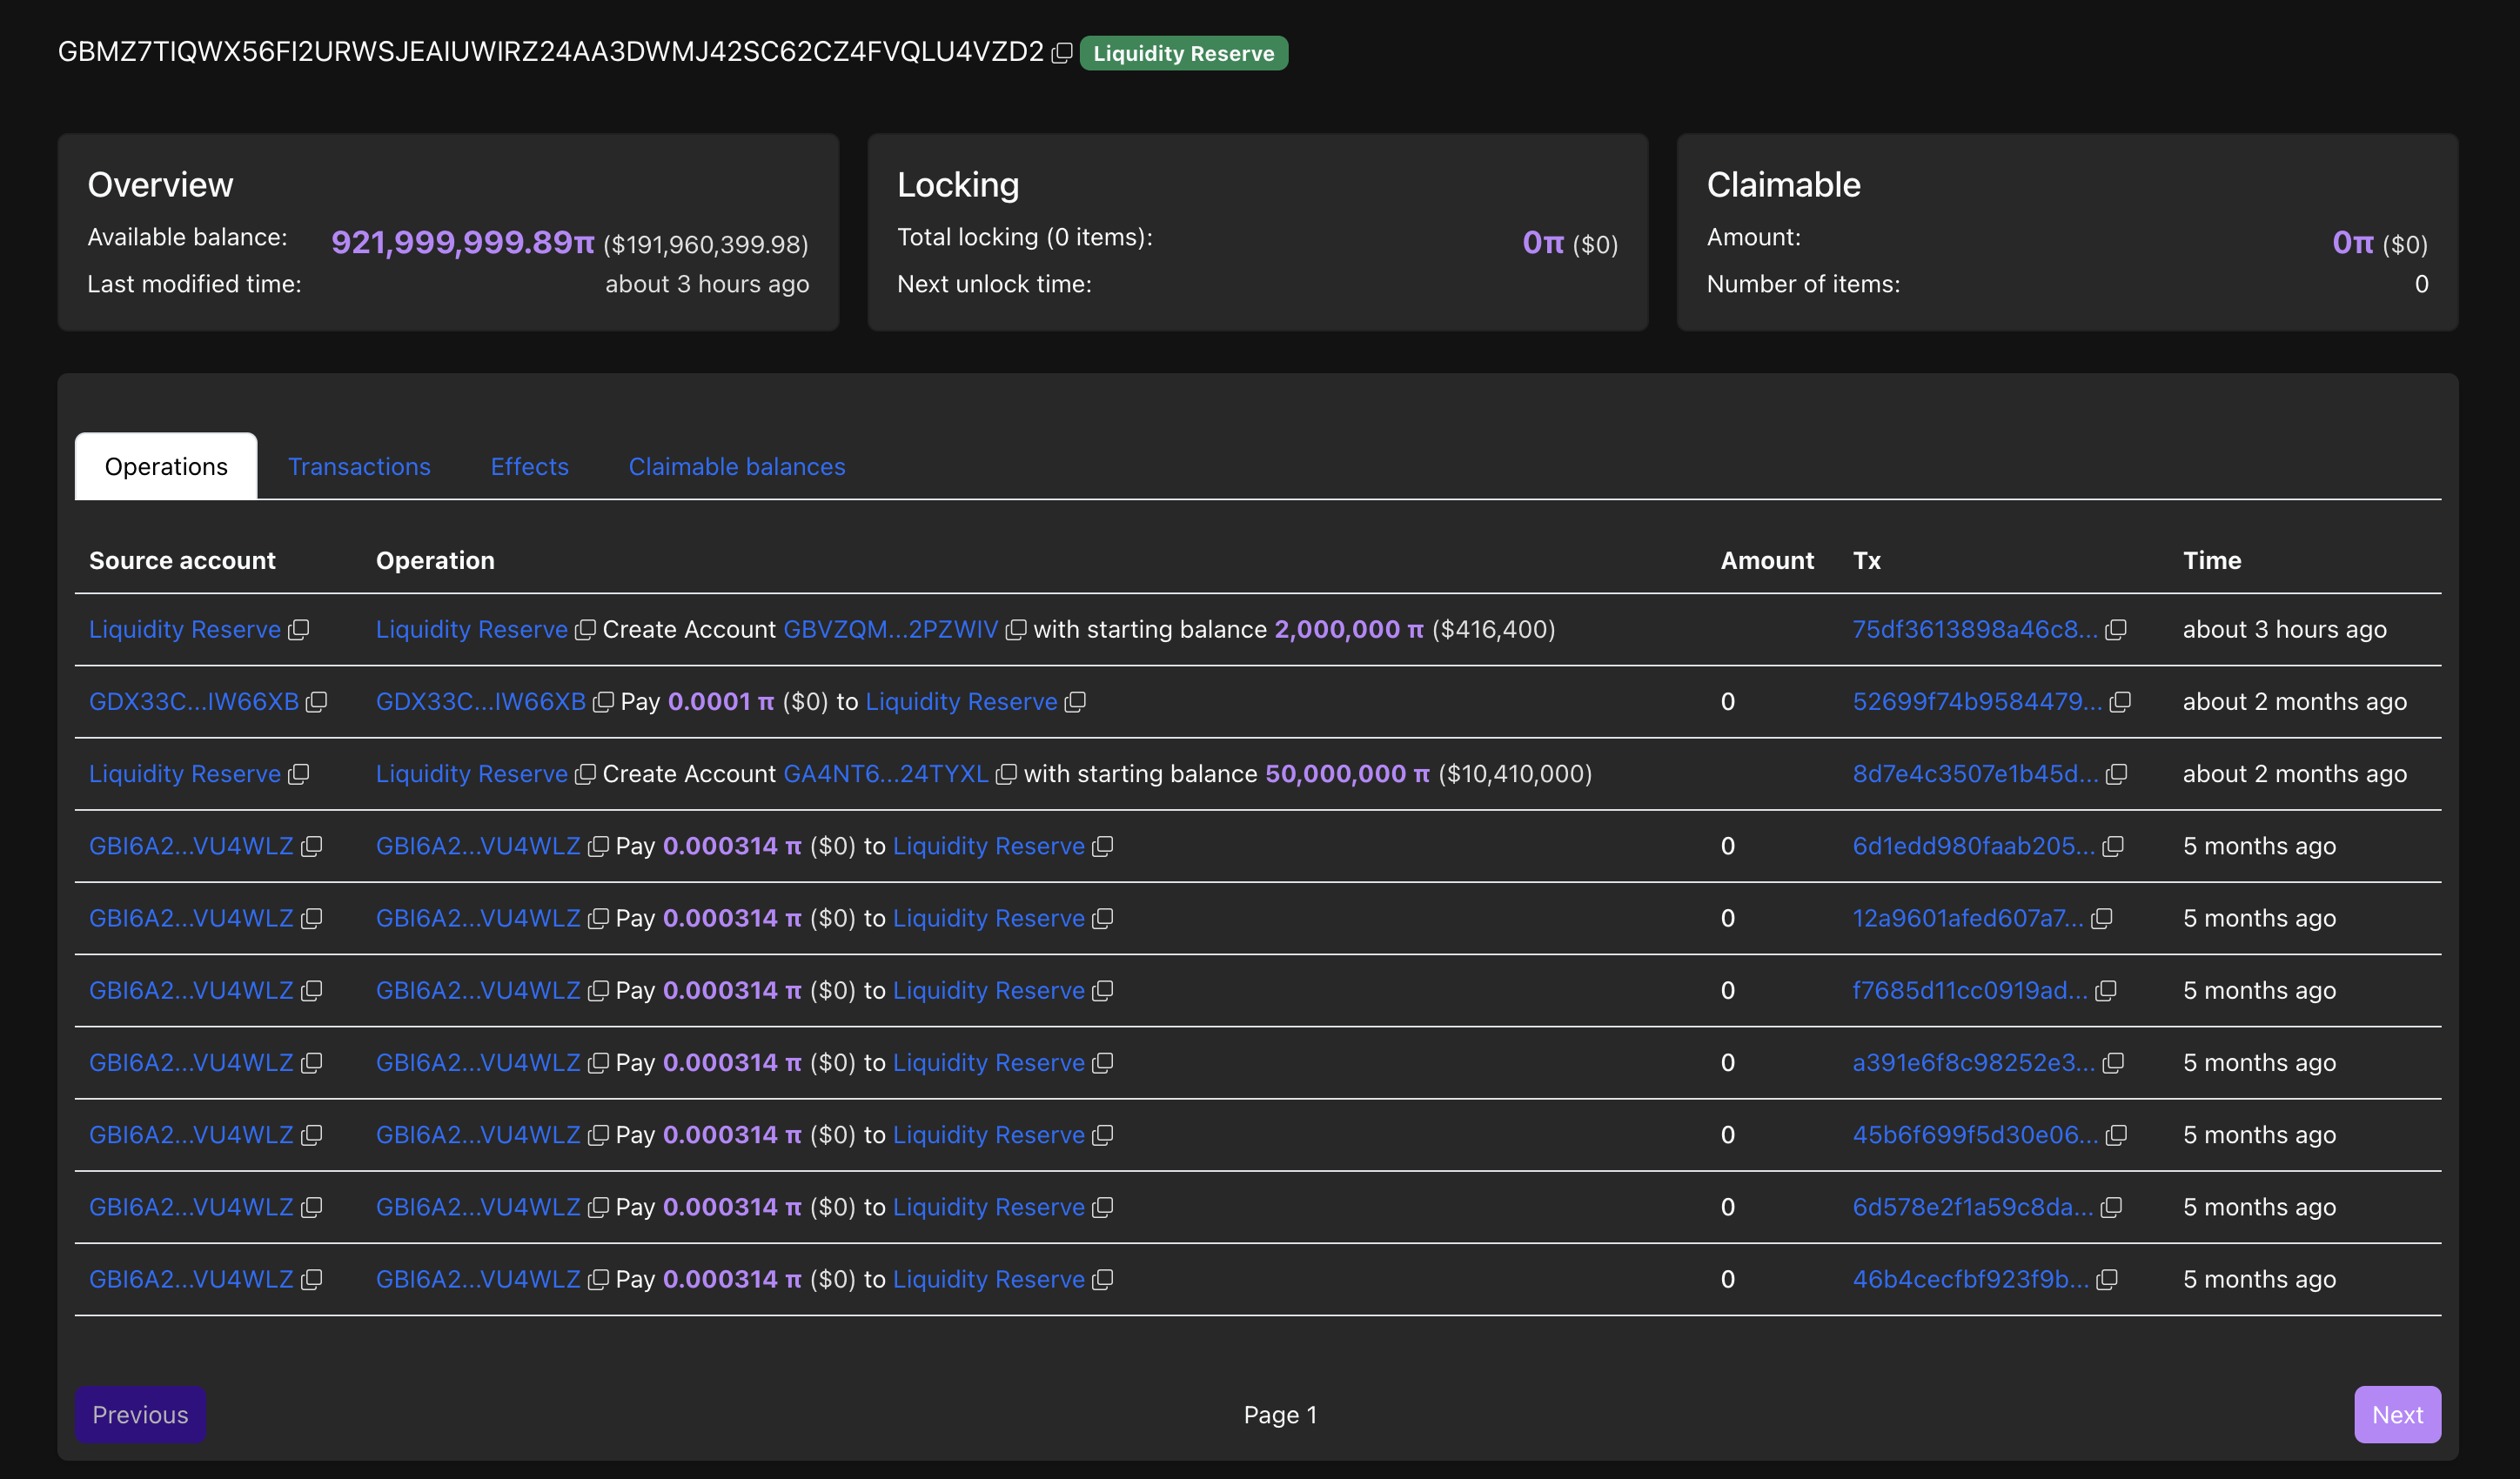
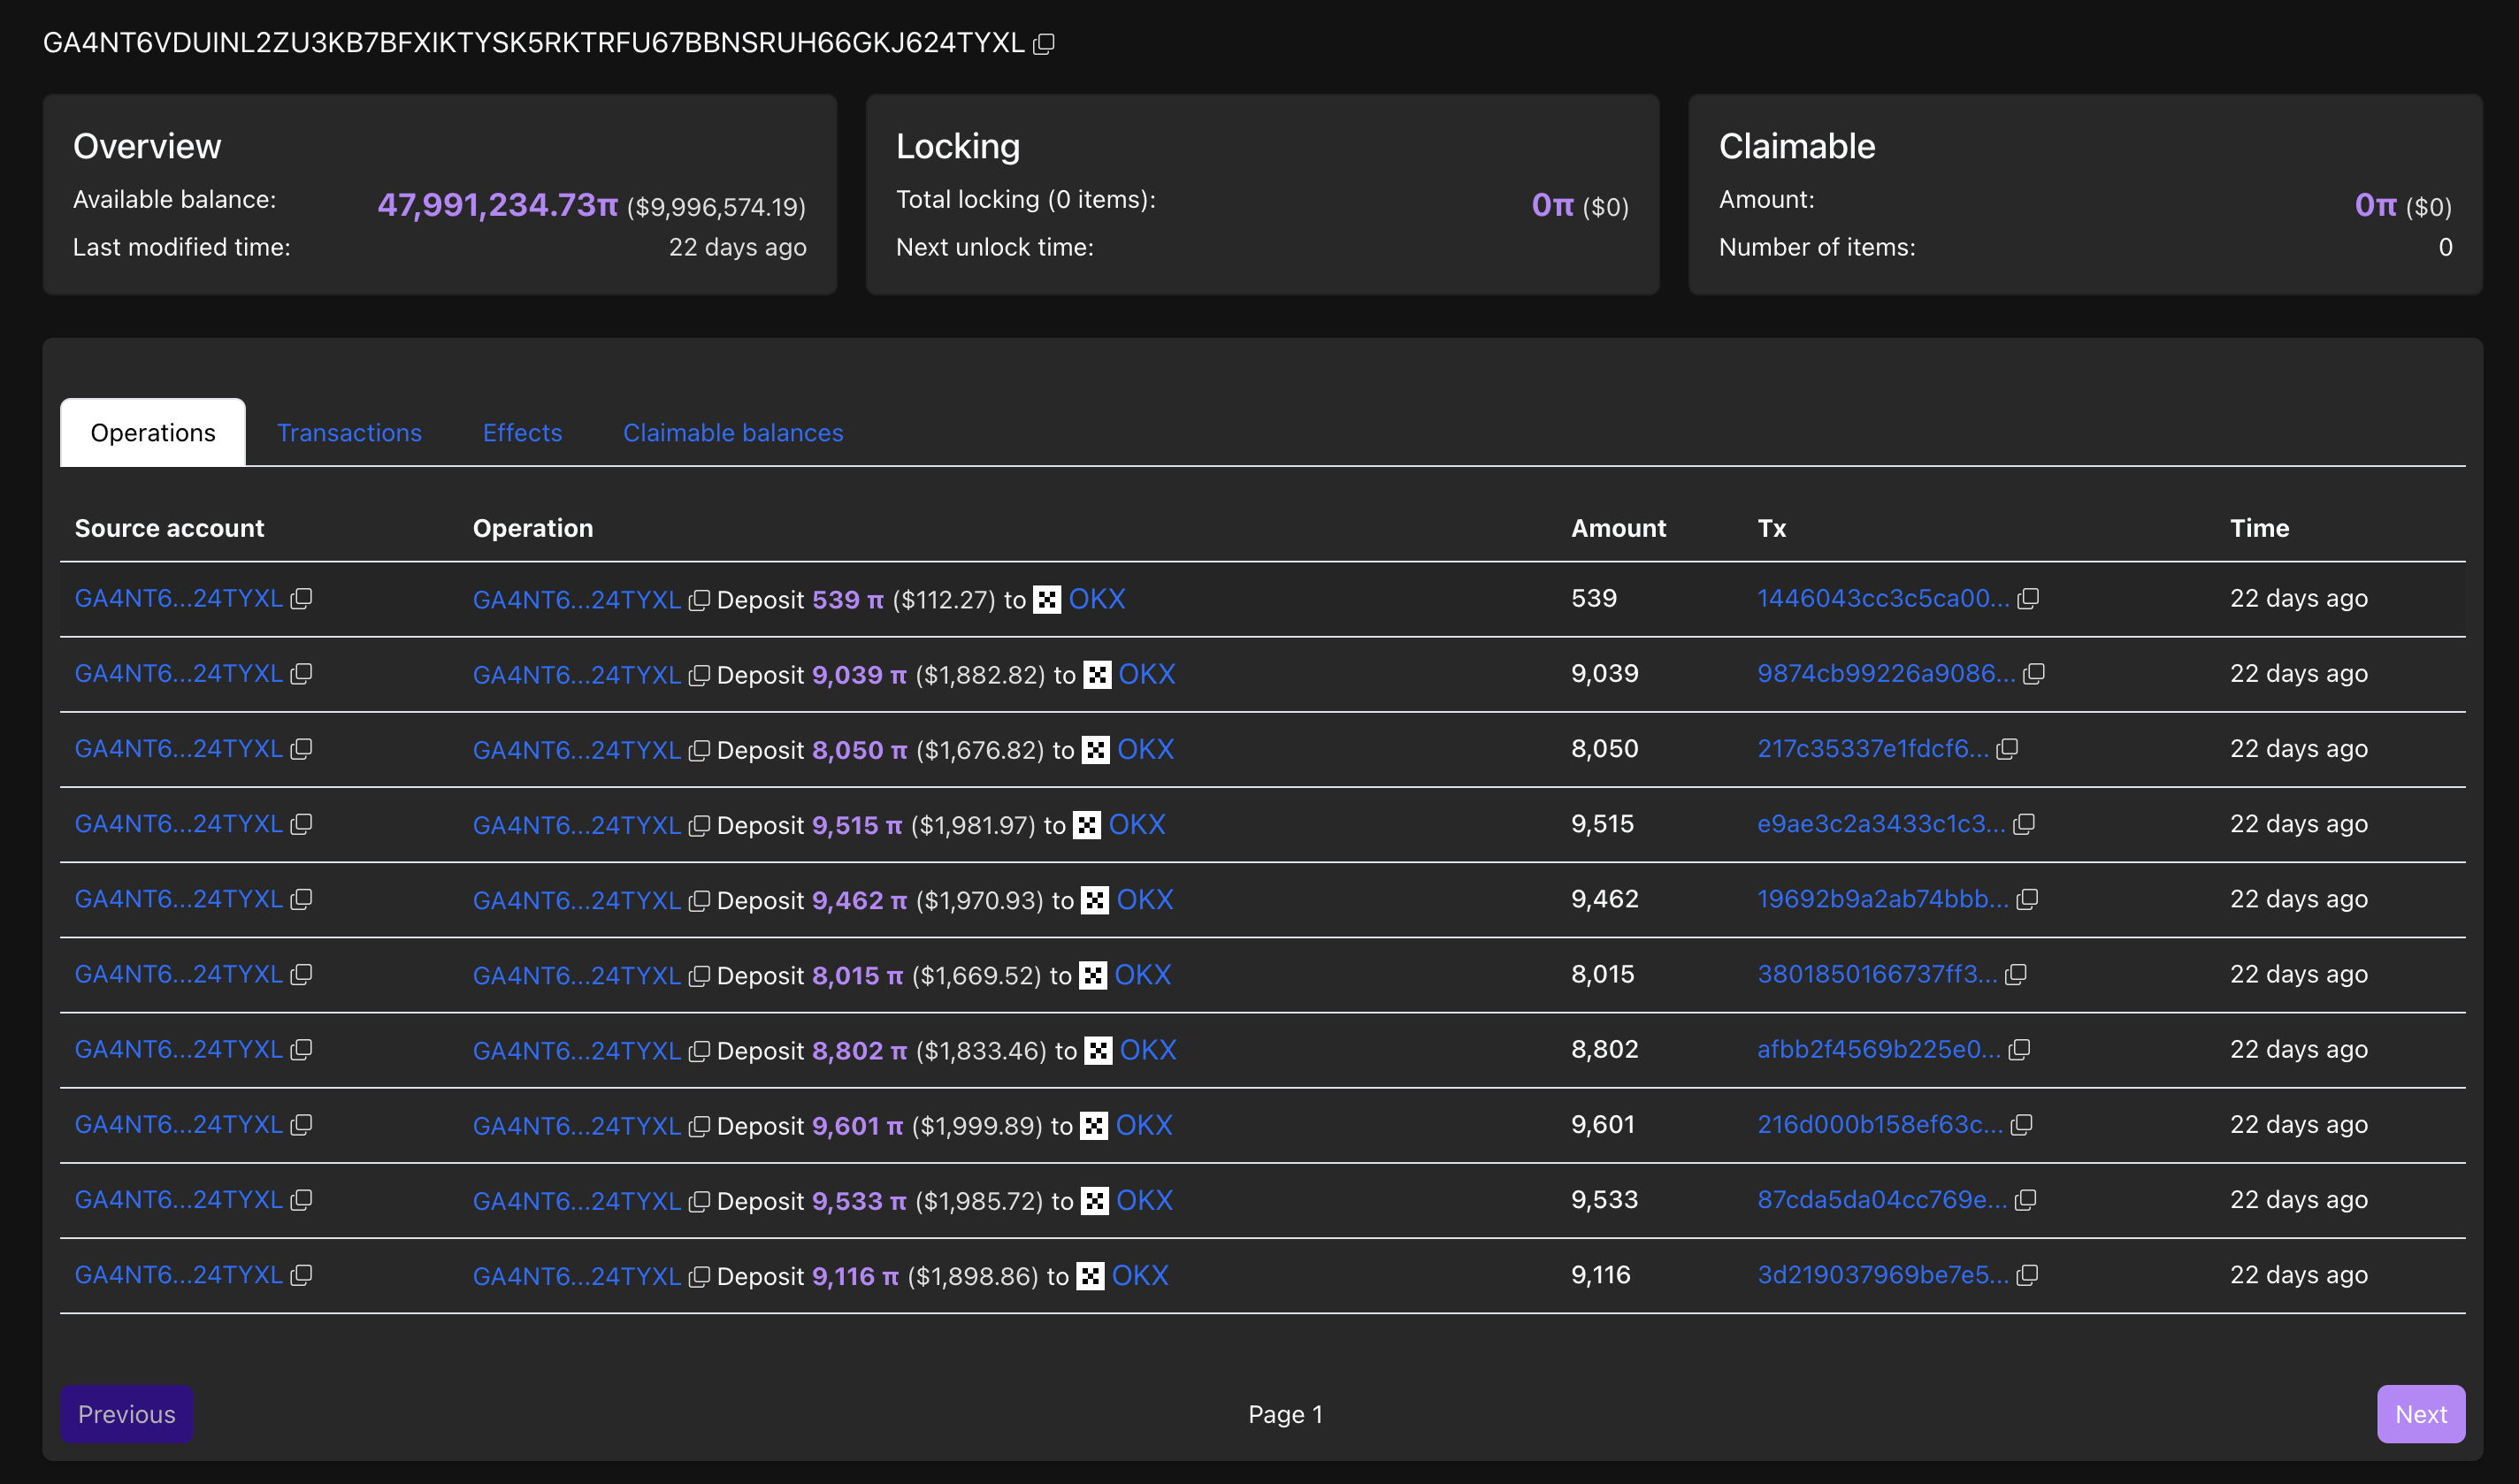
However, a similar transfer of 50 million Pi tokens to a different wallet two months ago saw multiple deposits to the OKX exchange, potentially linked to selling. As of Thursday, the wallet holds less than 48 million tokens after depositing over 3 million tokens to OKX.
With the core team likely consolidating its holdings, bearish sentiment surrounding Pi Network intensifies.
Technical Outlook: Pi Network’s decline eyes its record low as final support
Pi Network is down over 6% this week so far, extending the 7% loss from the previous one. The mobile mining cryptocurrency flashed a sell signal on Tuesday, crossing below the Supertrend indicator line near $0.2200.
Pi Network’s declining trend inches toward the October 11 low at $0.1919 as the immediate support. Below this, the October 10 low at $0.1533 would serve as the PI token's all-time low support.
On the same lines, the momentum indicators on the daily chart suggest a bearish bias. The Relative Strength Index (RSI) at 35 maintains a downward slope, approaching the oversold zone, indicating a steady rise in selling pressure.
At the same time, the Moving Average Convergence Divergence (MACD) crosses below the zero line with its signal line while the red histogram bars successively rise into the negative direction. This indicates that the bearish momentum is increasing.
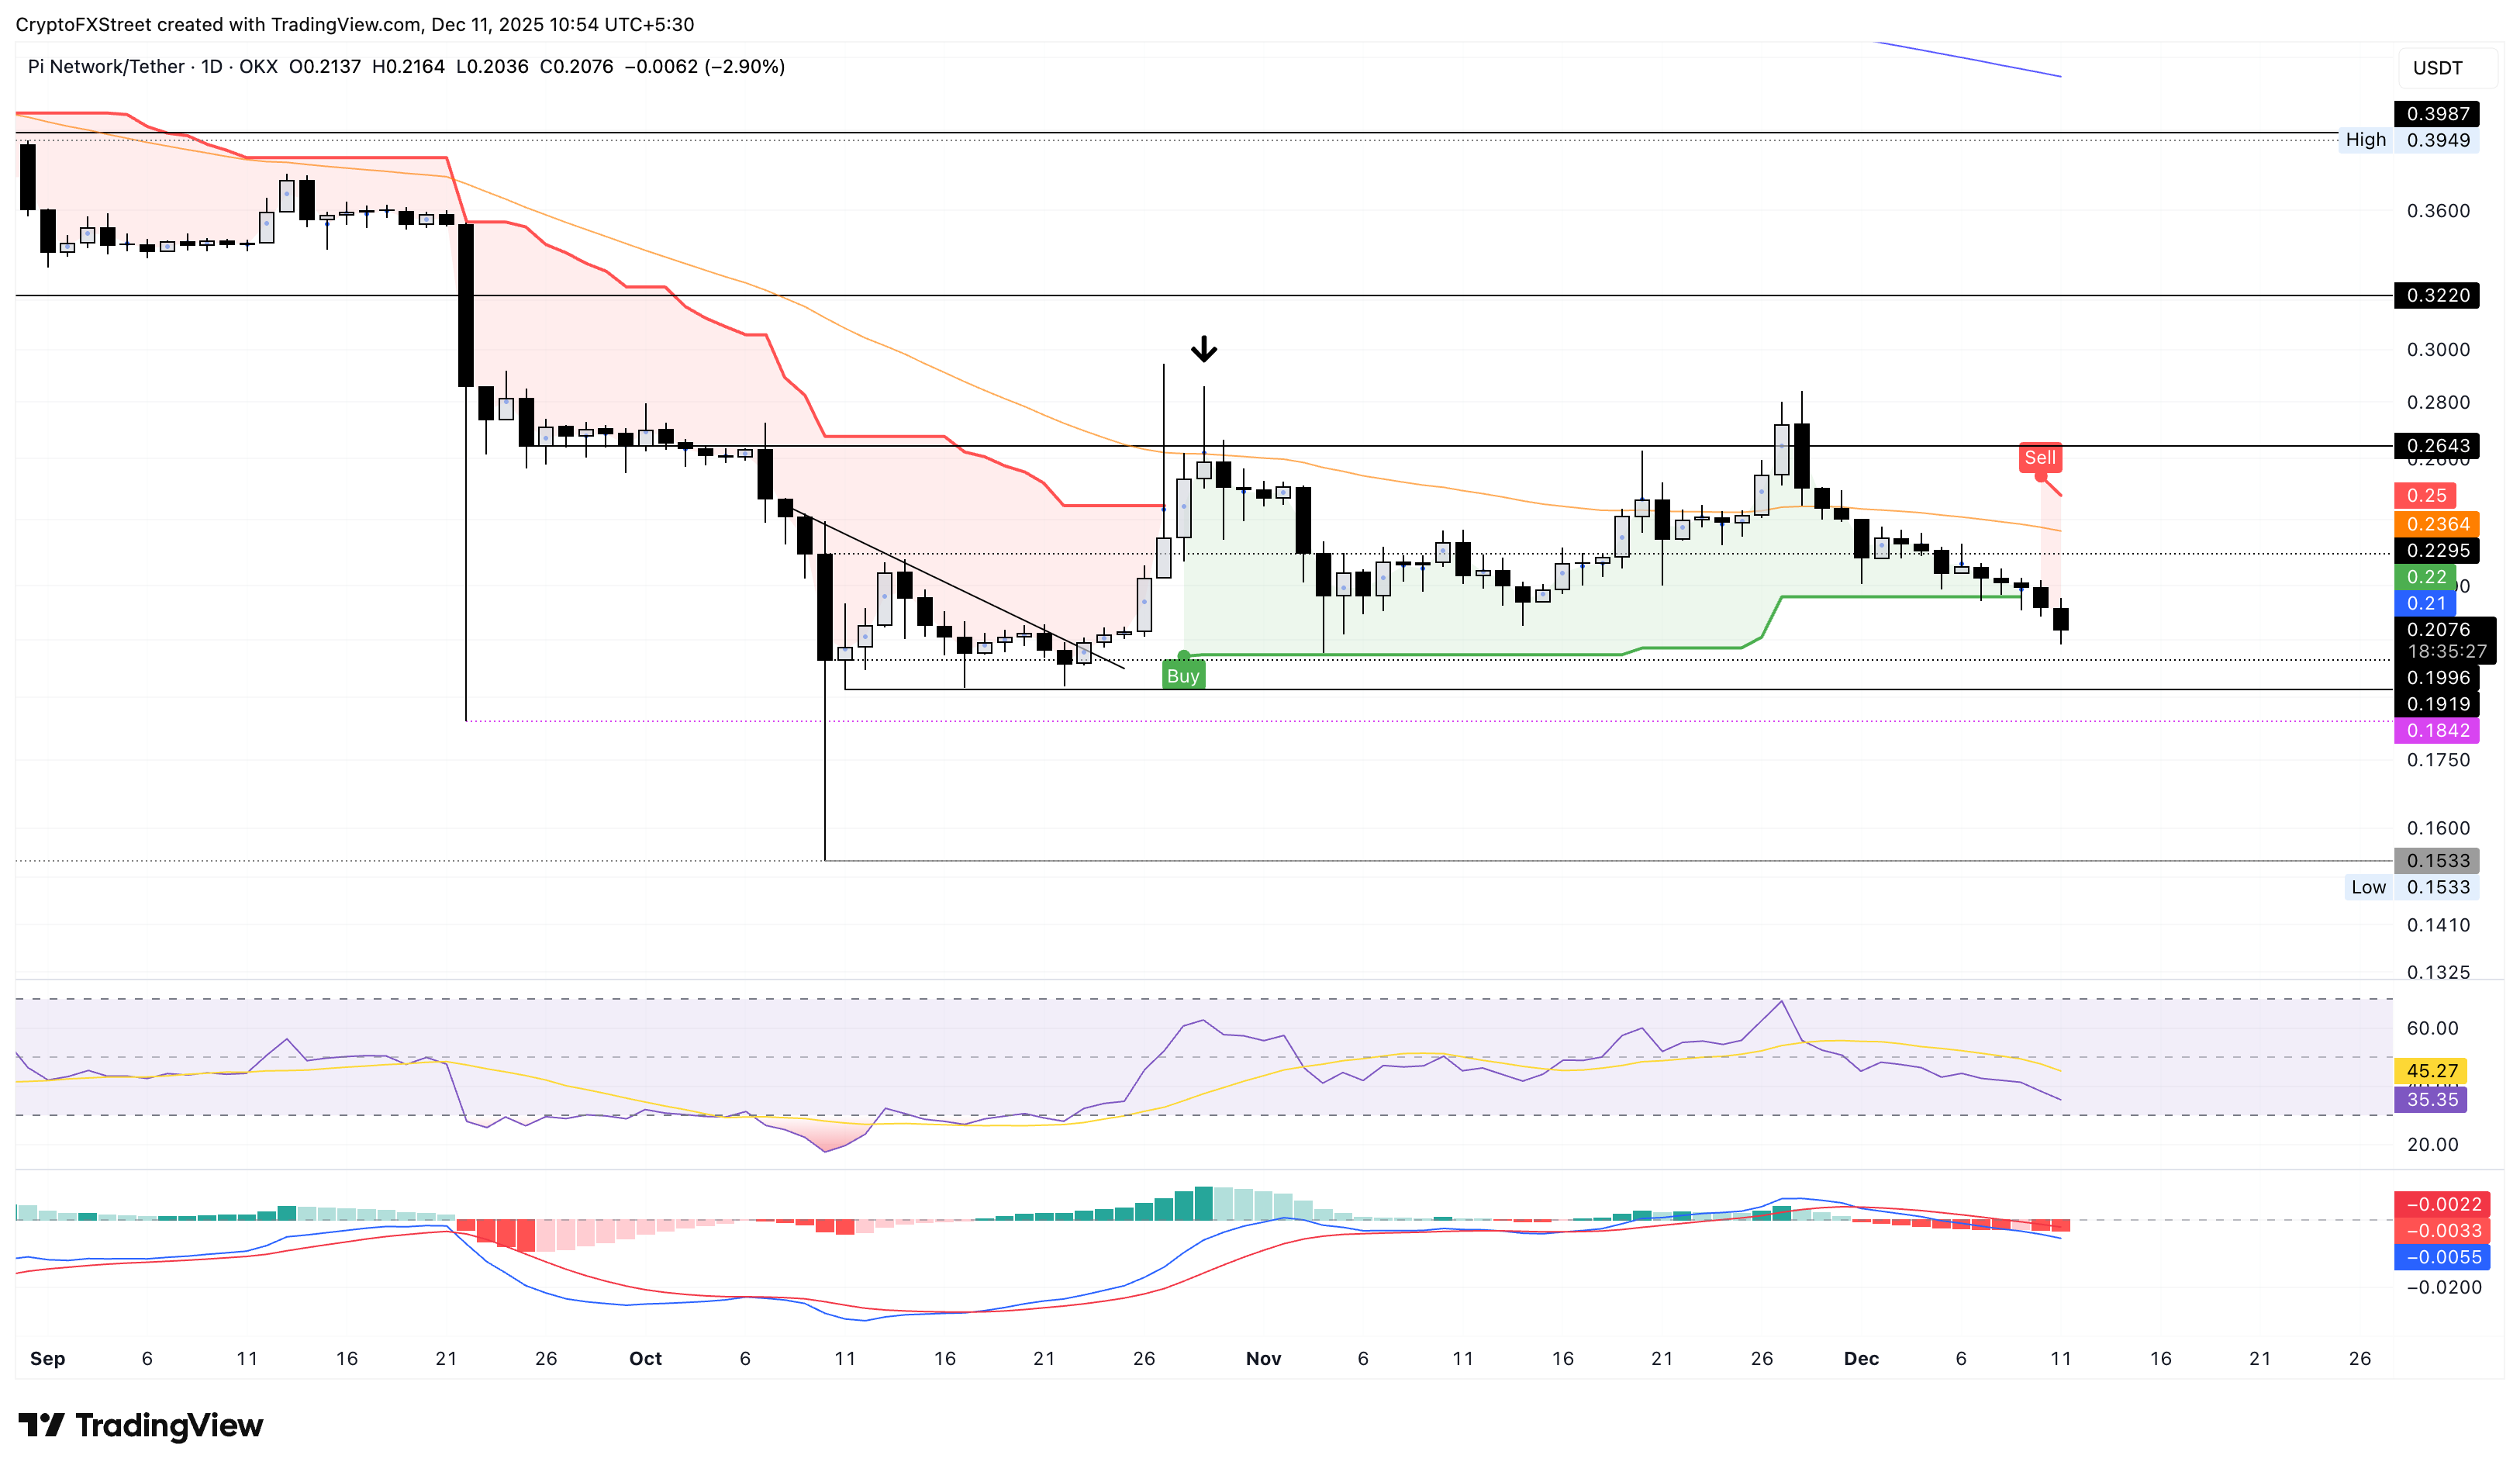
Looking up, a potential bounce back from $0.1919 could push PI to test the 50-day Exponential Moving Average at $0.2364. To reinforce a bullish trend, PI should cross above the Supertrend indicator line at $0.2500.
Bitcoin, altcoins, stablecoins FAQs
Bitcoin is the largest cryptocurrency by market capitalization, a virtual currency designed to serve as money. This form of payment cannot be controlled by any one person, group, or entity, which eliminates the need for third-party participation during financial transactions.
Altcoins are any cryptocurrency apart from Bitcoin, but some also regard Ethereum as a non-altcoin because it is from these two cryptocurrencies that forking happens. If this is true, then Litecoin is the first altcoin, forked from the Bitcoin protocol and, therefore, an “improved” version of it.
Stablecoins are cryptocurrencies designed to have a stable price, with their value backed by a reserve of the asset it represents. To achieve this, the value of any one stablecoin is pegged to a commodity or financial instrument, such as the US Dollar (USD), with its supply regulated by an algorithm or demand. The main goal of stablecoins is to provide an on/off-ramp for investors willing to trade and invest in cryptocurrencies. Stablecoins also allow investors to store value since cryptocurrencies, in general, are subject to volatility.
Bitcoin dominance is the ratio of Bitcoin's market capitalization to the total market capitalization of all cryptocurrencies combined. It provides a clear picture of Bitcoin’s interest among investors. A high BTC dominance typically happens before and during a bull run, in which investors resort to investing in relatively stable and high market capitalization cryptocurrency like Bitcoin. A drop in BTC dominance usually means that investors are moving their capital and/or profits to altcoins in a quest for higher returns, which usually triggers an explosion of altcoin rallies.
Recommended Articles


