

Bitcoin MVRV Hints Now Is A Good Time To Buy: Analyst
An analyst has explained how a pattern forming in the Bitcoin Market Value to Realized Value (MVRV) could suggest now may be the time to buy.
Bitcoin MVRV Momentum Could Reveal Buying Opportunity For BTC
As analyst Ali explained in a new post on X, the MVRV Momentum has been pointing out buying opportunities for the cryptocurrency since the current bull run started.
The MVRV ratio is a popular Bitcoin on-chain indicator that compares the asset’s market cap against its realized cap. The realized cap refers to a capitalization model for the asset that, in short, keeps track of the actual capital the holders as a whole have used to buy their coins.
As such, one way to look at the MVRV ratio is to compare the value the holders are carrying right now (that is, the market cap) with what they invested in the asset (the realized cap).
When the indicator’s value is greater than 1, the market cap is currently greater than the realized cap. Such a trend implies the average investor is holding profits. On the other hand, the metric being less than this threshold suggests the overall market can be assumed to be underwater.
Naturally, the MVRV ratio being exactly equal to 1 reflects the case where the investors hold as much as they put in. That is, they are just breaking even.
In the context of the current topic, the MVRV ratio itself isn’t of interest, but its comparison against its 90-day moving average (MA) is. The chart below shows the trend in the MVRV Momentum for Bitcoin.
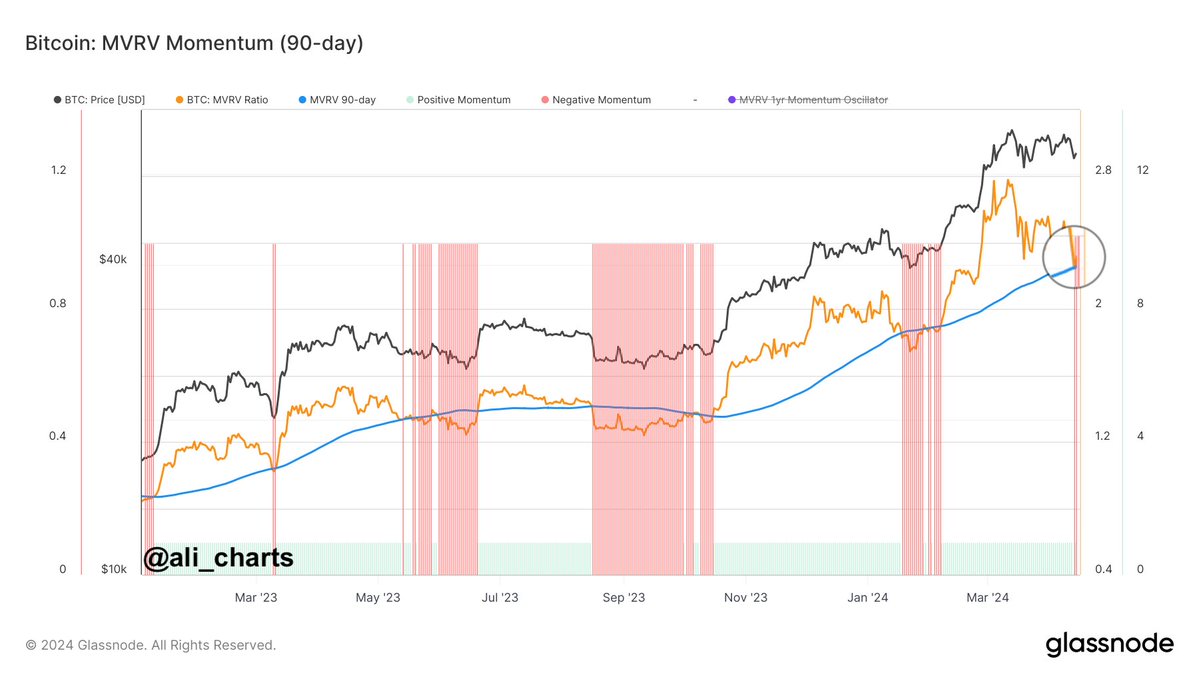
The graph shows that the Bitcoin MVRV ratio has declined recently. This decline is due to the cryptocurrency’s declining price.
With this latest drawdown, the metric has slipped under its 90-day MA, which means that the indicator has negative momentum behind it now. Since the start of this bull run a year and a half ago, the MVRV Momentum has similarly turned red on many occasions.
As the graph shows, the various local bottoms in the cryptocurrency in this window have generally coincided with the metric taking to these values. “When the MVRV dips below the 90-day average, it signals a buying opportunity,” notes the analyst.
Given this pattern, the fact that the Bitcoin MVRV Momentum satisfies this condition again may mean that now could be an ideal point of entry into the asset.
However, the MVRV ratio slipping under the mark doesn’t imply that the decline should end here. BTC has often continued to drop past this line, but the bottom has gotten closer whenever it has slipped under it.
BTC Price
At the time of writing, Bitcoin is trading at around $62,400, down over 11% in the past week.
Related Articles


