

Dow Jones Industrial Average gains on Monday ahead of midweek Fed showing
- Dow Jones climbs 0.4% as equities lean bullish to kick off the trading week.
- Tech Sector gains ground, Telecoms Services retreat.
- Fed rate call slated for Wednesday.
The Dow Jones Industrial Average (DJIA) is testing into the high side on Monday, with around two-thirds of listed securities on the major equity index finding the green as markets gear up for another Federal Reserve (Fed) rate call in the midweek. Another US Nonfarm Payrolls (NFP) Friday print looms ahead, and investors are tilting into the bullish side as markets continue to hinge focus on the possibility of rate cuts from the Fed.
The Fed’s latest rate meeting will begin on Tuesday and culminate in another rate call and press conference from Fed Chairman Jerome Powell on Wednesday. US Treasury yields are retreating and helping to bolster equities as investors lean into hopes of a softening stance from the US central bank. Rates are broadly expected to remain unchanged until September, with the CME’s FedWatch Tool showing rate markets expect around 58% odds a 25 basis point cut at the Fed’s September meeting. However, investors will be looking for signs of firming policy guidance from the Fed this week.
Read more: Fed Chair Powell to likely sound more cautious than usual – TD Securities
Friday’s NFP labor print will also provide key details for the state of the US economy in April. Markets currently expect Friday’s NFP to show 243K jobs additions for the month of April, down from March’s 303k print. March’s NFP jobs figure was the highest US employment gain since June of 2023.
Dow Jones news
Of the 30 securities that make up the Dow Jones, around a third of them were in the red on Monday, with Intel Corp. (INTC) leading the charge down, declining half a point to $31.45 per share, falling around 1.4%. INTC was closely followed by Microsoft Corp (MSFT), which fell five points to $401.24 per share, declining 1.25%. Boeing Co. (BA) shares climbed nearly six points to $172.93 per share, rising 3.4% with Apple Inc. (AAPL) close behind, rising around 3% to trade into $174.20 per share.
Dow Jones technical outlook
The Dow Jones remains tepid on Monday, climbing to a slim high of 38,401.03 before retreating back into the 38,300.00 region with the day’s bottom bids priced in near 38,267.55. Bullish momentum remains limited but determined as the DJIA grapples with the 200-hour Exponential Moving Average (EMA) at 38,297.23.
The Dow Jones is down around 4% from the last swing high just shy of the 40,000.00 major handle, bit the index is still trading safely into bull country, bidding north of the 200-day EMA at 36,725.68. The key long-run moving average has been provided a technical price floor for the Dow Jones since the index rose from last November’s bottoms near 32,800.00.
DJIA five-minute chart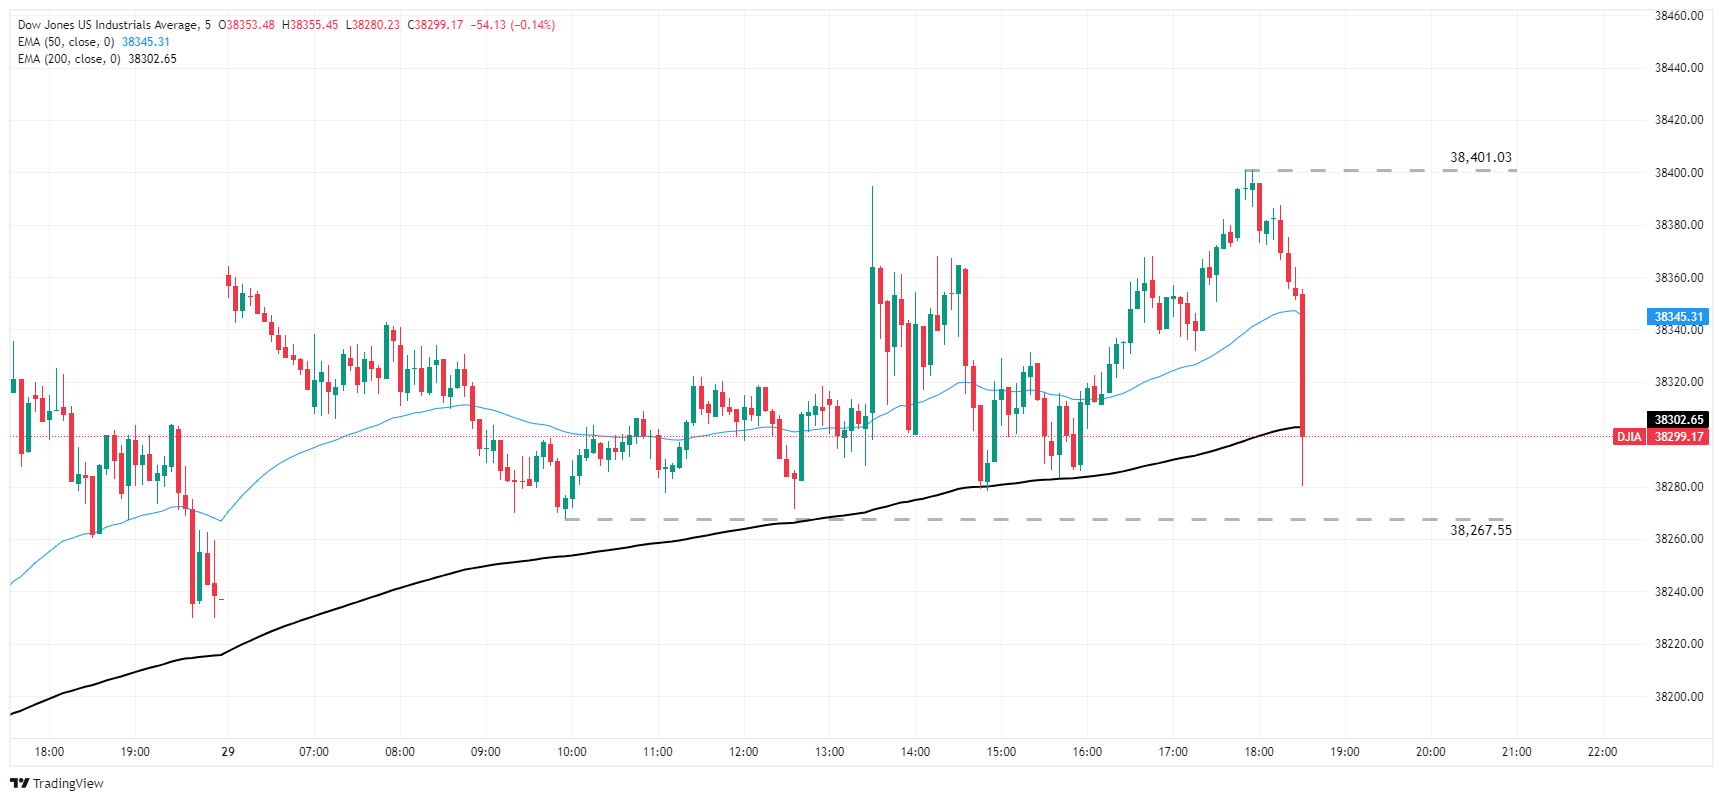
DJIA daily chart
Dow Jones FAQs
The Dow Jones Industrial Average, one of the oldest stock market indices in the world, is compiled of the 30 most traded stocks in the US. The index is price-weighted rather than weighted by capitalization. It is calculated by summing the prices of the constituent stocks and dividing them by a factor, currently 0.152. The index was founded by Charles Dow, who also founded the Wall Street Journal. In later years it has been criticized for not being broadly representative enough because it only tracks 30 conglomerates, unlike broader indices such as the S&P 500.
Many different factors drive the Dow Jones Industrial Average (DJIA). The aggregate performance of the component companies revealed in quarterly company earnings reports is the main one. US and global macroeconomic data also contributes as it impacts on investor sentiment. The level of interest rates, set by the Federal Reserve (Fed), also influences the DJIA as it affects the cost of credit, on which many corporations are heavily reliant. Therefore, inflation can be a major driver as well as other metrics which impact the Fed decisions.
Dow Theory is a method for identifying the primary trend of the stock market developed by Charles Dow. A key step is to compare the direction of the Dow Jones Industrial Average (DJIA) and the Dow Jones Transportation Average (DJTA) and only follow trends where both are moving in the same direction. Volume is a confirmatory criteria. The theory uses elements of peak and trough analysis. Dow’s theory posits three trend phases: accumulation, when smart money starts buying or selling; public participation, when the wider public joins in; and distribution, when the smart money exits.
There are a number of ways to trade the DJIA. One is to use ETFs which allow investors to trade the DJIA as a single security, rather than having to buy shares in all 30 constituent companies. A leading example is the SPDR Dow Jones Industrial Average ETF (DIA). DJIA futures contracts enable traders to speculate on the future value of the index and Options provide the right, but not the obligation, to buy or sell the index at a predetermined price in the future. Mutual funds enable investors to buy a share of a diversified portfolio of DJIA stocks thus providing exposure to the overall index.
Recommended Articles


