

Silver Price Analysis: XAG/USD dips amid strong US Dollar, warmer inflation

- Iranian military drones targeted US Fifth Fleet in Bahrain in response to southern US strikes
- Gold Price Trend Forecast: US-Iran Peace Talks Drive Gold Rebound, Is the Gold Slump Over?
- WTI hovers around $80.00 as traders await developments on US-Iran peace talks
- Gold rises to weekly high as US, Iran reach peace deal
- SpaceX Listing Imminent. Funds Flood Into SpaceX On-Chain Tokens, Bitcoin Rebound Momentum May Be Weakened
- Has Gold Hit Bottom? Barclays, Citi Both Bullish on Gold, Gold Price Will Return to $5,000 Next Year.

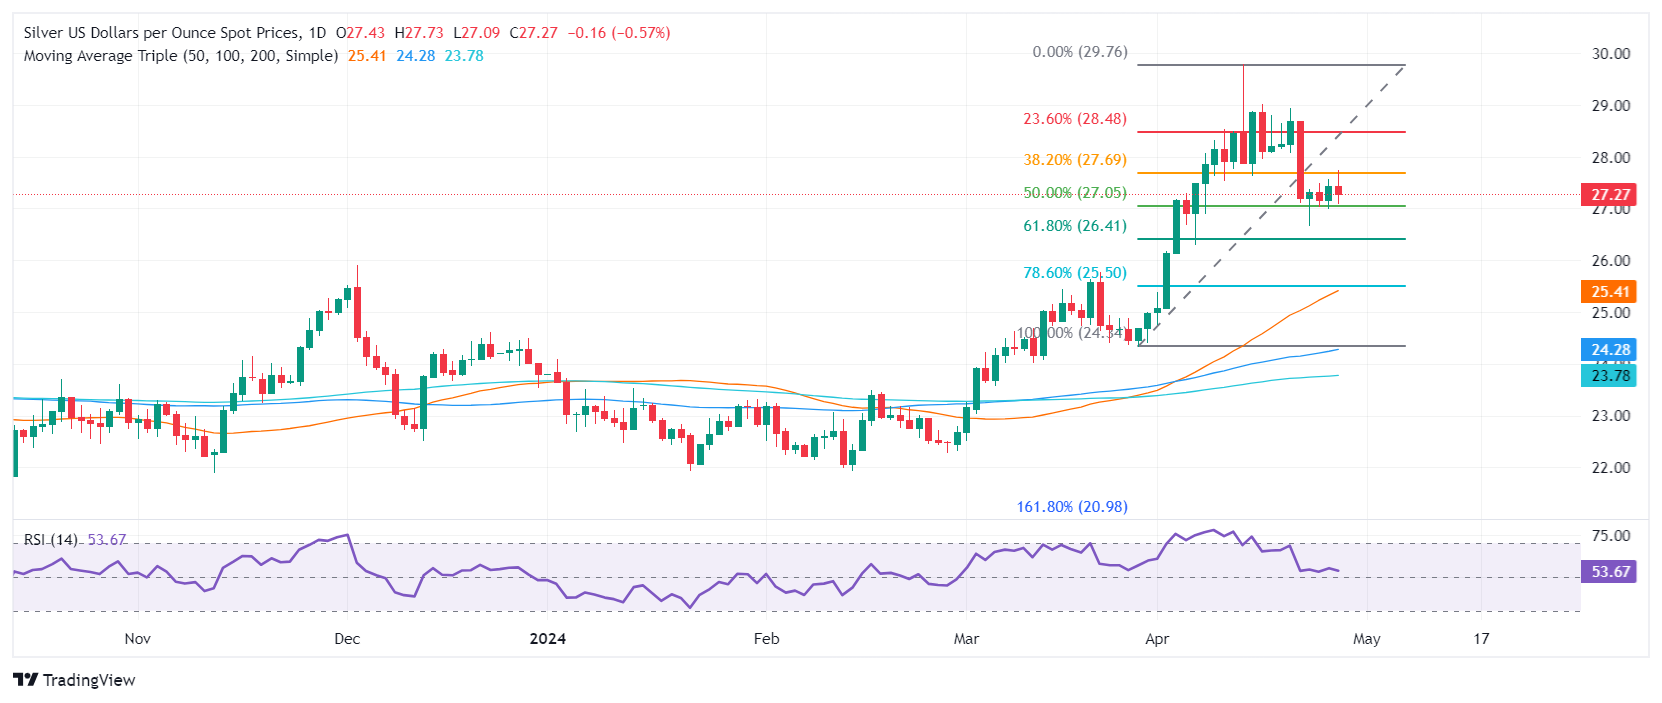
■ Silver falls pulling back from a daily high of $27.73.
■ Technical analysis indicates the uptrend is intact with key support at the $27.05 level, marked by the 50% Fibonacci retracement.
■ If silver surpasses the $28.00 resistance, potential targets are $28.48 and possibly year highs near $29.76.
■ Conversely, breaking below $27.05 could lead to $26.41 and further declines.
Silver's price dropped 0.79% after hitting a daily high of $27.73, as another inflation report in the United States showed warmer-than-expected inflation. The grey metal failed to capitalize on the fall in US Treasury yields, courtesy of a stronger US Dollar. At the time of writing, the XAG/USD trades at $27.21.
XAG/USD Price Analysis: Technical outlook
Despite retracing, the XAG/USD uptrend is intact, with dips viewed as opportunities for buyers to keep Silver's bid. During the last four trading days, Silver sellers had remained unable to push prices below the 50% Fibonacci retracement at $27.05, of the Fib drawn from the swing low at $24.34 to the latest high at $29.76.
For a bullish resumption, once traders surpass the $28.00 figure, that would pave the way for further upside. The first resistance would be the 23.6% Fib retracement at $28.48, followed by the $29.00 mark. The next supply area would be the year-to-date (YTD) high at $29.76.
On the flip side, bears could find some relief if XAG/USD slides below the 50% Fib retracement at $27.05, followed by the 61.8% retracement at $26.41. A subsequent dip is seen below that level, exposing the confluence of the 50-day moving average (DMA) and the 78.6% Fib retracement at $25.50.
XAG/USD Price Action – Daily Chart
Read more
* The content presented above, whether from a third party or not, is considered as general advice only. This article should not be construed as containing investment advice, investment recommendations, an offer of or solicitation for any transactions in financial instruments.


