


Bitcoin price volatility increases as BTC halving countdown closes in
- Bitcoin "danger zone" has done its job with two 18% pullbacks.
- Perhaps the bear cycle does not dip as hard with different types of buyers entering this cycle.
- Historically, Bitcoin has peaked in its bull market 518 to 546 days after the halving.
Bitcoin (BTC) price upside momentum has slowed down, but volatility levels have increased. Traders have steadied their hands as the halving closes in to set the tone for the next market cycle.
Also Read: All eyes on Bitcoin price as CNN calls halving the ‘World Cup for BTC’
Daily digest market movers: BTC halving countdown arrives
Bitcoin halving is here, an event expected to raise the curtain on the next market cycle. There has been a lot of turbulence in the market of late. Events such as flows from exchange-traded funds (ETFs) and tensions in the Middle East between Iran and Israel have sent traders into their shells. However, there could be some relief in the market after Iranian officials indicated there are no plans to retaliate against an Israeli strike on Friday.
JUST IN: Iranian officials say there are no plans for retaliating against Israeli strike - Reuters ️
— Radar (@RadarHits) April 19, 2024
With markets recording a slowdown in BTC acquisitions, it is imperative to observe that Bitcoin has managed to successfully close above the $60,000 psychological level for 50 successive days. More closely, it has been able to protect the range low of its re-accumulation range for two consecutive weeks.
Historically, Bitcoin price slows down in its upside momentum around the halving, often retracing, but momentum decisively picks back up in the months after the event. Analysts are saying the halving has already been priced in, an assumption that begs the question: When could Bitcoin peak in this bull market?
- Historically, Bitcoin has peaked in its bull market 518 to 546 days after the halving, a pattern that typically shows how BTC halving cycles have progressed.
- If history repeats or at best rhymes, the next bull market peak may occur around mid-September or mid-October 2025.
Bitcoin price reached a new all-time high of $73,777 approximately 260 days ahead of schedule compared to historical norms. The past few weeks, however, pre-halving retraces have dominated. Analysts from Rekt Capital speculate that BTC price could perform a bull market top 266-315 days after it reclaims its peak.
#BTC
— Rekt Capital (@rektcapital) April 19, 2024
When Could Bitcoin Peak In This Bull Market?
Historically, Bitcoin has peaked in its Bull Market 518-546 days after the Halving (Chart 1)
This is how typical Bitcoin Halving Cycles have progressed
So if history repeats...
Next Bull Market peak may occur 518-546 days… pic.twitter.com/QXZUS7ZyjU
The opposite seems likely for altcoins, with analysts anticipating an explosive run in their market capitalization after the BTC halving.
BTC vs ALTS
— CryptoAmsterdam (@damskotrades) April 19, 2024
this looks amazing for Altcoins pic.twitter.com/VR8JUKxWzv
Meanwhile, the "danger zone" for Bitcoin price, where pre-halving retraces tend to occur, appears to have completed successfully after two 18% pullbacks.
Technical analysis: Danger zone officially over for Bitcoin price
The market remains predominantly bullish with the Relative Strength Index (RSI) holding above the ‘50’ mean level. Both the Moving Average Convergence Divergence (MACD) and Awesome Oscillator (AO) are in positive territory, tilting the odds to the upside.
If the RSI holds above 50, Bitcoin price could continue north. A candlestick close above $70,000 would set the tone for an extension to the $73,777 peak, or in a highly bullish case, offer BTC a chance for a new all-time high.
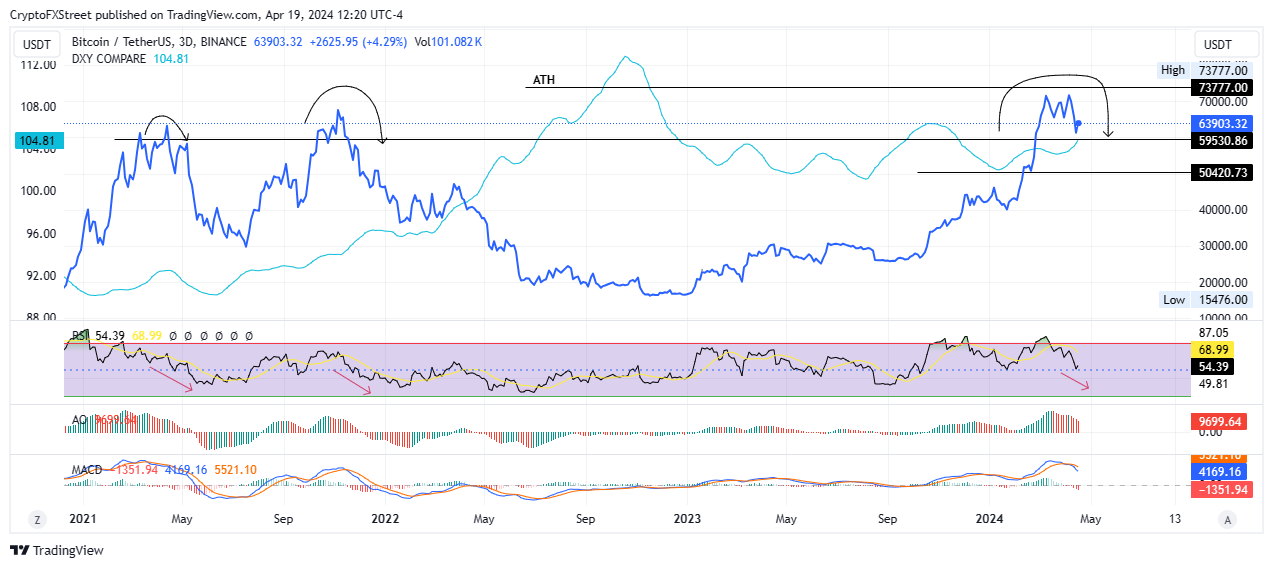
BTC/USDT 3-day chart
However, with the DXY compare indicator climbing, Bitcoin price could be primed for a correction, seeing as the two trajectories have maintained a countercurrent relationship. This thesis is supported by the MACD, which has crossed below the orange band of the signal line, a crossover interpreted as the beginning of a bearish cycle.
If the $59,530 support breaks, Bitcoin price could roll over to the $50,420 level before a possible inflection.
Bitcoin, altcoins, stablecoins FAQs
Bitcoin is the largest cryptocurrency by market capitalization, a virtual currency designed to serve as money. This form of payment cannot be controlled by any one person, group, or entity, which eliminates the need for third-party participation during financial transactions.
Altcoins are any cryptocurrency apart from Bitcoin, but some also regard Ethereum as a non-altcoin because it is from these two cryptocurrencies that forking happens. If this is true, then Litecoin is the first altcoin, forked from the Bitcoin protocol and, therefore, an “improved” version of it.
Stablecoins are cryptocurrencies designed to have a stable price, with their value backed by a reserve of the asset it represents. To achieve this, the value of any one stablecoin is pegged to a commodity or financial instrument, such as the US Dollar (USD), with its supply regulated by an algorithm or demand. The main goal of stablecoins is to provide an on/off-ramp for investors willing to trade and invest in cryptocurrencies. Stablecoins also allow investors to store value since cryptocurrencies, in general, are subject to volatility.
Bitcoin dominance is the ratio of Bitcoin's market capitalization to the total market capitalization of all cryptocurrencies combined. It provides a clear picture of Bitcoin’s interest among investors. A high BTC dominance typically happens before and during a bull run, in which investors resort to investing in relatively stable and high market capitalization cryptocurrency like Bitcoin. A drop in BTC dominance usually means that investors are moving their capital and/or profits to altcoins in a quest for higher returns, which usually triggers an explosion of altcoin rallies.
Recommended Articles


