Top Crypto Losers: Monero extends losses below $370 as Aster and Bonk risk record lows

Source Fxstreet
  • Monero trades below $370 after recording a nearly 8% drop on Sunday and breaking under the 50-day EMA.
  • Aster is back under $1 after four consecutive days of losses, risking a crucial support level.
  • Bonk extends consolidation below its $0.00001000 psychological resistance, with bears eyeing the $0.00000884 support level.

Altcoins, including Monero (XMR), Aster (ASTER), and Bonk (BONK), are at risk of extending their losses as the broader cryptocurrency market stalls amid the dragging peace talks between Ukraine and Russia. 

Monero under pressure risks testing the 200-day EMA

Monero trades below its 50-day Exponential Moving Average (EMA) at $371 following the 8% decline on Sunday, which marked the fourth straight bearish candle on the daily chart. At the time of writing, XMR holds steady with a 1% rise on Monday as bulls defend the $350 mark. 

A potential slip below this level could extend the downward trend to the 200-day EMA at $319. 

The momentum indicators on the daily chart evidence the tightening bearish grip. The Relative Strength Index (RSI) is at 43, slipping below the midline, indicating relatively stronger selling pressure.

At the same time, the Moving Average Convergence Divergence (MACD) approaches its zero line, maintaining the sell signal generated by a crossover on Wednesday.

XMR/USDT daily price chart.

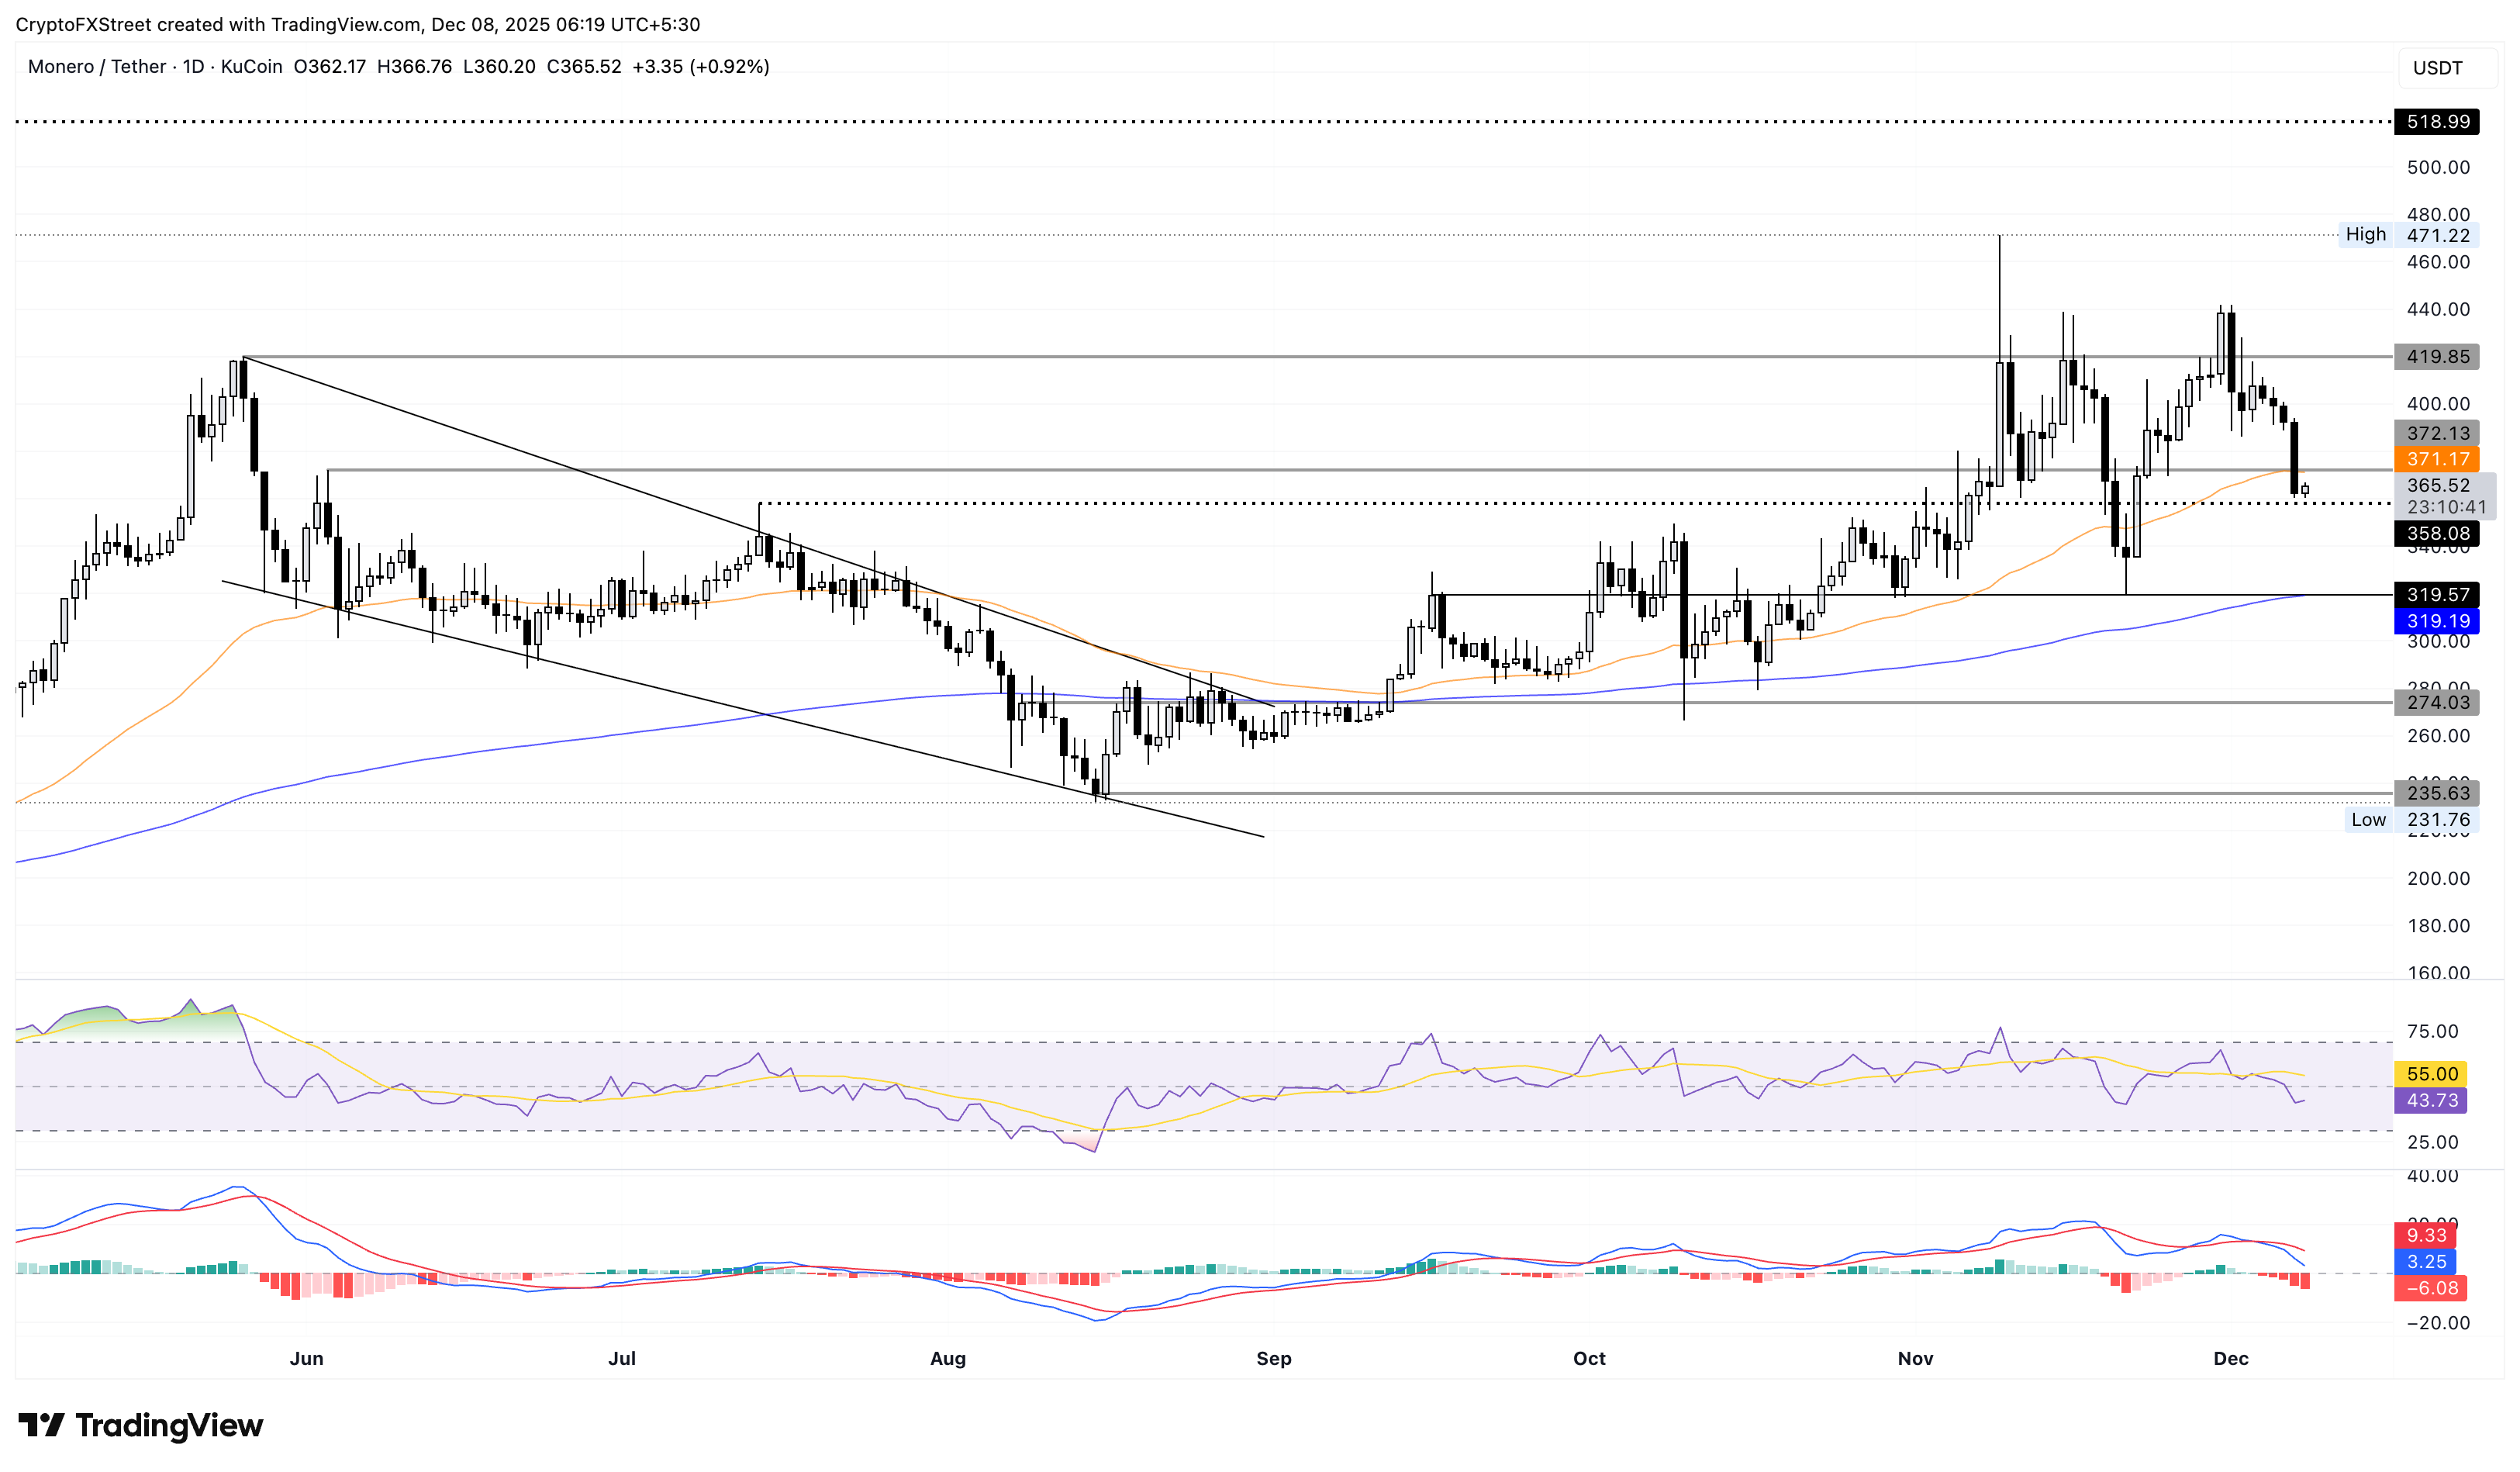
If XMR resurfaces above the 50-day EMA at $371, it could extend its recovery to the $400 round figure.

Aster’s downfall gains traction, risks a new record low

Aster trades above $0.900 at press time on Monday, after losing 6% the previous day. The perpetuals focused exchange token risks losing the $0.882 level, aligning with last week’s low.

If ASTER marks a successful close below this level, it risks testing the all-time low of $0.817 from November 4. Below this, the exchange token could enter a price discovery mode for a new record low. 

The momentum indicators on the 4-hour chart indicate intense overhead pressure. The RSI at 32 hovers near the oversold zone while the MACD and signal lines extend a declining trend.

ASTER/USDT 4-hour price chart.

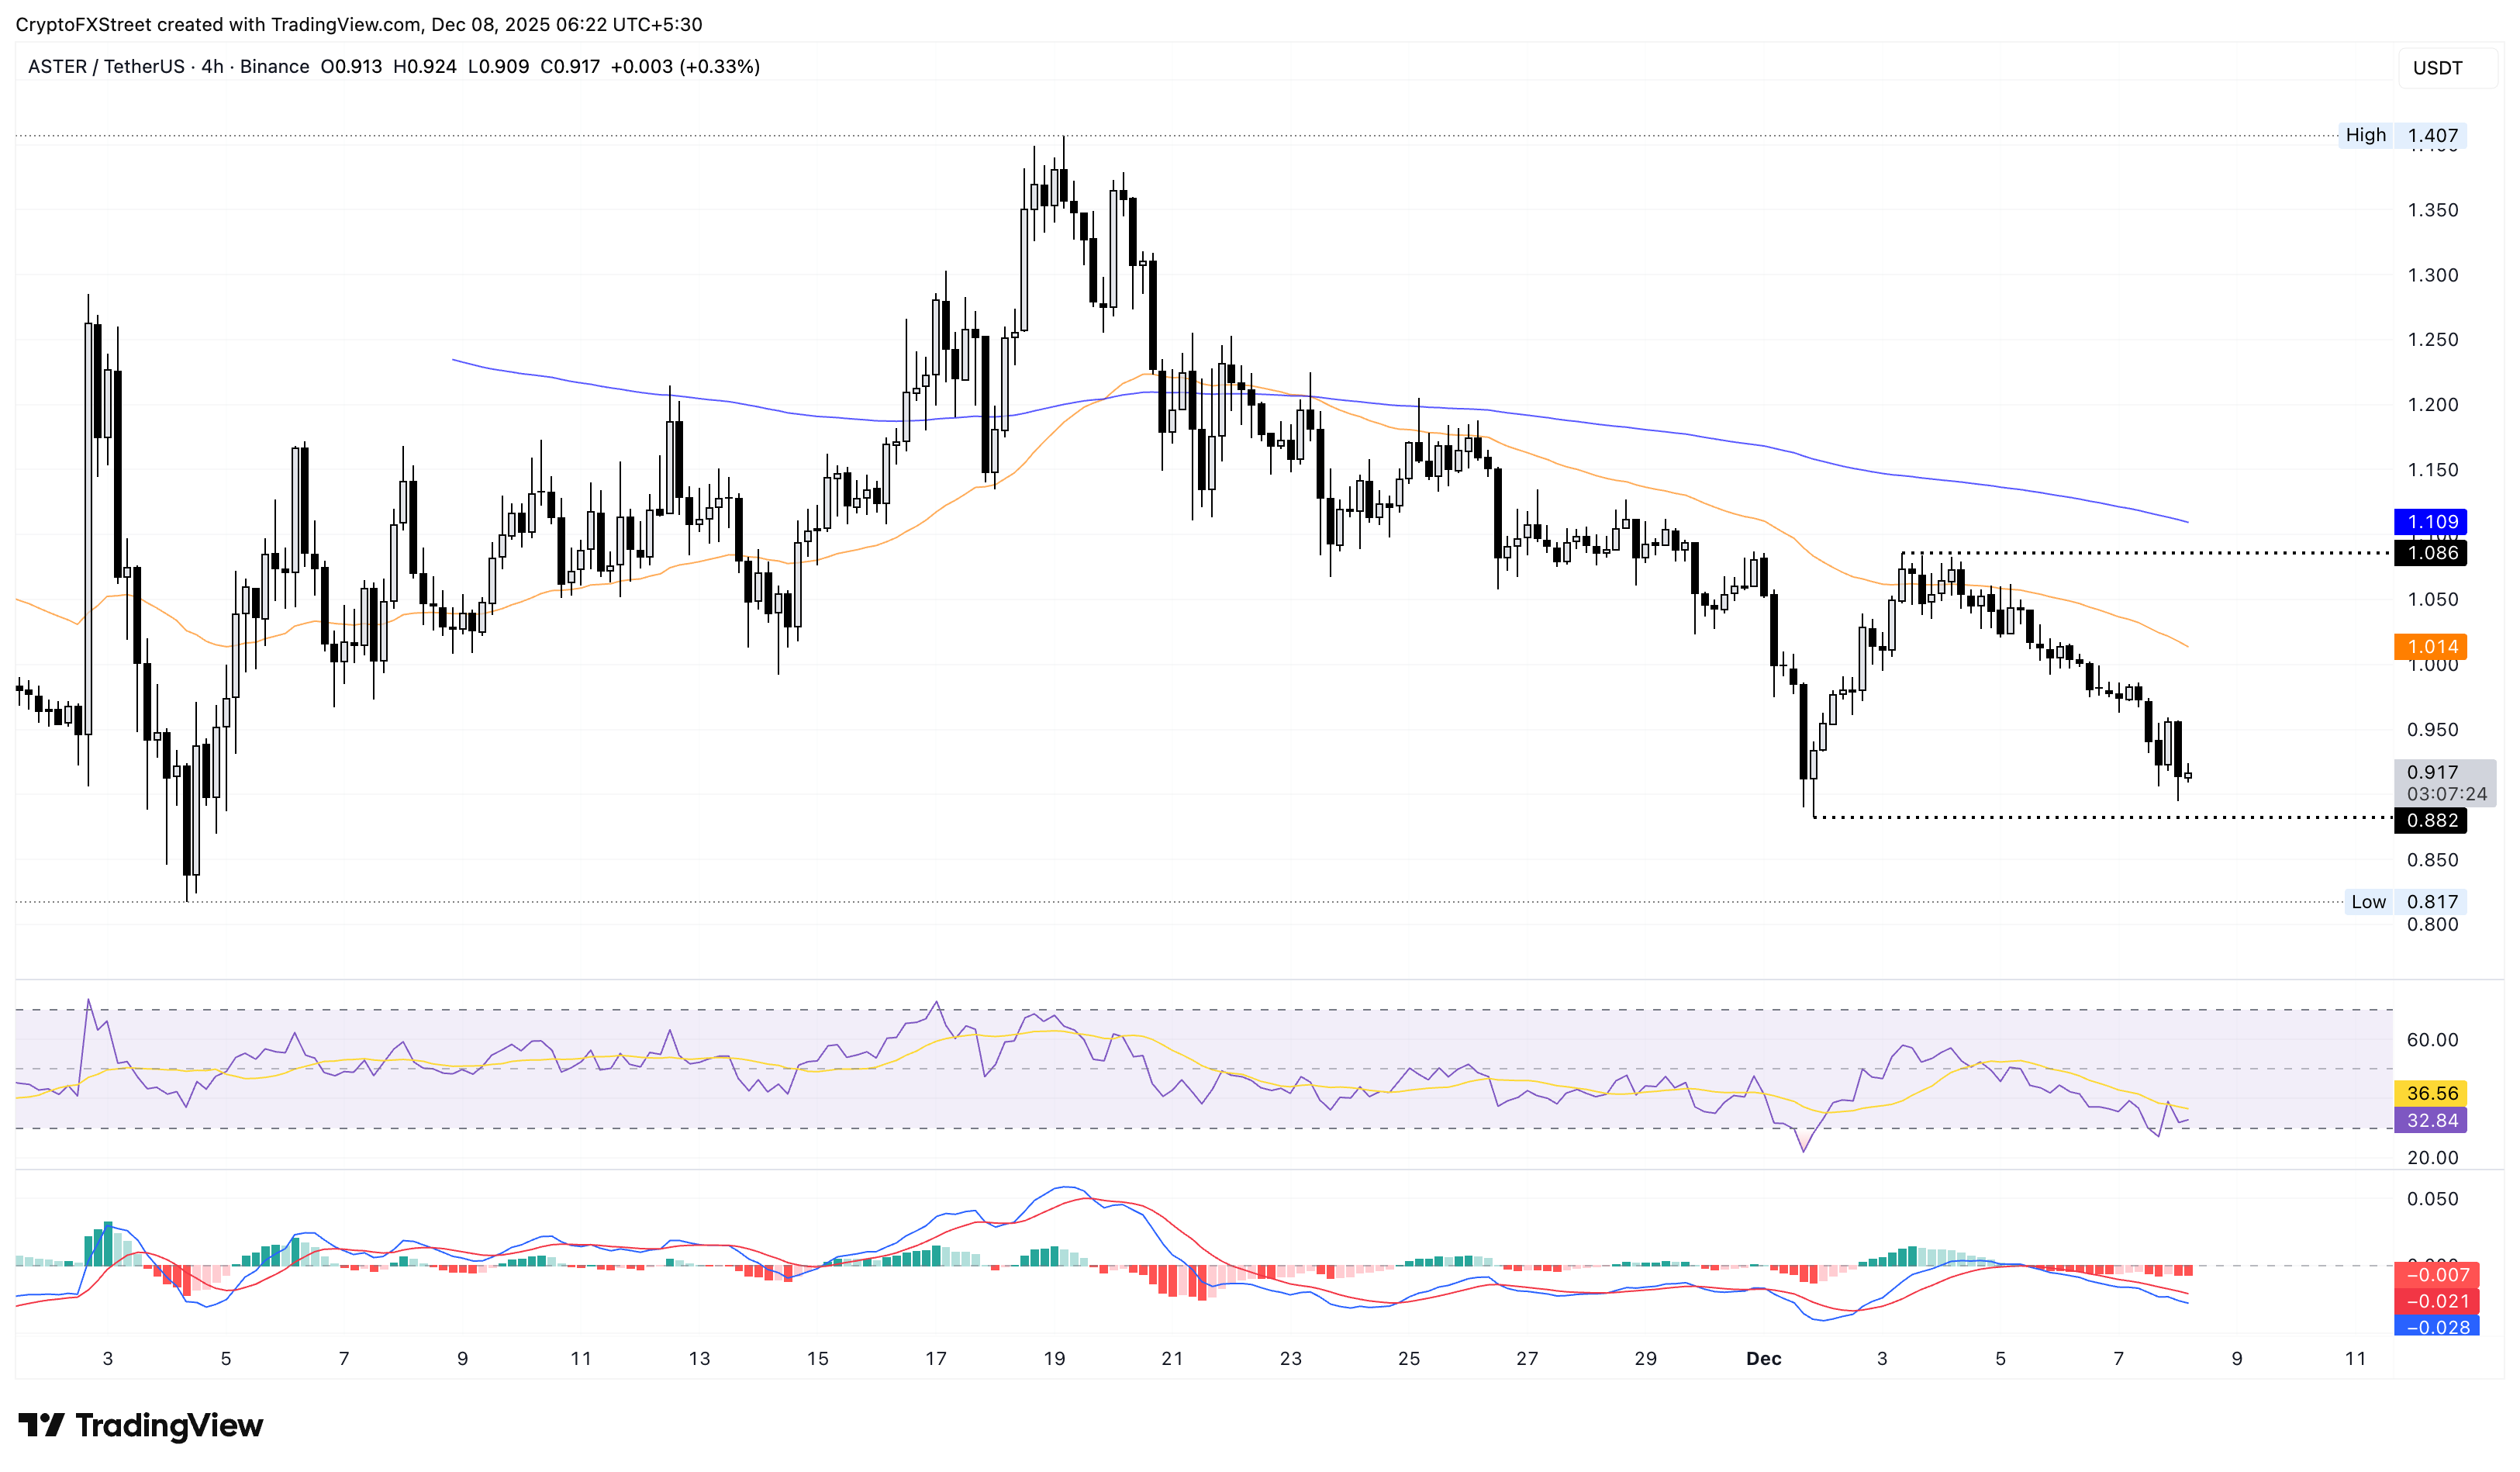
However, a potential rebound in Aster from $0.882 above the $1.000 psychological level could reinstate recovery towards the $1.086 high.

Bonk’s path of least resistance points to further losses

Bonk remains under pressure below $0.00001000 by press time on Monday, trading within a consolidation range on the 4-hour chart, with support at the November 22 low of $0.00000844 and resistance at $0.00001034. 

The path of least resistance for the meme coin points to $0.00000844, as the RSI is at 42 on the 4-hour chart, with room to the downside before oversold levels. Meanwhile, the MACD and signal lines move flat below the zero line, flashing mixed signals.

BONK/USDT 4-hour price chart.

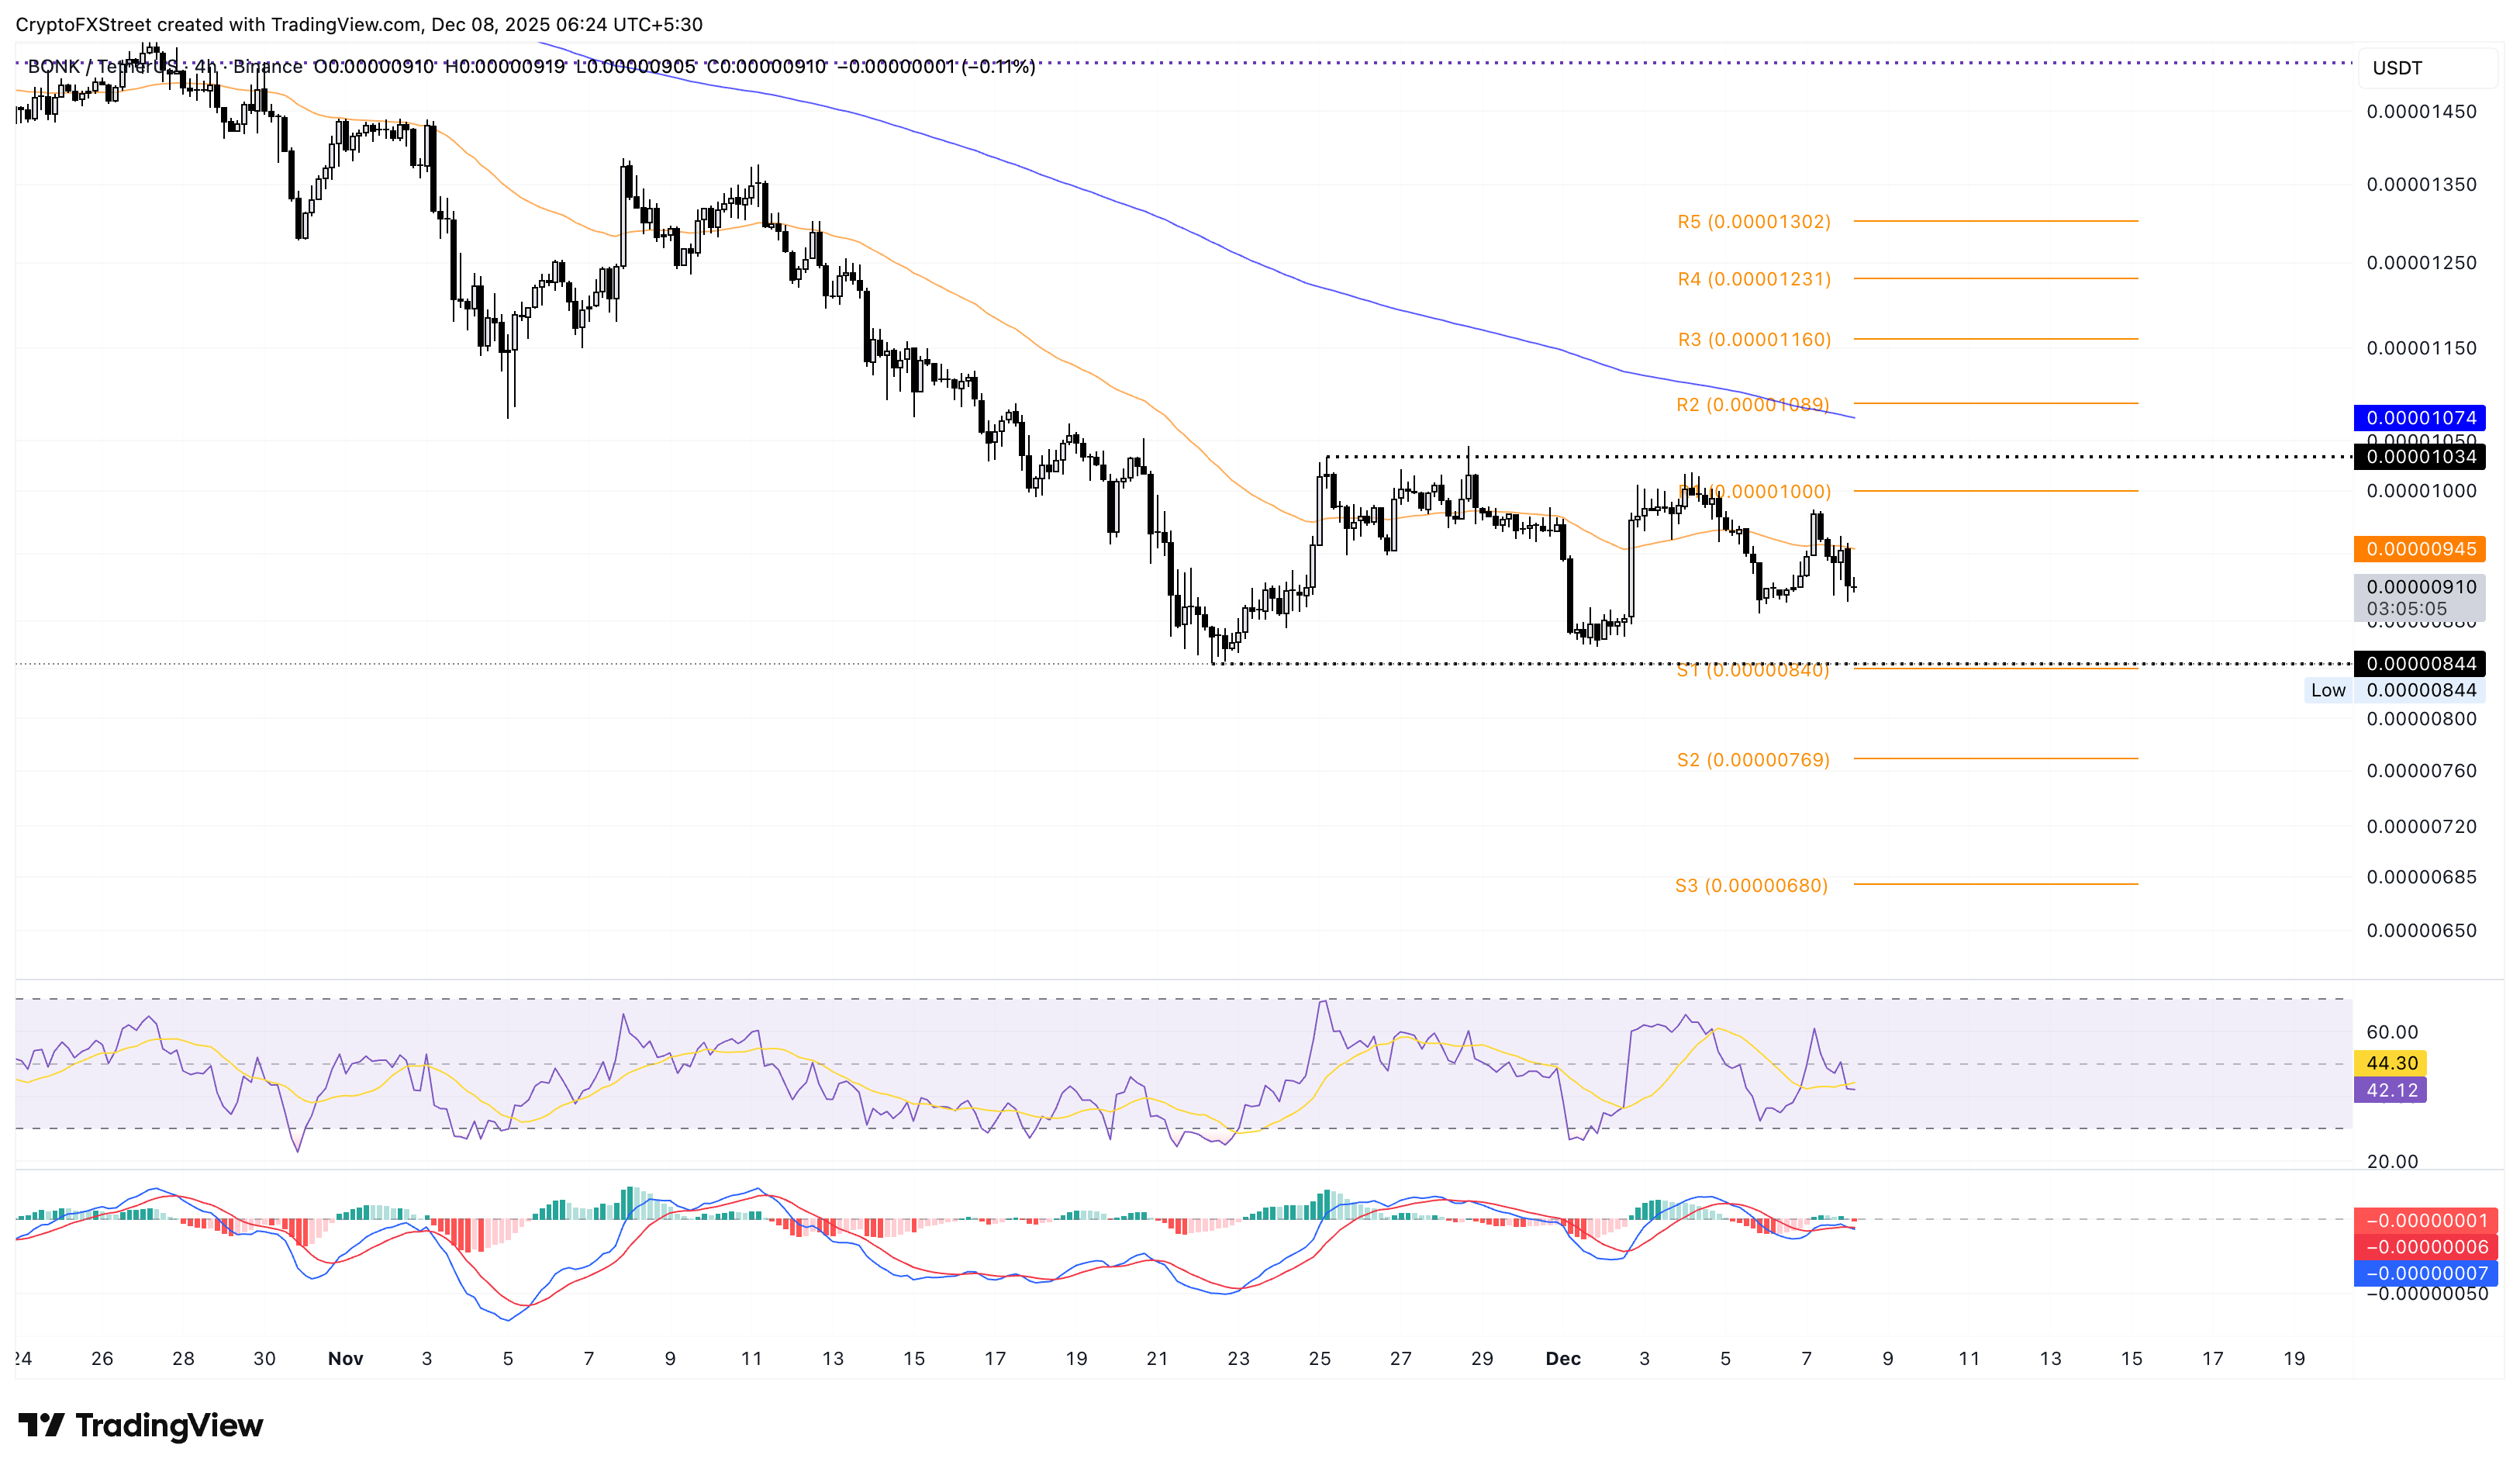
In case of a bullish breakout of the range, BONK could aim for the 200-period EMA at $0.00001074, followed by the R3 Pivot Point at $0.00001160.

Disclaimer: For information purposes only. Past performance is not indicative of future results.
placeholder
Natural Gas sinks to pivotal level as China’s demand slumpsNatural Gas price (XNG/USD) edges lower and sinks to $2.56 on Monday, extending its losing streak for the fifth day in a row. The move comes on the back of China cutting its Liquified Natural Gas (LNG) imports after prices rose above $3.0 in June. It
Author  FXStreet
Jul 01, 2024
Natural Gas price (XNG/USD) edges lower and sinks to $2.56 on Monday, extending its losing streak for the fifth day in a row. The move comes on the back of China cutting its Liquified Natural Gas (LNG) imports after prices rose above $3.0 in June. It
placeholder
The dollar weakened, equities dipped, and gold hit record highsThe dollar weakened, equities fell, and gold set new records on Wednesday as investors waited for a Fed rate cut later in the day.
Author  Cryptopolitan
Sep 17, 2025
The dollar weakened, equities fell, and gold set new records on Wednesday as investors waited for a Fed rate cut later in the day.
placeholder
ECB Policy Outlook for 2026: What It Could Mean for the Euro’s Next MoveWith the ECB likely holding rates steady at 2.15% and the Fed potentially extending cuts into 2026, EUR/USD may test 1.20 if Eurozone growth proves resilient, but weaker growth and an ECB pivot could pull the pair back toward 1.13 and potentially 1.10.
Author  Mitrade
Dec 26, 2025
With the ECB likely holding rates steady at 2.15% and the Fed potentially extending cuts into 2026, EUR/USD may test 1.20 if Eurozone growth proves resilient, but weaker growth and an ECB pivot could pull the pair back toward 1.13 and potentially 1.10.
placeholder
Gold Price Forecast: XAU/USD opens lower around $4,450 on fears of widening Iran conflictsGold price (XAU/USD) opens over 1% lower to near $4,445.00 on Monday, as oil prices have rallied further on fears of further widening of conflicts in the Middle East. WTI Oil price is up almost 3% above $102.50 in the opening trade, increasing fears of higher inflation expectations globally.
Author  FXStreet
Mar 30, Mon
Gold price (XAU/USD) opens over 1% lower to near $4,445.00 on Monday, as oil prices have rallied further on fears of further widening of conflicts in the Middle East. WTI Oil price is up almost 3% above $102.50 in the opening trade, increasing fears of higher inflation expectations globally.
placeholder
Gold rises on softer US Dollar, traders await Trump's address on Iran warGold price (XAU/USD) extends the rally to near $4,775 during the early Asian session on Thursday. The precious metal surges amid a weakening US Dollar (USD) and cooling geopolitical tensions in the Middle East.
Author  FXStreet
3 hours ago
Gold price (XAU/USD) extends the rally to near $4,775 during the early Asian session on Thursday. The precious metal surges amid a weakening US Dollar (USD) and cooling geopolitical tensions in the Middle East.
goTop
quote