

Crypto Today: Bitcoin, Ethereum, XRP edge higher despite low institutional and retail demand
- Bitcoin trades near $93,000, supported by mild ETF inflows.
- Ethereum bulls tighten grip as the token reclaims $3,000 despite extended ETF outflows.
- XRP experiences steady ETF inflows as bulls push to regain trend control.
Bitcoin (BTC) is showcasing strength, trading marginally below $93,000 at the time of writing on Wednesday. Altcoins, including Ethereum (BTC) and Ripple (XRP), are extending mild intraday gains, moving in tandem with Bitcoin and the larger cryptocurrency market.
Data spotlight: Bitcoin eyes the next recovery leg on mild ETF inflows
Bitcoin spot Exchange Traded Funds (ETFs) marked their fifth consecutive day of inflows on Tuesday. SoSoValue data shows US-listed BTC ETFs posted nearly $59 million in inflows, bringing the cumulative total inflow volume to approximately $58 billion, with net assets averaging $120 billion.
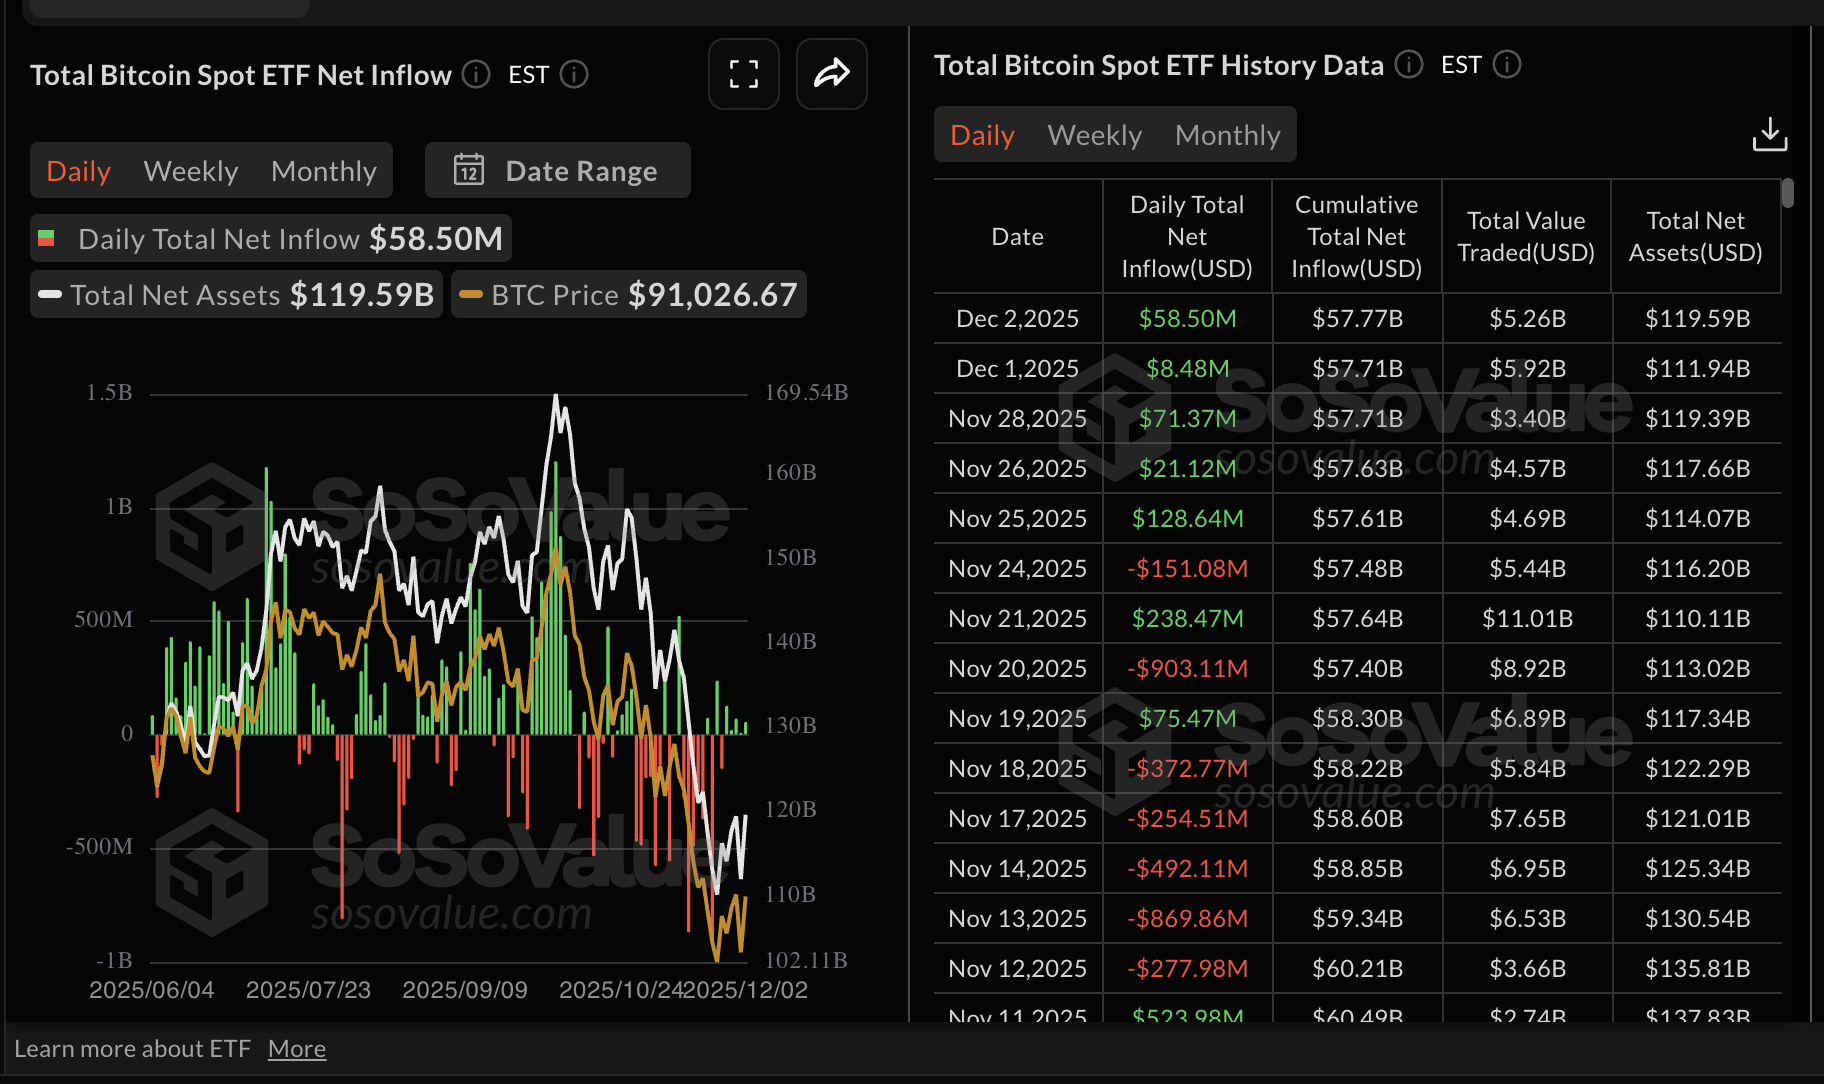
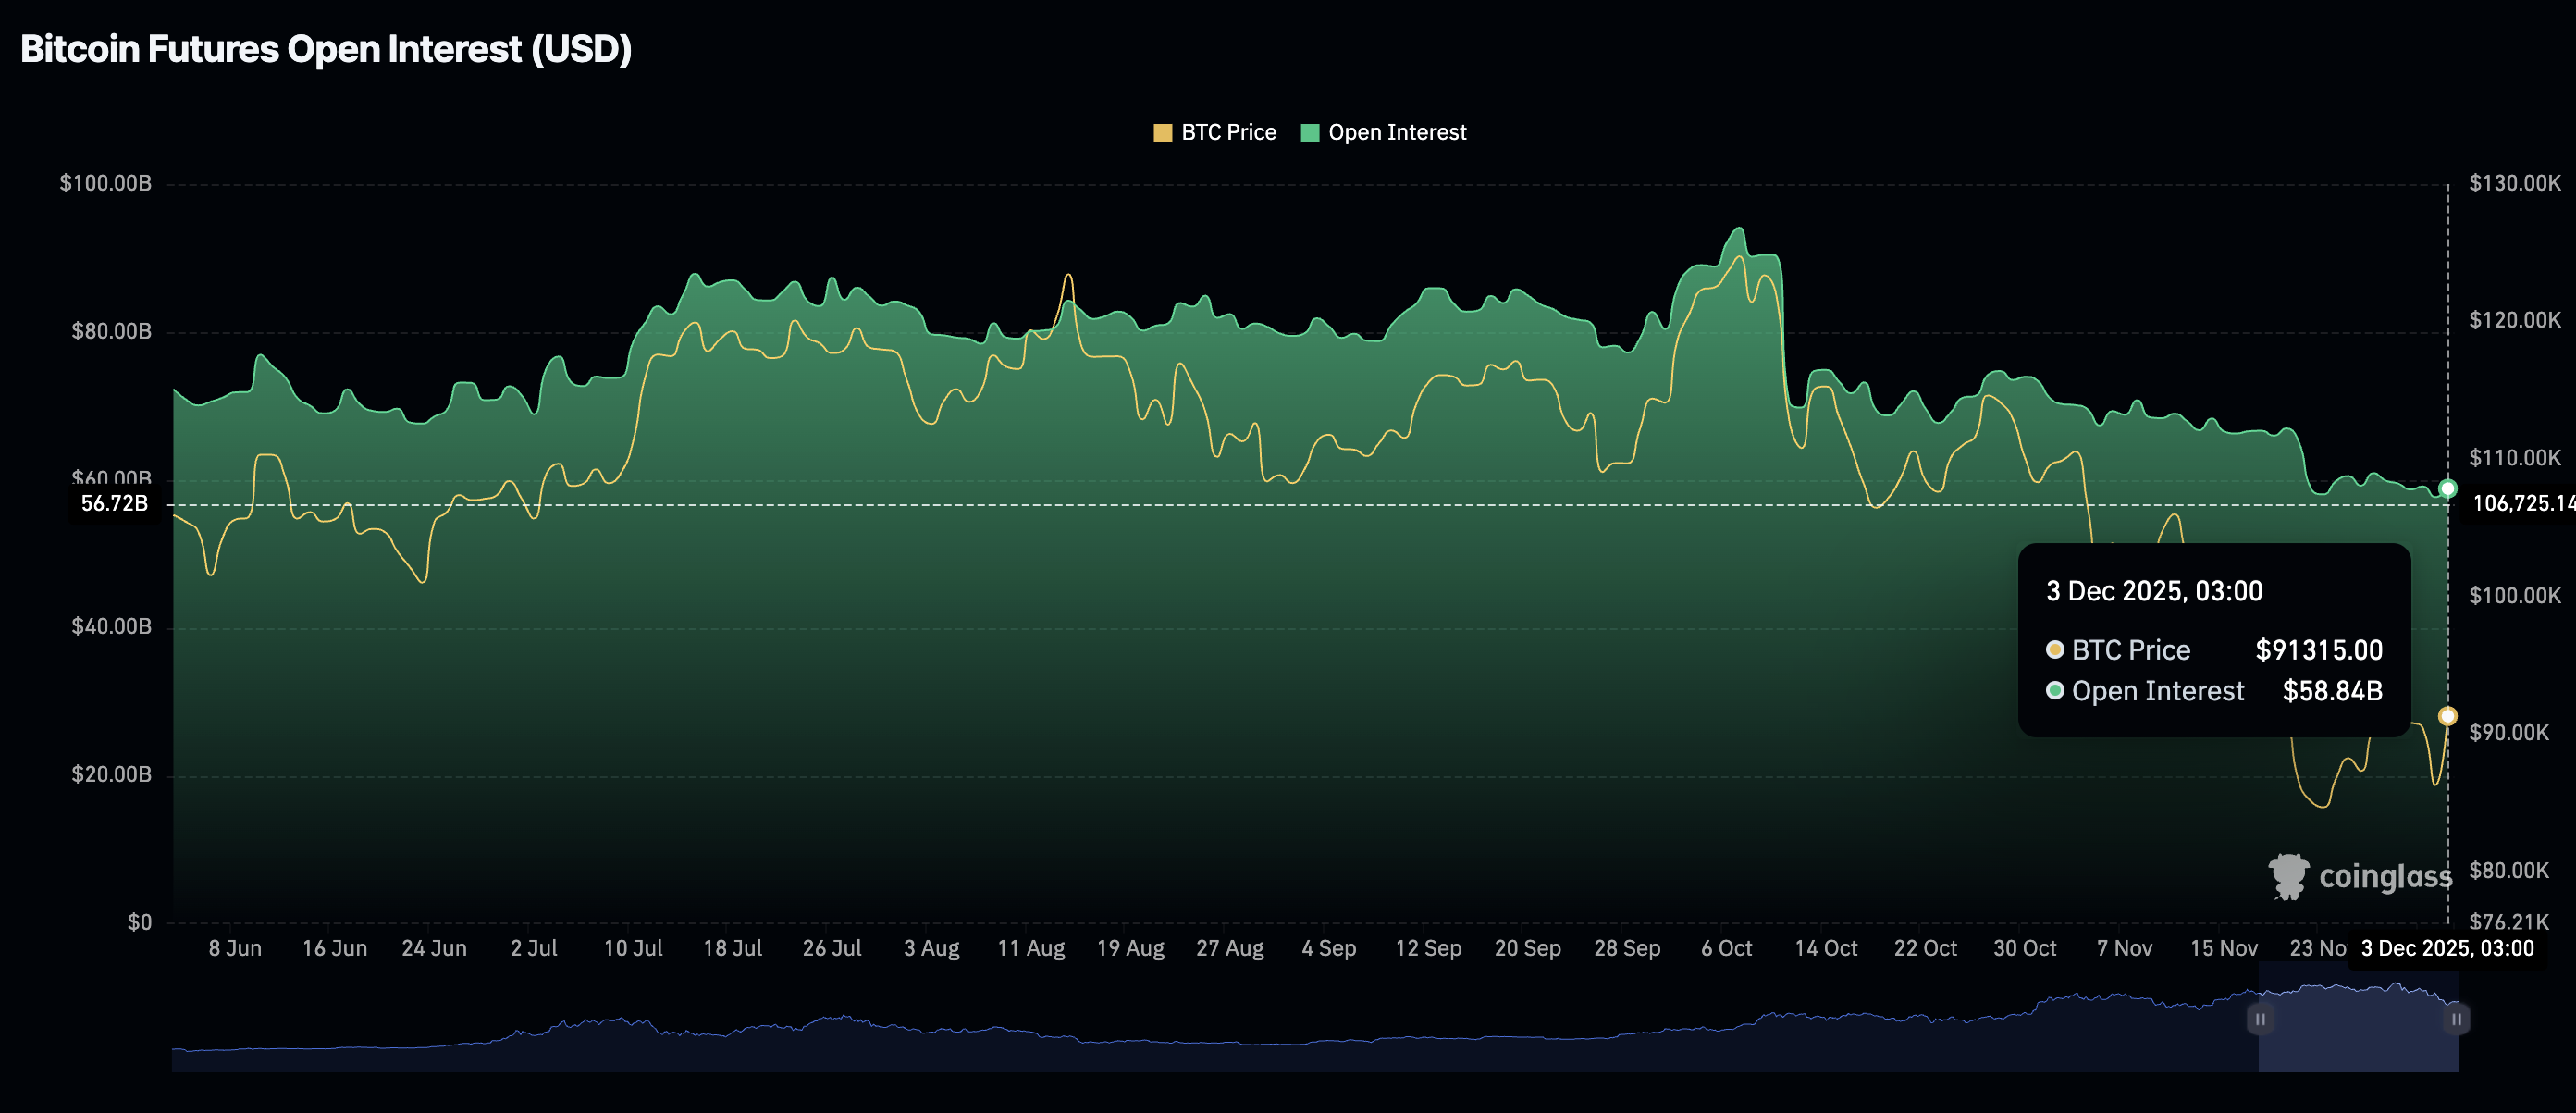
Despite the mild but steady ETF inflows, retail interest in Bitcoin remains significantly suppressed. CoinGlass data shows BTC futures Open Interest (OI) at $59 billion on Wednesday, down 34% from approximately $90 billion on October 10. A steady increase in OI measures of retail interest and confidence, which plays a key role in sustaining price increases.
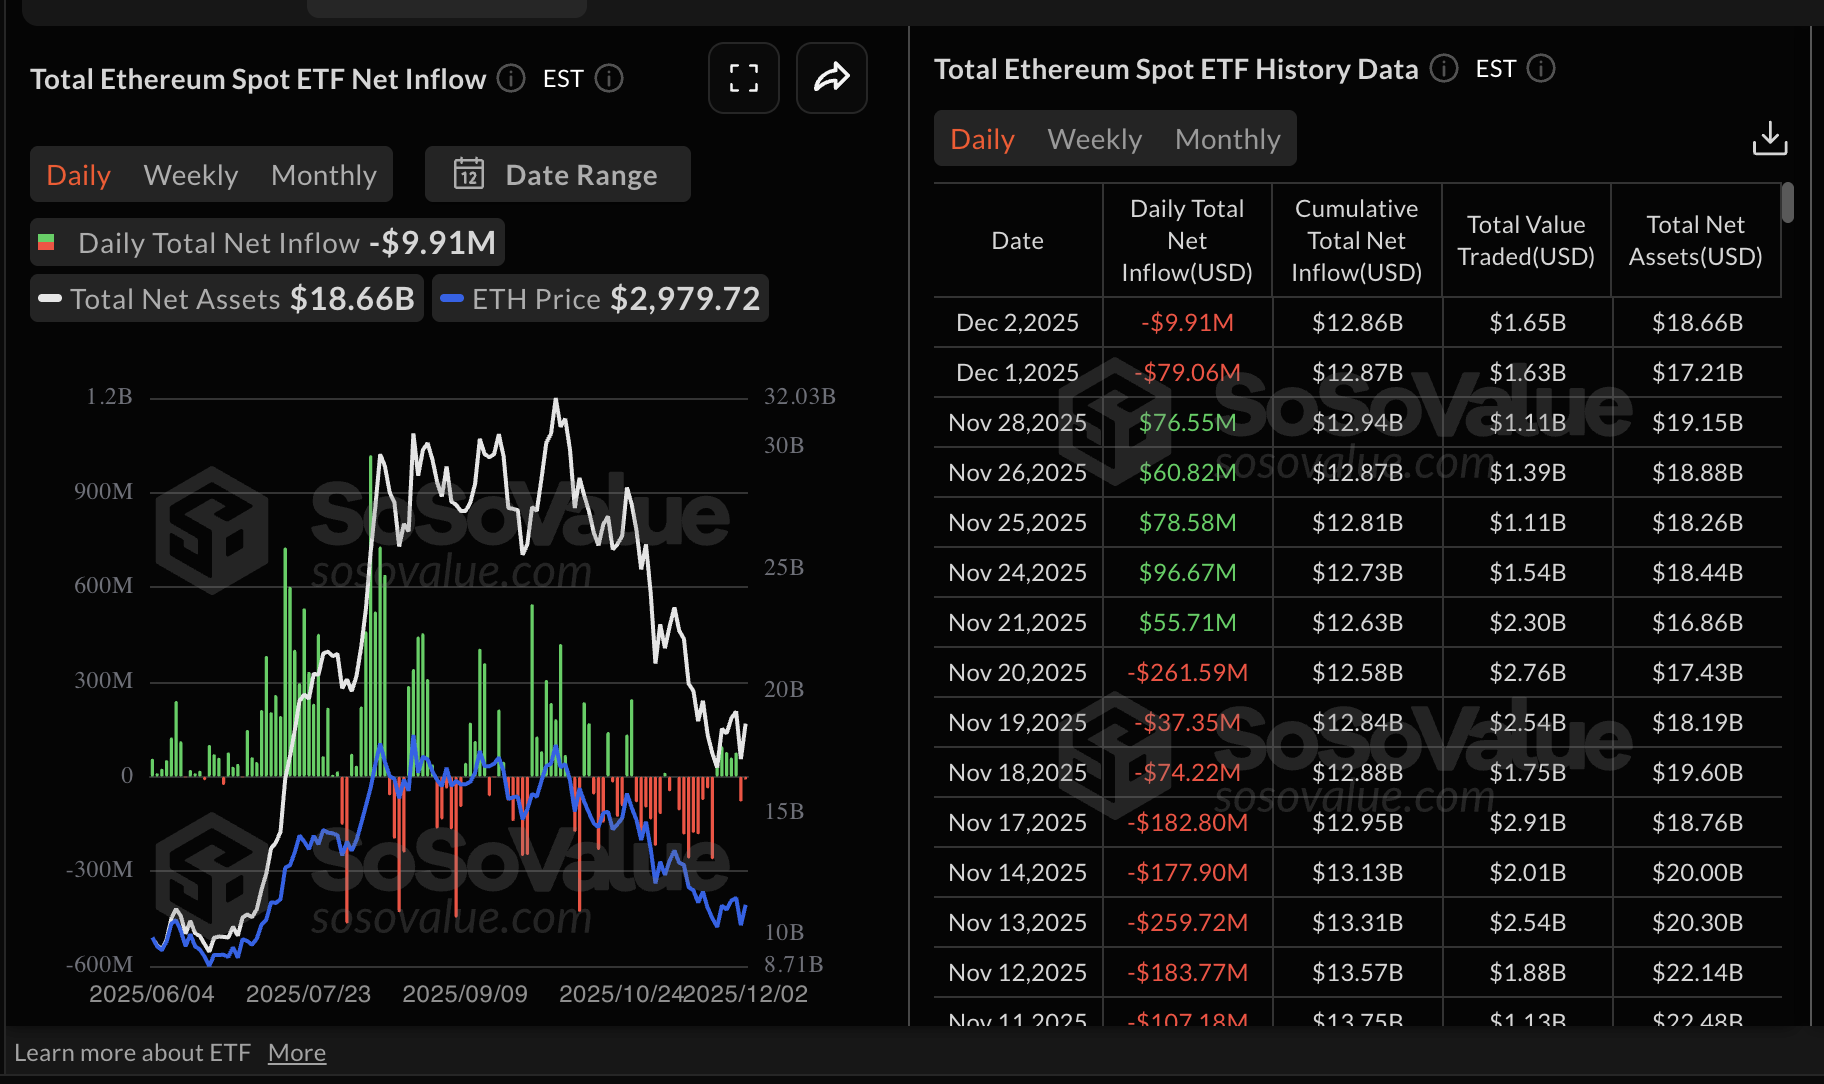
Institutional demand for Ethereum faltered on Monday, with US-listed ETFs recording $79 million in outflows. The bearish trend continued into Tuesday, as reflected in nearly $10 million in outflows. The cumulative total net inflow stands at $12.86 billion with net assets of $18.66 billion.
XRP, on the other hand, continues to post steady ETF inflows, signaling a potential shift in investor interest toward altcoin-based investment products. As shown in the chart below, US-listed XRP ETFs recorded nearly $68 million in inflows on Tuesday, extending a 12-day bullish streak. So far, XRP ETFs have $824 million in cumulative inflows, with net assets of $845 million.
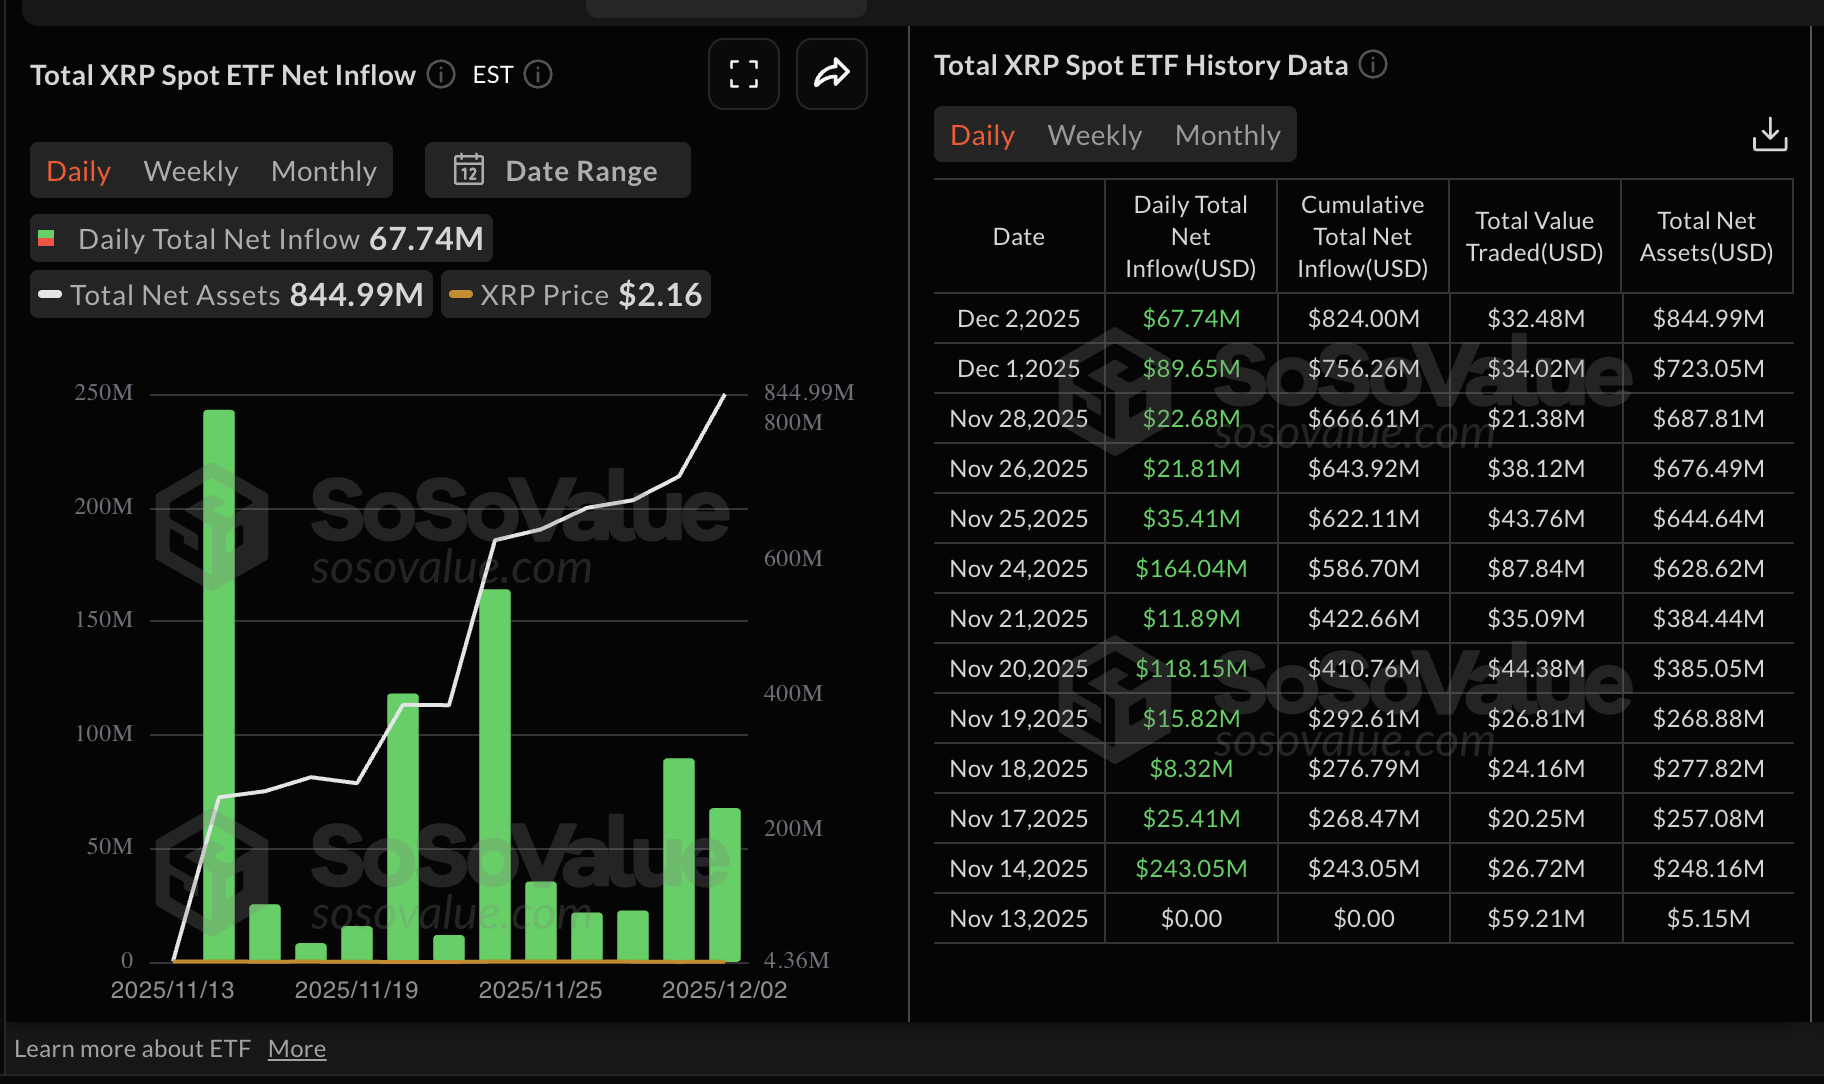
Chart of the day: Bitcoin offers mixed signals
Bitcoin price remains capped beneath the falling 50-day Exponential Moving Average (EMA) at $98,668, 100-day EMA at $103,844 and 200-EMA day 104,696, respectively, preserving a bearish alignment. The Moving Average Convergence Divergence (MACD) histogram on the daily chart has flipped positive and is widening, suggesting the blue MACD line to keep standing above the signal line, and momentum is improving around the zero mark.
The Relative Strength Index sits at 48 (neutral) and is edging higher, a mild confirmation of a stabilizing tone. An upward-sloping support line from $74,561 was broken near $102,149, flagging a shift in bias and leaving that region as a pivotal barrier on rebounds.

The downtrend remains intact while price holds below the 50-, 100-, and 200-day EMAs. Still, the MACD’s improving profile would need sustained positive readings above zero to strengthen a recovery, while RSI near 48 keeps a balanced tone that could prolong consolidation.
Altcoins update: Ethereum, XRP edge higher as recovery optimism builds
Ethereum is trading at $3,051 at the time of writing on Wednesday. It is also positioned under the falling 50-day EMA at $3,362, the 200-day EMA at $3,481 and the 100-day at $3,564, which could keep rebounds capped and the broader tone soft. The sequence of lower averages underscores a prevailing downtrend.
Meanwhile, the MACD on the daily chart, with the blue line above the red signal line and a widening positive histogram suggests improving upside momentum. The RSI at 46 (neutral) edges higher, indicating fading bearish pressure.

The rising trend line from $1,383 underpins the outlook, offering support near $2,678. A daily close above the first barrier (50-day EMA at $3,362) could open the door toward the next moving average (200-day EMA at $3,481), while rejection would keep risks tilted toward the trend-line support.
On the other hand, XRP is exchanging hands at $2.18 at the time of writing on Wednesday while holding below key moving averages, including the 50-day EMA at $2.32, the 100-day EMA at $2.47 and the 200-day EMA at $2.50. The MACD histogram has turned positive and is expanding on the daily chart, with the blue line above the red signal, suggesting improving upside momentum. At the same time, the RSI at 48 (neutral) is edging higher, indicating fading bearish pressure.
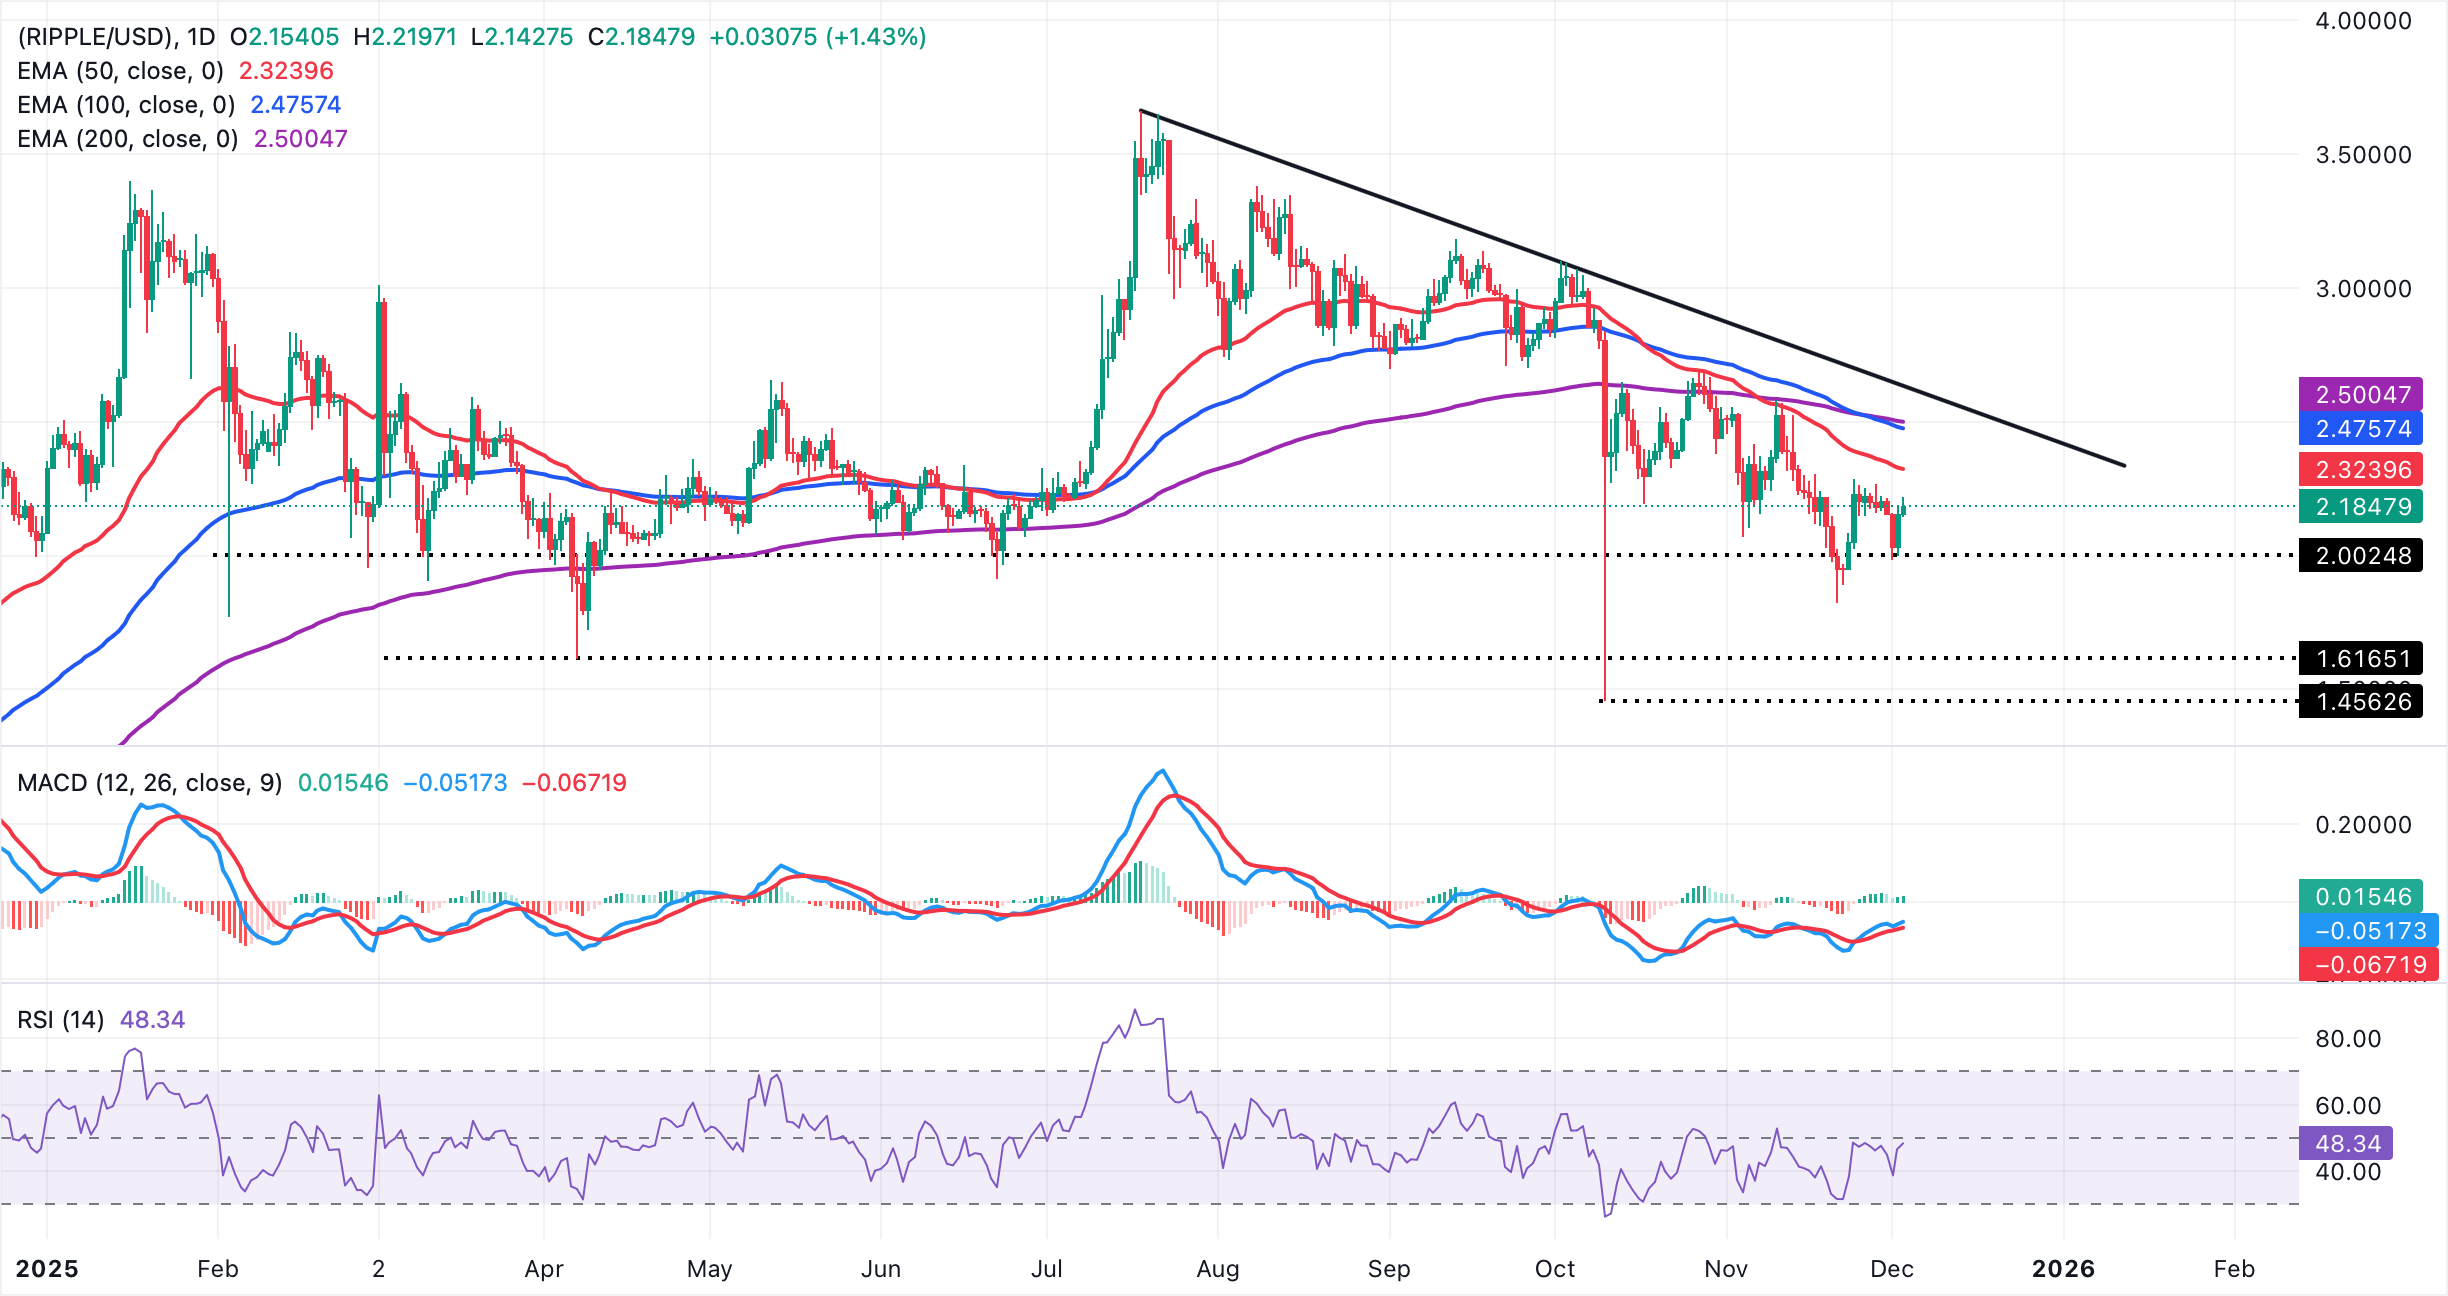
However, the descending trend line from $3.66 (all-time high) continues to limit gains, with resistance seen near $2.63. A close above the 50-EMA would open room toward the supply cluster at $2.47–2.50, where the 100- and 200-EMAs pose a heavier ceiling.
If momentum stalls, the bearish slope of the moving averages would keep rallies contained. MACD’s bullish shift would need follow-through to sustain a break, while RSI near 50 reflects balanced conditions and leaves price sensitive to directional catalysts.
Crypto ETF FAQs
An Exchange-Traded Fund (ETF) is an investment vehicle or an index that tracks the price of an underlying asset. ETFs can not only track a single asset, but a group of assets and sectors. For example, a Bitcoin ETF tracks Bitcoin’s price. ETF is a tool used by investors to gain exposure to a certain asset.
Yes. The first Bitcoin futures ETF in the US was approved by the US Securities & Exchange Commission in October 2021. A total of seven Bitcoin futures ETFs have been approved, with more than 20 still waiting for the regulator’s permission. The SEC says that the cryptocurrency industry is new and subject to manipulation, which is why it has been delaying crypto-related futures ETFs for the last few years.
Yes. The SEC approved in January 2024 the listing and trading of several Bitcoin spot Exchange-Traded Funds, opening the door to institutional capital and mainstream investors to trade the main crypto currency. The decision was hailed by the industry as a game changer.
The main advantage of crypto ETFs is the possibility of gaining exposure to a cryptocurrency without ownership, reducing the risk and cost of holding the asset. Other pros are a lower learning curve and higher security for investors since ETFs take charge of securing the underlying asset holdings. As for the main drawbacks, the main one is that as an investor you can’t have direct ownership of the asset, or, as they say in crypto, “not your keys, not your coins.” Other disadvantages are higher costs associated with holding crypto since ETFs charge fees for active management. Finally, even though investing in ETFs reduces the risk of holding an asset, price swings in the underlying cryptocurrency are likely to be reflected in the investment vehicle too.
(The technical analysis of this story was written with the help of an AI tool)
Recommended Articles


