Solana Price Forecast: SOL rebounds amid steady retail, institutional demand

Source Fxstreet
  • Solana extends recovery as bearish momentum wanes.
  • The rise in SOL futures Open Interest indicates renewed risk-on sentiment among investors.
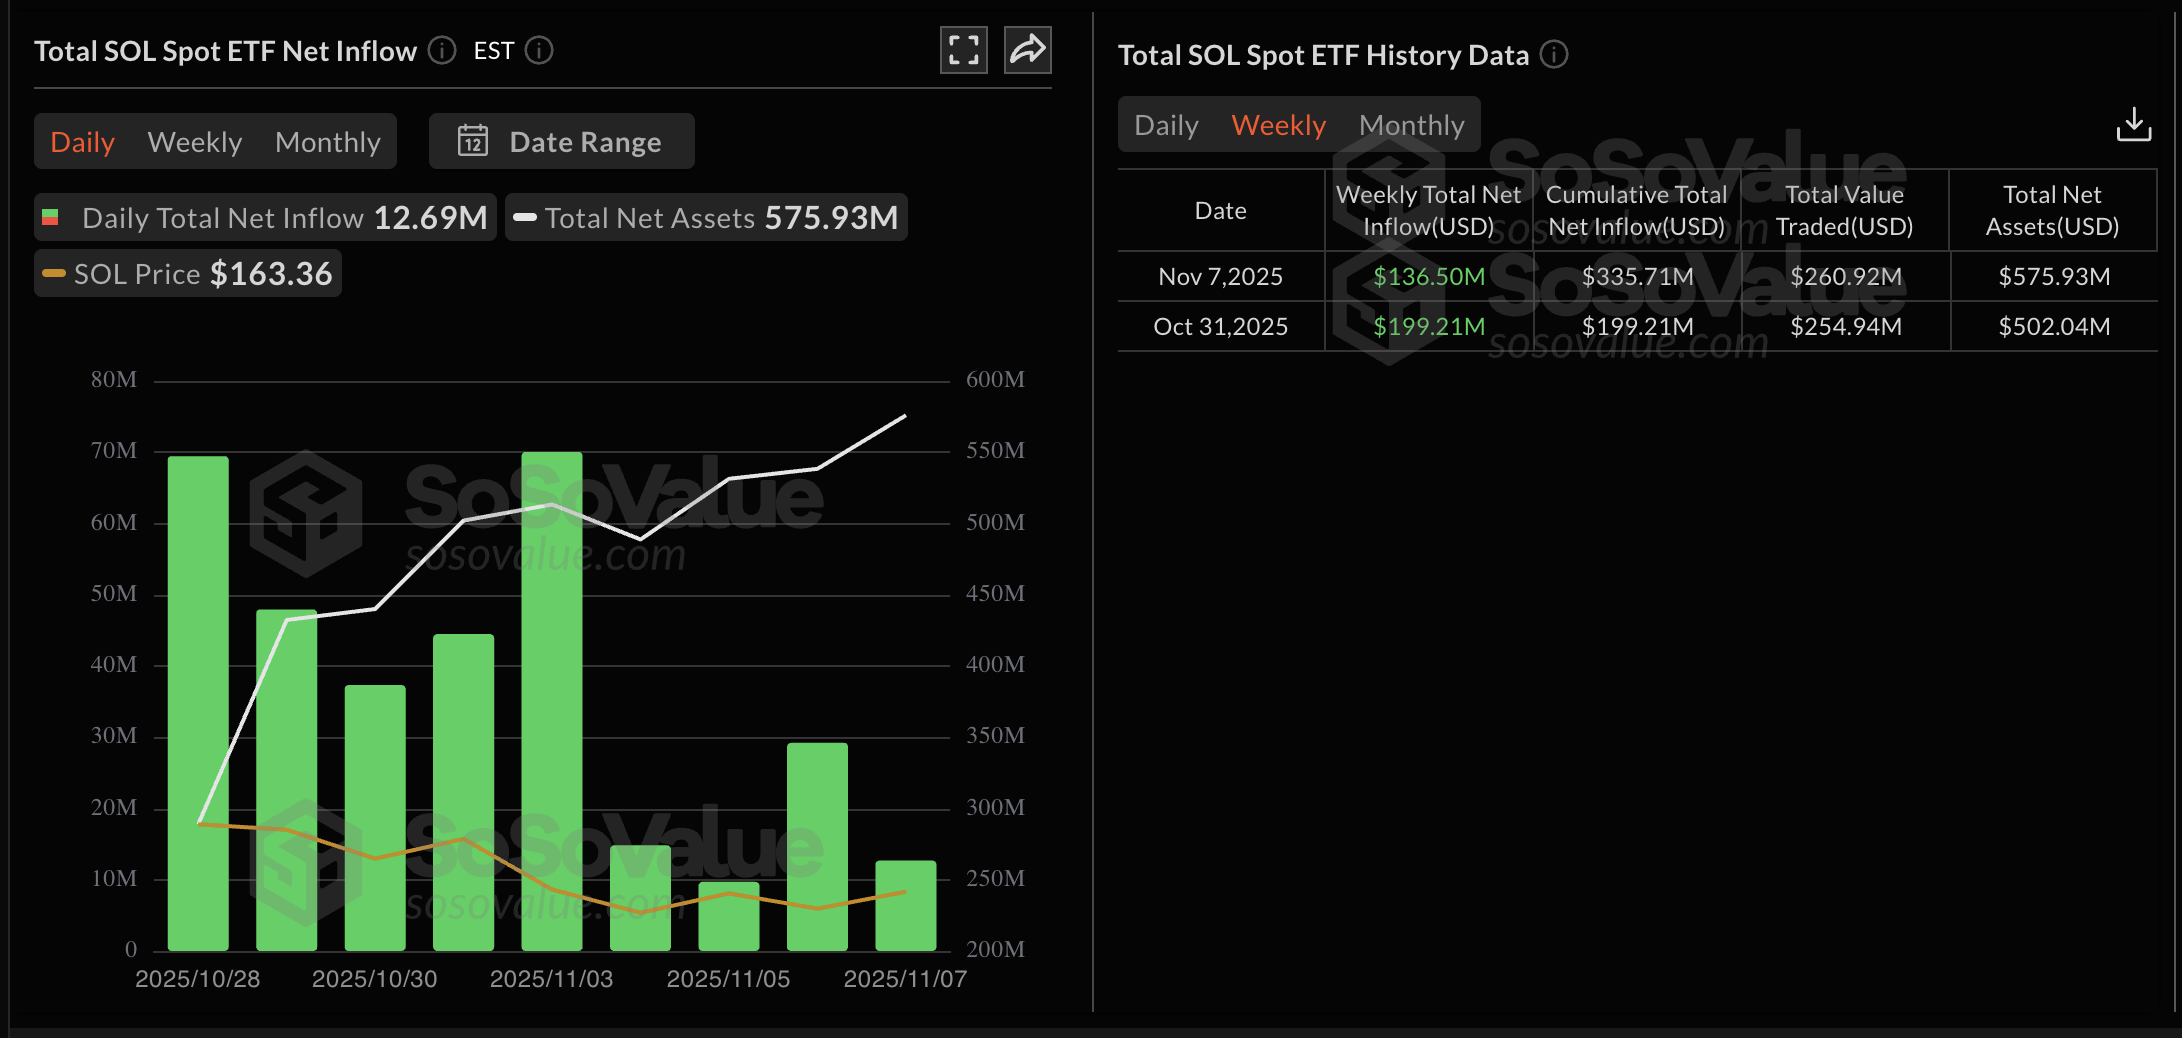
  • A steady streak of daily net inflows in the US spot SOL ETFs reflects consistent institutional demand. 

Solana (SOL) price is up nearly 2% at press time on Monday, extending the over 4% gains from the previous day. The rebound from the $150 psychological level signals strong demand, as evidenced by the consistent daily net inflows in the US spot Solana Exchange Traded Funds (ETFs). 

Furthermore, the retail interest increases their exposure to Solana futures, anticipating extended gains. Still, the technical outlook suggests that a previous key support zone has become resistance, posing a significant overhead hurdle that could stall the recovery.

Renewed retail and steady institutional demand back Solana

The US spot Solana ETFs recorded their ninth consecutive day of net inflows on Friday, amounting to $136.50 million in inflows last week. A potential increase in ETF inflows could uplift the SOL prices. 

The recent bounce back in the broader cryptocurrency market is driven by the possibility that the US government shutdown may be coming to an end, as the US Senate voted 60-40 on a temporary funding bill to reopen the government. This will need to be passed by the House of Representatives before being sent to US President Donald Trump to be signed. 

Despite the positive flows, the decreasing magnitude of daily net inflows suggests that the institutional demand could be at risk.

US spot SOL ETFs data. Source: Sosovalue.

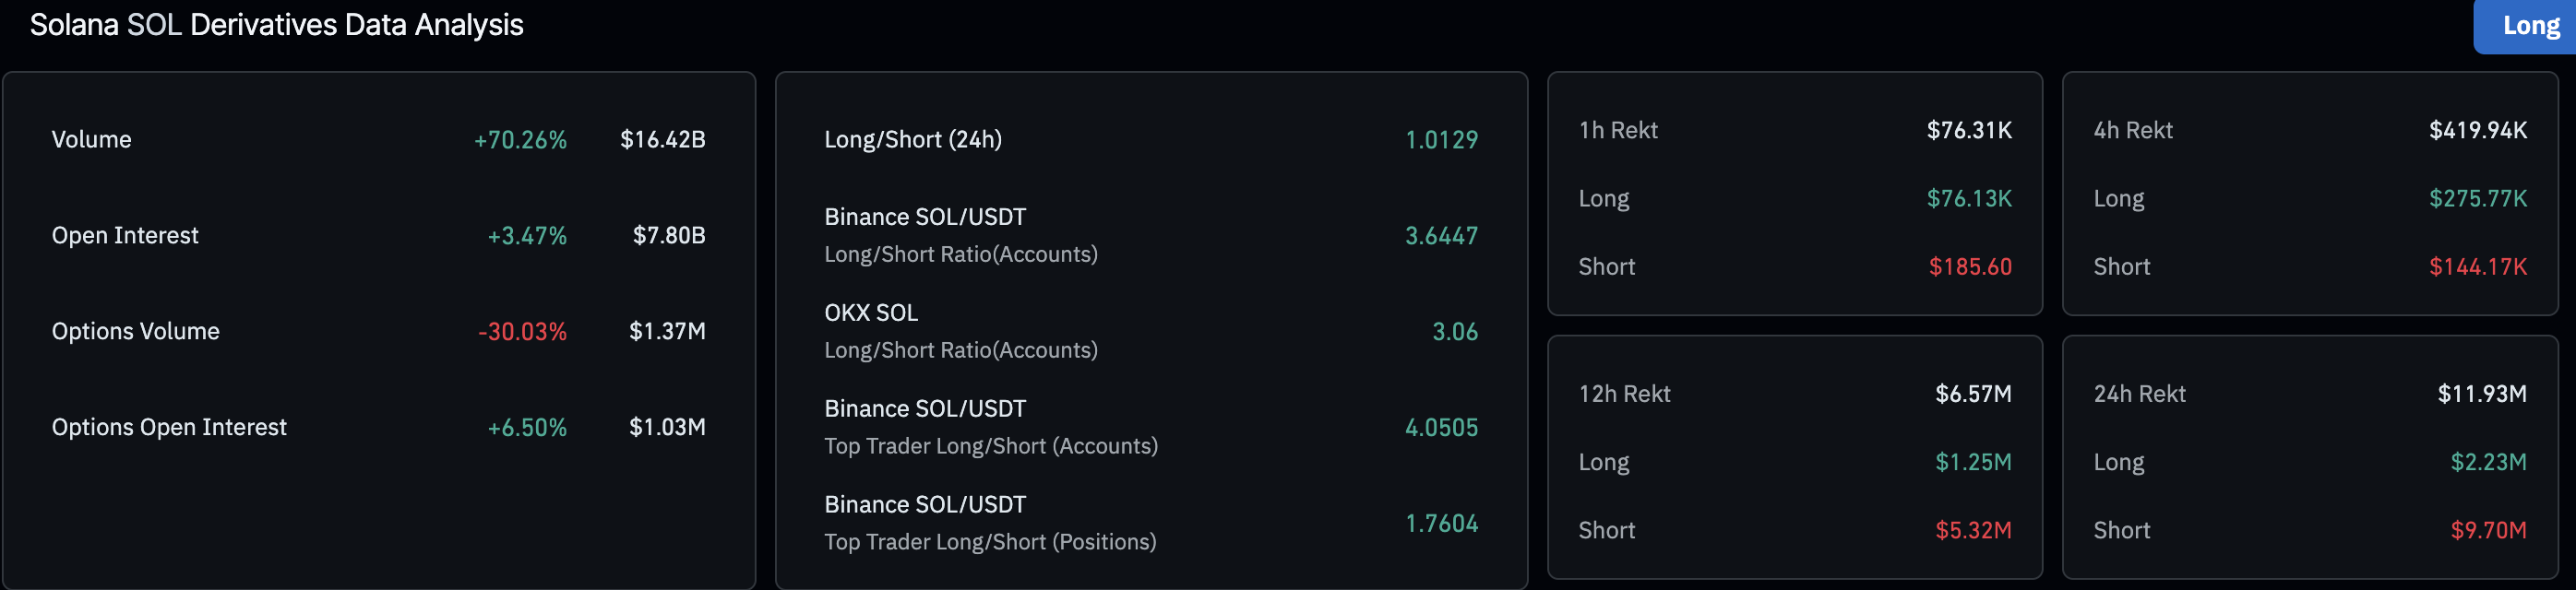
Meanwhile, the Solana derivatives experience an increase in capital inflows due to renewed bullish interest in the market. CoinGlass data shows that the SOL futures Open Interest (OI) has increased by 3.47% over the last 24 hours to $7.80 billion. This suggests that traders are establishing long positions or increasing their leverage. 

Furthermore, the short liquidations of $9.70 million in the same time period outpace the long liquidations of $2.23 million, indicating a wipeout of largely bearish positions.

SOL derivatives data.Source: CoinGlass.

Technical outlook: Will Solana’s recovery hit $200?

Solana marks the second consecutive bullish candle on the daily chart, extending the rebound from $155 support zone on Sunday. The recovery run in SOL targets a broken trendline and the $175 zone from last week. 

A decisive close above this zone could test the 200-day Exponential Moving Average (EMA) at $185, followed by the $200 round figure. 

The technical indicators on the daily chart suggest that the recovery run is gaining traction as the Relative Strength Index (RSI) is at 41, rising from the oversold zone, indicating a decline in selling pressure. At the same time, the Moving Average Convergence Divergence (MACD) approaches the signal line, preparing for a crossover which could confirm a renewed bullish momentum. 

SOL/USDT daily price chart.

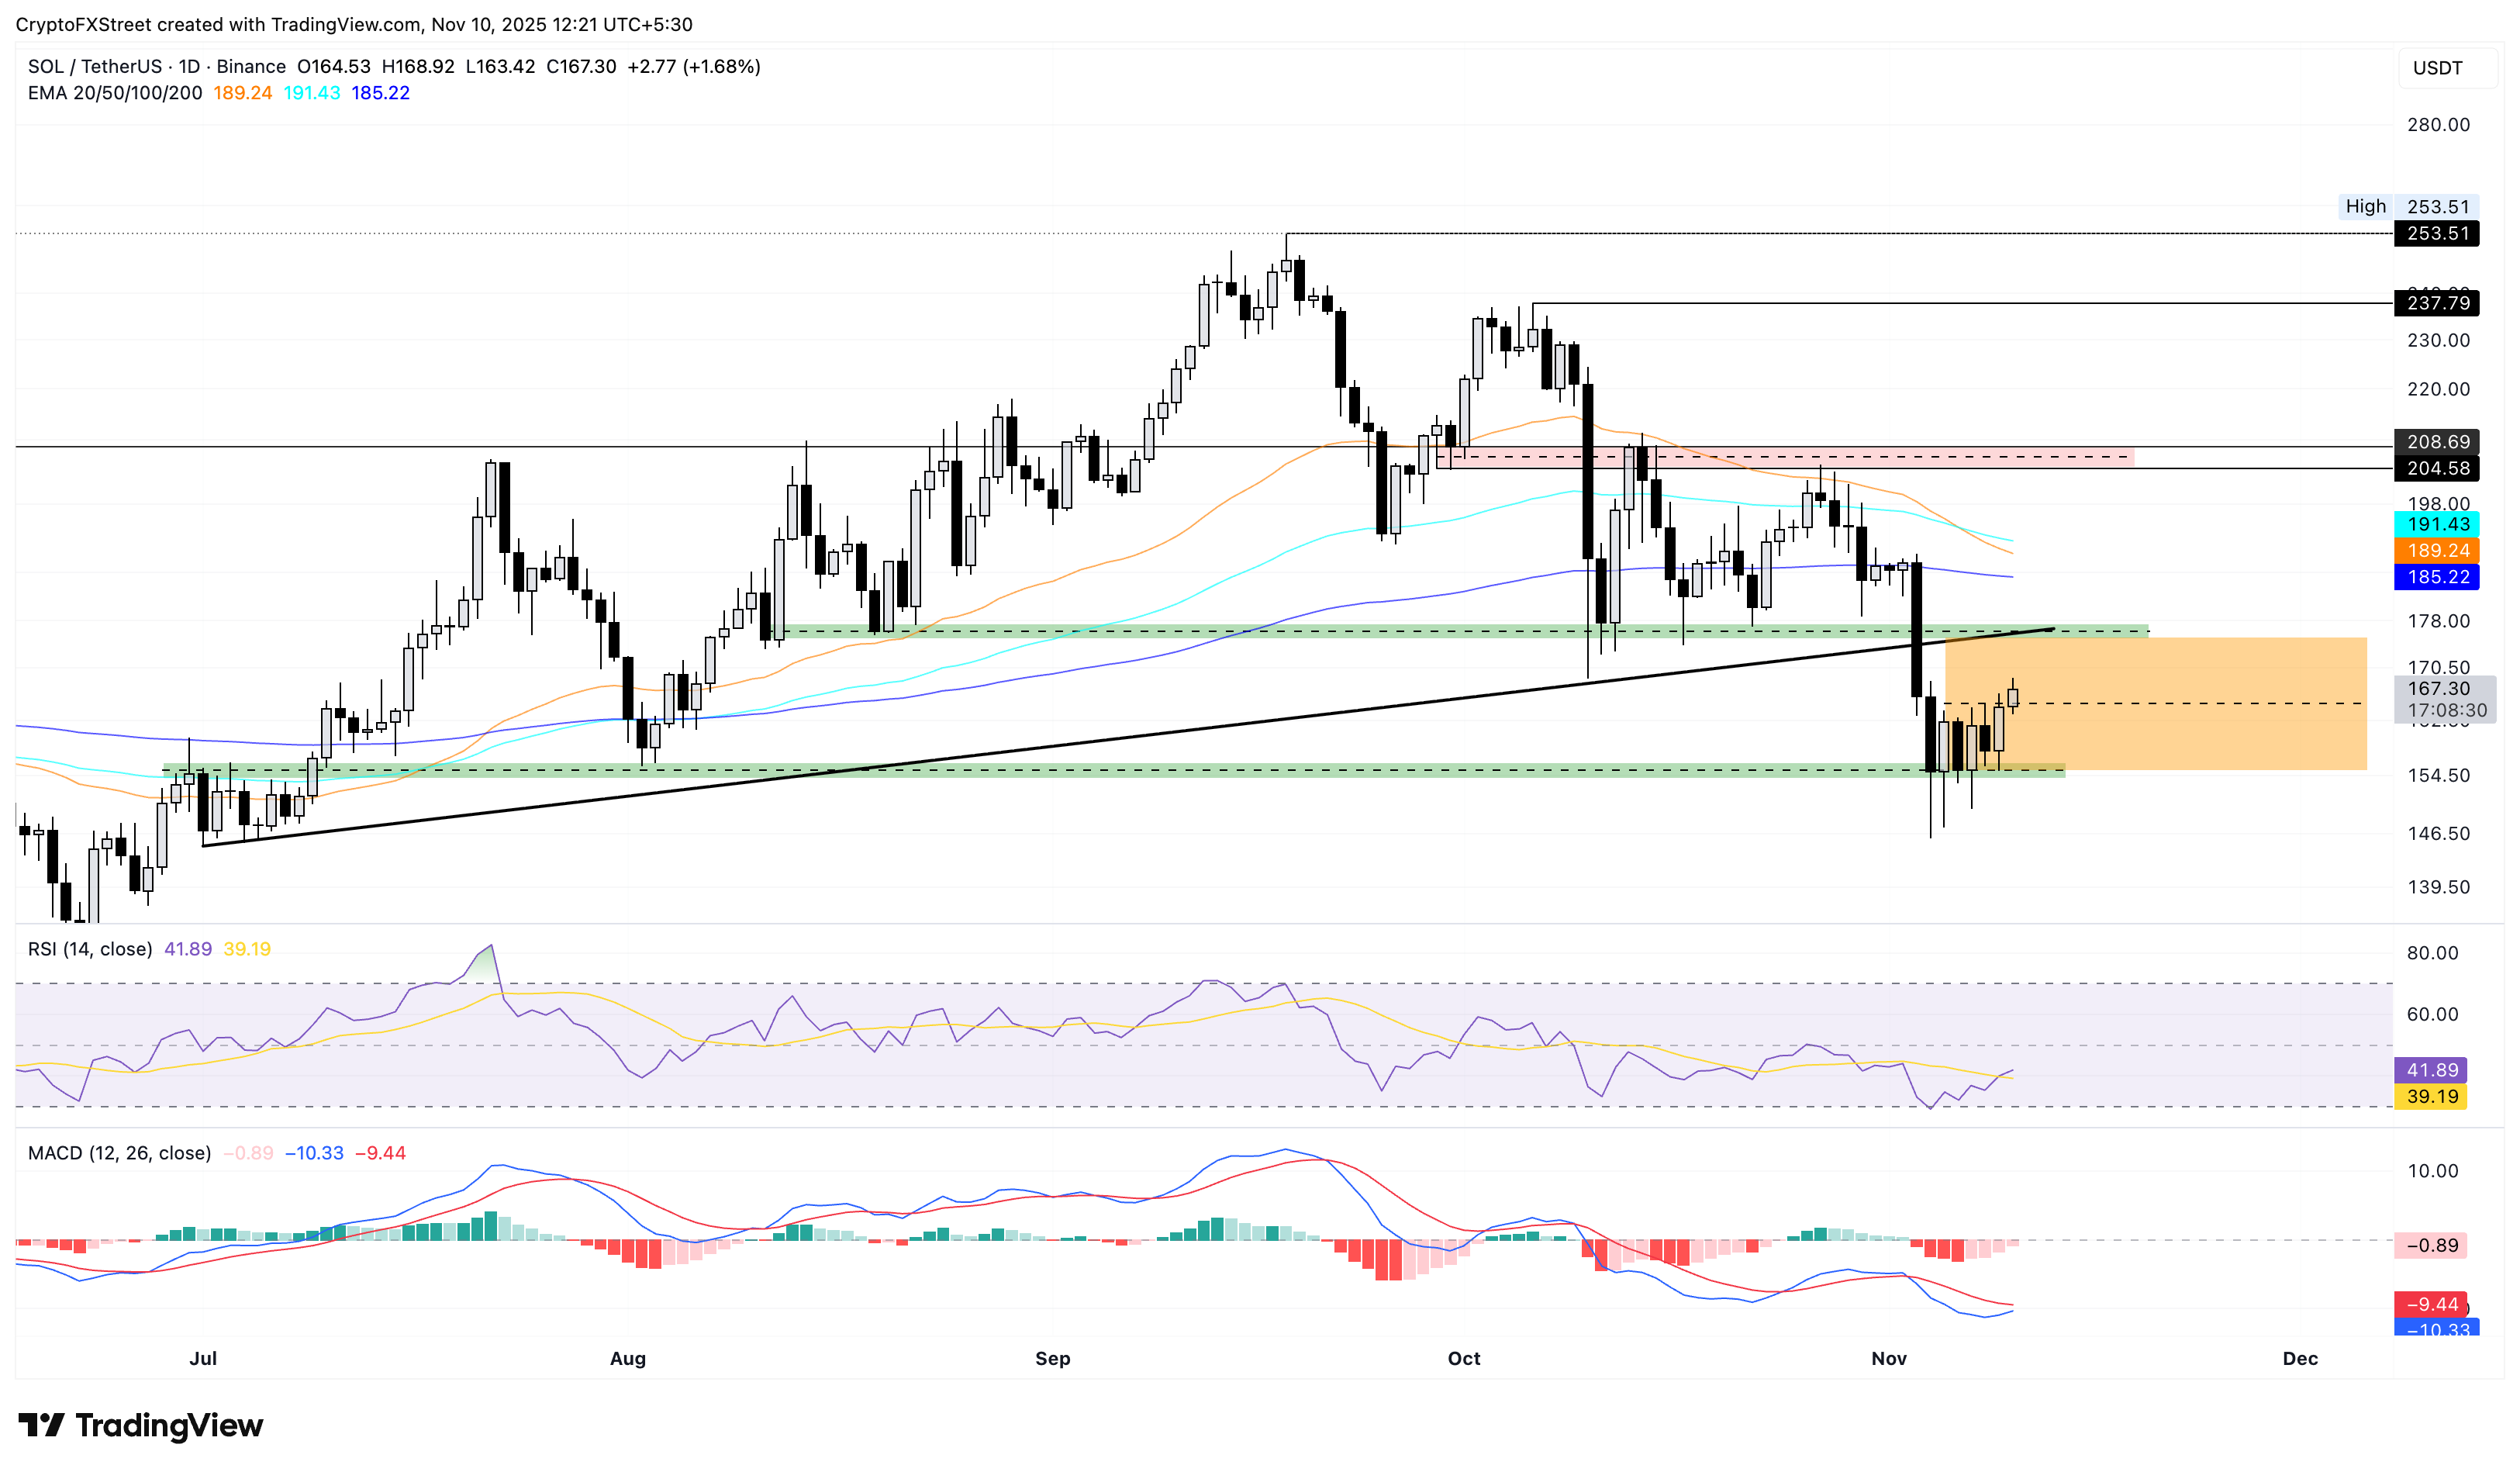
However, if the SOL recovery flips midway, it could threaten the $155 support zone. 

Disclaimer: For information purposes only. Past performance is not indicative of future results.
placeholder
Wall Street Sounds Alarm: "Bitcoin's Four-Year Cycle Invalidated" - Will the Crypto Bull Market Persist?Wall Street Challenges Bitcoin's CyclicalityTradingKey - Recently, Wall Street firms led byJPMorgan, Bernstein, and ARK Invest ignited debate, asserting Bitcoin's four-year cycle is broken. They claim
Author  TradingKey
11 hours ago
Wall Street Challenges Bitcoin's CyclicalityTradingKey - Recently, Wall Street firms led byJPMorgan, Bernstein, and ARK Invest ignited debate, asserting Bitcoin's four-year cycle is broken. They claim
placeholder
Ethereum Price Eyes an Upside Break — But $3,350 Has Other IdeasEthereum is consolidating above $3,200 and its 100-hour SMA after defending $3,150, with a bullish trend line support at $3,180 and an upside breakout hinging on a clean move through $3,320–$3,350, while a drop below $3,150 would reopen $3,040–$3,000 support.
Author  Mitrade
18 hours ago
Ethereum is consolidating above $3,200 and its 100-hour SMA after defending $3,150, with a bullish trend line support at $3,180 and an upside breakout hinging on a clean move through $3,320–$3,350, while a drop below $3,150 would reopen $3,040–$3,000 support.
placeholder
Gold Price Forecast: XAU/USD climbs above $4,250 as Fed rate cut weakens US DollarGold price (XAU/USD) rises to seven-week highs near $4,275 during the early Asian session on Friday. The precious metal extends its upside as the US Federal Reserve’s (Fed) quarter-point rate cut drags the US Dollar (USD) lower. 
Author  FXStreet
19 hours ago
Gold price (XAU/USD) rises to seven-week highs near $4,275 during the early Asian session on Friday. The precious metal extends its upside as the US Federal Reserve’s (Fed) quarter-point rate cut drags the US Dollar (USD) lower. 
placeholder
Judgment on the Fed's December Rate Cut and 2026 Monetary Policy Trend: Identifying Opportunities in the U.S. Stock Market1. IntroductionSince U.S. stocks pulled back from their late-October highs, they have staged a rebound after hitting a cyclical low in mid-to-late November. Currently, the S&P 500 has largely recouped
Author  TradingKey
Yesterday 10: 22
1. IntroductionSince U.S. stocks pulled back from their late-October highs, they have staged a rebound after hitting a cyclical low in mid-to-late November. Currently, the S&P 500 has largely recouped
placeholder
Gemini Deepens Ripple Ties with RLUSD Rollout as Derivatives Arm Secures CFTC NodGemini integrates Ripple's RLUSD on XRPL and secures a CFTC license for prediction markets, though XRP price struggles at $2.02 despite strong ETF inflows.
Author  Mitrade
Yesterday 09: 27
Gemini integrates Ripple's RLUSD on XRPL and secures a CFTC license for prediction markets, though XRP price struggles at $2.02 despite strong ETF inflows.
goTop
quote